
 ?Mathematical formulae have been encoded as MathML and are displayed in this HTML version using MathJax in order to improve their display. Uncheck the box to turn MathJax off. This feature requires Javascript. Click on a formula to zoom.
ABSTRACT
Pedestrian link-ways are important street facility for first-/last-mile mobility. This study compared pedestrians’ walking experiences on sheltered/unsheltered link-ways by collecting their perceived walking time/distance. It is found that, first, pedestrians (51 along sheltered and 49 along unsheltered link-ways) generally walk at a faster pace along unsheltered link-ways as compared to sheltered link-way. Second, participants are found to more likely over-perceive walking times and distances (with odds of three to one) along unsheltered link-way than sheltered link-way, and with more extreme deviations on unsheltered link-ways. Third, sheltered link-ways accrued better Level of Service (LOS) ratings on factors such as weather protection, distance, accessibility/user-friendliness, comfort, safety and level of crowdedness. The study demonstrates value-add application of cognitive bias approach for examining the walking experience, and provides human-centric indicators to justify the provision of shelters to the link-way for the benefits of pedestrian users.
1. Introduction
The prevalence of car-reliance and labour-saving devices has increasingly changed urban lifestyle. In the large literature of urban design, physical activities such as walking and cycling have been well encouraged as a push to good health. A major infrastructural improvement to encourage and promote walking is providing shelter along pedestrian link-ways. In Singapore, the Land Transport Authority (LTA) has been building shelters over existing pedestrian link-ways to provide sheltered connectivity between transport nodes and schools, health care facilities, residential developments and public amenities within a 400 m radius of all Mass Rapid Transit (MRT) stations and within a 200 m radius of all LRT stations and bus interchanges. Sheltered link-ways are also being provided to connect existing bus shelters with high usage to trip generating hubs within a 200 m radius of these bus shelters. Active mobility such as walking, and riding Active Mobility Devices (AMDs), together with bus/rail public transport, are popular urban transport modes nowadays, with benefits in transport mobility, energy conservation, and environmental friendliness. In the year 2017, average daily buses rides in Singapore stood at 3.9 million, for a resident population of 5.5 million, within a land area of 720 km2. A stated intention of the Authority is to have 75% of all peak hour journeys made on public transport, by 2030 (LTA Citation2013).
A variety of indicators has been applied to quantify impacts of commuters’ travelling experience on their subsequent route choice. The likelihood of selecting a given route from among a set of alternative routes is found to be much influenced by the perceived travelling time/distance as well as the preference of individual travellers (Connors and Sumalee Citation2009). The walking journey time/distance would be based on pedestrians’ perceived values and prior experience. It is rationalised that providing shelters to the link-ways, for protection from inclement weather conditions such as rain and hot sunshine, can favourably influence a pedestrian’s perception of the walking journey. Such cognitive bias in the pedestrians’ perceptions provides a rational basis to examine the efficacy of scheme implementation.
This paper aims to study the cognitive bias on infrastructural improvement by evaluating and comparing pedestrians’ perception of walking time/distance and level of service along sheltered versus unsheltered link-ways adjoining MRT stations in Singapore. Walking time and distance perceived by experimental subjects are compared against measured values, based on a journey along 400-m stretches of the link-ways. An indicator by way of an Index of Difference between Perceived and Measured time/distance () is defined to quantify the degree of deviation in the subjects’ perceived walking time and distance. A number of factors, such as crowdedness, weather protection, comfort and accessibility are rated by the subjects on the walking environment to obtain the users’ feelings about the link-way facility. Literature findings are first reviewed in the following Section 2, followed by methodology in Section 3. The results and discussion are then presented in Section 4, and Section 5 concludes the paper.
2. Literature review
2.1. Perceived level of service
The perceived level of service (LOS) of a walking facility can be quantified using a basket of qualitative factors (e.g. convenience, comfort safety, security, economy) as reflecting the pedestrians’ perception of the walking environment (Henson Citation2000). Weather protection is categorised as an important comfort factor that contributes to the walking experience. Sarkar (Citation2003) defined adverse weather protection as the capability of protecting pedestrians from rain, snow, sleet, and extremely high and low temperatures. In Singapore, infrastructural factors were rated by pedestrians in a perception survey conducted by Koh and Wong (Citation2013). Weather protection was ranked first with an average score of 3.5 (on a 4-point scale spanning 1: Not important to 4: Very important) among 810 pedestrian subjects. Link-ways with/without shelters provide different weather conditions (e.g. sun protection, rain protection) for pedestrians. Similarly, in the tropical environment of Malaysia, Ariffin and Zahari (Citation2013) found that 32% of respondents (total number is 126) complained that inclement weather prevent them from walking more often. In addition, 56% of respondents were motivated to walk when weather is good. Mostly, in areas that have extreme weather such as high precipitation and temperature, reasonable weather protection plays a fundamental role that can encourage people to walk. To improve walking environment for pedestrians, Alfonzo (Citation2005) proposed weather buffers (e.g. arcades, canopies) for urban designers who intend to offer protections. Herein, providing sufficient weather protection for travellers (both pedestrians and AMD riders) will improve their perceived LOS, and thus encourage more active mobility travel.
Apart from weather protection, a plethora of variables lies behind a pedestrian’s decision to walk. Therein, physical exercise activities, demographics, safety, residential characteristics and familiarity have been tested on how they affect walking behaviour (Li et al. Citation2005; Loukaitou-Sideris Citation2006; Forsyth et al. Citation2007, Citation2008; Kerr et al. Citation2012; Longo et al. Citation2015; Perchoux et al. Citation2017). Although correlation between infrastructure and traveller behaviour has been identified, the influence of each factor does not affect equally on the pedestrians, nor can the pedestrians accurately perceive those identified factors.
The built environment and its potential impacts on promoting sustainable behavioural patterns of individuals need to be identified based on detailed knowledge of people’s preferences and willingness to comply (Brand Citation2013; Goel and Sivam Citation2015). To encourage sustainable travelling practice (i.e. active mobility) in urban areas is to learn the effective ways to design infrastructure that can easily nudge commuters to adapt as part of their travelling patterns. In Singapore, most pedestrian link-ways were previously open pathways. They have now been retrofitted with shelters within 400 metres of MRT stations (Lee Citation2014). According to Ovstedal and Ryeng (Citation2002), the connection between the different elements of weather conditions and the comfort feeling was indirect while the direct influence is associated with how the pedestrians assess the weather conditions. In the present study, the efficacy (e.g. perceived reduction in walking distance or time, perceived higher satisfaction levels) of providing shelter shall be evaluated, which can be studied by comparing pedestrians’ perceptions of the infrastructure and operating conditions when walking along sheltered link-ways versus unsheltered link-ways, for the case of Singapore.
2.2. Cognitive bias
In the realm of psychology, Watson (Citation1919) introduced a hypothesis into psychological theory which states that ‘given the stimulus, psychology can predict what the response will be; or, on the other hand, given the response, it can specify the nature of the effective stimulus’. With regard to perception, stimuli can be visual (sight), auditory (sound), tactile (touch), olfactory (smell), or gustatory (taste). According to Berlyne (Citation1960), apart from stimulus inputs, level of attention or awareness would also elicit different subjects’ responses. Specifically, Nutter and Esker (Citation2006) proposed ‘just noticeable difference threshold’ measurement to quantify the difference between the actual change in a physical stimulus and the perceived change. Similarly, cognitive bias is defined as a systematic pattern of deviation from norm or rationality in judgement (Buss Citation2005). It is claimed that individuals could create their own ‘subjective social reality’ from their perception of the input factors.
In transport study, cognitive bias has been applied to understand how the elements of the travelling environment affect travellers’ general comfort and satisfaction. For instance, Von Sturmer et al. (Citation1968) carried out an experiment among 36 subjects and found that, the higher the level of distraction, the less time a subject will perceive. Another study by Chowdhury et al. (Citation2015) found that commuters perceive reduction of travel time and cost as influenced by certain comfort amenities (such as shelter, information and lighting) at bus interchange. By conducting a comparison of perceived distance at interesting versus mundane places, Crompton and Brown (Citation2006) found that small-scale places without cars may seem much larger than expected although the actual distance was measured as being equal. Therefore, it is important to pay attention to how travelling environment influences pedestrians’ subconscious perception, and not only how the travelling environment is built. Moreover, the quantification of the degree of perception deviation needs to be as comprehensive as possible. Both perception of travel time/distance and perceived LOS should be considered at the same time.
In fact, different cognitive processes underlie two paradigms, when participants are aware they are being timed (prospective) and when they are unaware they are being timed (retrospective) (Zakay and Block). In the present study, participants were unclear of the actual time/distance until they had completed walking the selected stretch. Only at the end of the journey, the participants were requested to make a judgement on their perception of time, distance and general level of satisfaction.
Various technical methods to quantify travellers’ perception have been applied to study the efficacy of infrastructural improvement. Stone and McBeath (Citation2010) applied spatial distance estimation on 12 subjects (6 males and 6 females) and found that gender difference can influence distance estimation. González et al. (Citation2015) used perception error rate of time to measure distorted perception and found that error rate decreases as real travel time increases. Herein, perception deviations of walking time and distance exist, and are influenced by operating conditions, socio-demographic and infrastructural factors. For this study, the deviations perceived in walking distance or time as well as perceived LOS were examined by comparing the perceptions of the subjects when walking along sheltered link-ways versus unsheltered link-ways.
3. Methodology
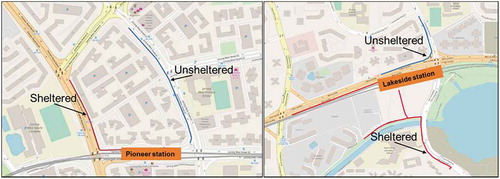
Cognitive bias of pedestrians’ perceived time, distance and LOS can be investigated by arranging a walking journey with and without some factors whose influence on perception is to be assessed. In this study, on-site survey was carried out to examine the difference in perception of time, distance and LOS along sheltered versus unsheltered link-ways. The study was approved by the Institutional Review Board at Nanyang Technological University, Singapore. Two sites each (four in total), adjoining MRT stations in Singapore, were selected for conducting the survey ().
Figure 1. Journey survey site locations (Google, n.d.)
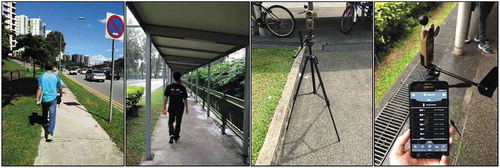
An illustration of the observed activities on both sheltered and unsheltered link-ways are shown in . For the survey, participants were randomly selected during afternoon (14:00 to 16:30 hrs) and evening periods (16:30 to 19:30 hrs). They were asked to walk along a 400-m stretch, and an interviewer trailed along with each participant till the end point (so as to prevent interrupting their walking pace and perception of time/distance), which was then followed by an interview. A timer was started at the onset of each journey to record the exact time that the subject took to walk the defined stretch. Participants were not informed in advance of the actual time/distance being paced. Upon reaching the end point, the participants were asked to report their perceived travel time (within 10-second resolution) and distance for the journey. Each participant was provided with an honorarium of S$10 (≈US$7).
Figure 2. Field survey of participants on sheltered (above) and unsheltered (below) link-ways
Weather condition monitoring was done in parallel to the walking survey along sheltered and unsheltered link-ways by using a Heat stress tracker (). The tracker was set 1.2-m high on the side of the link-way to minimise the obstructive effects on link-way users.
Figure 3. On-site setup of the heat stress tracker
In total, 100 participants consented to participate in the study. More than 10 subjects at each designed section were interviewed. The distribution of all participants are recorded in . The results are discussed in the following section.
Table 1. Distribution of participants
4. Results and discussions
4.1. Results
The perceived and measured values for walking time and distance are recorded when each participant completed the 400-m journey. The summary statistics are shown in . The mean values of the perceived walking time are greater than those of actual walking time as measured by the interviewers. The degrees of over-estimation are more severe for unsheltered link-ways than for sheltered link-ways. In another word, the cognitive bias is observed to be more severe on unsheltered link-ways.
Table 2. Summary statistics of walking times and distances (n = 100)
The results for paired-sample t-test of the means between perceived and measured walking times and walking distances are shown in . Paired sample t-tests show that there is significant difference in the mean values of time and distance for unsheltered scenario, with the difference being more distinctive for walking time. In contrast, there is no significant difference in the mean values for sheltered scenario. The findings also suggest that walking time in unsheltered scenario is a more discriminatory indicator in pedestrians’ cognitive bias on the pace of mobility along link-ways. For further research, one can rely more on time perception since people can make a more reliable judgement of time rather than distance.
Table 3. Two-tailed paired-sample t-test results for perceived and measured walking times and distances
Walking speed is computed from the actual time taken by each participant as measured by the interviewer. The cumulative distribution is shown in . The (average ± SD; median) walking speeds are: (1.19 ±0.02; 1.17) m/s for sheltered link-ways, (1.21 ±0.02; 1.21) m/s for unsheltered link-ways, and (1.20 ±0.02; 1.19) m/s overall. It is seen that pedestrians generally walk at a faster pace along unsheltered link-ways as compared to sheltered link-ways, yet they perceived as walking longer and farther in unsheltered than sheltered linkways.
Figure 4. Cumulative percentage of walking speeds in sheltered and unsheltered link-ways
4.2 Discussions
In order to evaluate the degree of cognitive bias between the perceived and measured values, a dimensionless indicator by way of Index of Difference between Perceived and Measured time/distance is defined to quantify the difference between perceived and measured values of the walking time and distance, as shown in EquationEquation (1)
(1)
(1) .
> 0 when there is over-estimation, and vice-versa. The
indicator is useful for counting the frequency of over-estimation and under-estimation.
where i is participant number; for walking time, and
for walking distance.
values for walking time and distance are calculated for each participant for which the points are plotted as shown in , segmented by sheltered and unsheltered link-ways. The
points are scattered above (over-estimation) and below (under-estimation) the neutral horizontal line (
= 0%). Whereas there are higher cases of under-estimation of walking time and distance along sheltered linkways (left half of plot), the odds are about three to one in favour of over-estimation for unsheltered link-ways. Hence, it can be seen that walking time and distance, as perceived by the pedestrians, are twice and thrice as likely to be over- perceived (than under- perceived) when walking in unsheltered conditions.
Figure 5. for sheltered and unsheltered link-ways (n = 100)
Based on overall results of mean value, males had higher mean
values than females, especially for walking time at unsheltered link-ways (). The results for walking distance are mixed, with positive mean
values for males and mixed values for females. Overall, it appears males have greater degrees of over-estimation than females.
Figure 6. Mean by gender
The estimation of walking time across the six age bands is rather mixed (). The limitations of a small sample size for multi-class classification would make the distribution indicative only. It appears that as pedestrians get older, the degree of over-estimation seems to get more severe.
Figure 7. Mean by age
The mean and median values during the afternoon period are higher than those for evening period () despite the greater utility of shelter in the afternoon than in the evening.
Table 4. Summary statistics of in afternoon and evening periods
Temporal temperature was lower, and relative humidity was higher, along sheltered link-ways, relative to unsheltered link-ways (). Also, fluctuations of temperature and relative humidity were less in sheltered link-ways as compared to unsheltered link-ways. This shows that while providing the shelter reduces ambient temperature, it has the dis-benefit of elevating the relative humidity. The greenery (i.e. grass or trees) along both sheltered and unsheltered link-ways is quite similar, therefore, it is not difficult to envisage that the difference in relative humidity and temperature is due to the provision of the shelter which might prevent evaporation beneath the shelter.
Figure 8. Relative humidity and temperature variations
4.3. Pedestrians’ satisfaction with the provision of shelters
As shown in , under-sheltered link-ways, survey participants rated relatively higher satisfaction score for factors like weather protection, distance, accessibility/user-friendliness, comfort, safety. In contrast, when along unsheltered link-ways, participants rated higher satisfaction score for security (fear of theft or vandalism involving bicycles). For factors like crowdedness, ancillary facilities, cleanliness and security (in particular bicycle theft), there is no distinctive difference in the satisfaction scores for sheltered and unsheltered link-ways. The positive users’ experience in walking under sheltered link-ways makes their perceived of time and distance closer to the true values; whereas the relatively less positive users’ experience in walking under un-sheltered link-ways elongated their perception of time and distance (). On the premise that pedestrians would walk at a constant speed, the perception of greater walking time is translated into longer distance for walking under-unsheltered link-ways. Therefore, the perception of time and distance can be biased by the environment – the less comfortable journey seems to be longer than under the more comfortable journey. The actual survey questions are attached in the
Figure 9. Comparison of satisfaction score of affecting factors between sheltered and unsheltered link-ways
5. Conclusions
This study reports empirical findings of pedestrians’ perceived values in response to provision of a shelter along the pedestrian link-way. The performance of link-way shelter was examined by way of cognitive bias on journey time and distance perceptions, as well as Level-of-Service (LOS) ratings. For the experiment, a sample of 100 subjects walked along a 400-m stretch of link-way, 51 along sheltered link-ways, and 49 along unsheltered link-ways.
A strong tendency was found for subjects to over-perceive their journey times and distances when walking along the link-ways. This tendency is much greater, at odds of three to one, for subjects walking along unsheltered link-ways. The degree of over-perception was also more extreme along unsheltered link-ways. This shows that the utility of providing shelters which can make the journey appear not as far as when walking in the open.
Meanwhile, more favourable ratings in the LOS were accorded to the sheltered link-ways in such environmental factors as weather protection, distance, accessibility/user-friendliness, comfort, safety and level of crowdedness. On the other hand, there was a better score on security (fear of theft or vandalism involving bicycles) along the unsheltered link-ways. Again, there are strong merits in the provision of shelters towards enhancing the travelling environment for the pedestrians.
This study demonstrates the value-add applications of human-centric indicators to justify the provision of shelters to the link-way for the benefits of pedestrians. Cognitive bias in pedestrians’ perception of walk time is found to be a discriminant indicator. Likewise, users’ ratings of the operating environment show that the sheltered link-ways are more conducive mobility environment than open link-ways.
6. Implications and outlook
The importance of walking as a stimulation of good health and public transport has been well established in the public health and transport literature. Infrastructural improvements shall need to be examined carefully to identify efficient schemes to encourage active mobility in the urban areas (Joh et al. Citation2012). The findings of user-centric indicators show very positive values in enhancing the quality needs of the pedestrian, by way of providing shelters to the pedestrian link-ways. Currently in Singapore, sheltered link-ways are provided if major activity centres such as schools, health care facilities are within 200 m to 400 m radius of transport nodes. By 2030, eight in 10 homes would be within 10-minute walk from a train station (LTA Citation2013).
Positive findings from this study could provide the impetus for the Authority to explore extending the coverage of covered link-ways given the prevalence of wet weather in Singapore (Meng et al. Citation2015); caution must be exercised however on how far the extension should be, as the authors acknowledged that there will also be a limit on how far commuters are willing to walk from the transport node. It is also of great importance to note different constraints across regions or countries as cultural effects on individuals might affect their acceptance towards walking activity. As such, it may be worthwhile, as part of future research, to examine and determine commuters’ threshold level in terms of walking distance among countries or regions, instead of proposing a universal standard.
In addition, this study serves as a starting point by revealing pedestrians’ different perceptions of walking time/distance on sheltered/unsheltered link-ways. Future research can focus on modelling the associations between pedestrians’ perception deviation on both sheltered/unsheltered link-ways to understand the impacts of reasons why these deviations occur and how to promote walking activities by influencing pedestrians’ perceptions.
Acknowledgements
This research study is supported by Land Transport Authority (LTA), and Singapore Ministry of Education Academic Research Fund Tier 2 (MOE2014-T2-2-097), to which the authors express their gratitude. The authors would like to thank undergraduate students’ helpers who contributed in data collection and data extraction.
Disclosure statement
There is no conflict of interest to be declared.
Additional information
Funding
References
- Agrawal AW, Schimek P. 2007. Extent and correlates of walking in the USA. Transp Res Part D. 12(8):548–563. doi:https://doi.org/10.1016/j.trd.2007.07.005.
- Alfonzo MA. 2005. To walk or not to walk? The hierarchy of walking needs. Environ Behav. 37(6):808–836. doi:https://doi.org/10.1177/0013916504274016.
- Ariffin RNR, Zahari RK. 2013. Perceptions of the urban walking environments. Procedia-Social Behav Sci. 105:589–597. doi:https://doi.org/10.1016/j.sbspro.2013.11.062.
- Berlyne DE. 1960. Conflict, Arousal and Curiosity. New York: McGraw Hill. doi:https://doi.org/10.1037/11164-000.
- Brand R. 2013. Facilitating sustainable behavior through urban infrastructures: learning from Singapore? Int J Urban Sustain Dev. 5(2):225–240. doi:https://doi.org/10.1080/19463138.2013.780175.
- Buss DM (Ed.). 2005. The handbook of evolutionary psychology. Hoboken, New Jersey: John Wiley & Sons.
- Chowdhury S, Ceder AA, Schwalger B. 2015. The effects of travel time and cost savings on commuters’ decision to travel on public transport routes involving transfers. J Trans Geogr. 43:151–159. doi:https://doi.org/10.1016/j.jtrangeo.2015.01.009.
- Connors RD, Sumalee A. 2009. A network equilibrium model with travellers’ perception of stochastic travel times. Transp Res Part B. 43(6):614–624. doi:https://doi.org/10.1016/j.trb.2008.12.002.
- Crompton A, Brown F. 2006. Distance estimation in a small-scale environment. Environ Behav. 38(5):656–666. doi:https://doi.org/10.1177/0013916505281571.
- Forsyth A, Hearst M, Oakes JM, Schmitz KH. 2008. Design and destinations: factors influencing walking and total physical activity. Urban Stud. 45(9):1973–1996. doi:https://doi.org/10.1177/0042098008093386.
- Forsyth A, Oakes JM, Schmitz KH, Hearst M. 2007. Does residential density increase walking and other physical activity? Urban Stud. 44(4):679–697. doi:https://doi.org/10.1080/00420980601184729.
- Goel S, Sivam A. 2015. Social dimensions in the sustainability debate: the impact of social behaviour in choosing sustainable practices in daily life. Int J Urban Sustain Dev. 7(1):61–71. doi:https://doi.org/10.1080/19463138.2014.953537.
- González RM, Martínez-Budría E, Díaz-Hernández JJ, Esquivel A. 2015. Explanatory factors of distorted perceptions of travel time in tram. Transp Res Part F Traffic Psychol Behav. 30:107–114. doi:https://doi.org/10.1016/j.trf.2015.02.006.
- Henson C. 2000. Levels of service for pedestrians. Institute of transportation engineers. Ite J. 70(9):26.
- Joh K, Nguyen MT, Boarnet MG. 2012. Can built and social environmental factors encourage walking among individuals with negative walking attitudes? J Plann Educ Res. 32(2):219–236. doi:https://doi.org/10.1177/0739456X11427914.
- Kerr J, Rosenberg D, Frank L. 2012. The role of the built environment in healthy aging: community design, physical activity, and health among older adults. J Plann Lit. 27(1):43–60. doi:https://doi.org/10.1177/0885412211415283.
- Koh PP, Wong YD. 2013. Influence of infrastructural compatibility factors on walking and cycling route choices. J Environ Psychol. 36:202–213. doi:https://doi.org/10.1016/j.jenvp.2013.08.001.
- Lee J.X. 2014. Longer sheltered walkways within 400m radius of MRT stations for commuters. The Straits Times. Available from: https://www.straitstimes.com/singapore/transport/longer-sheltered-walkways-within-400m-radius-of-mrt-stations-for-commuters.
- Li F, Fisher KJ, Brownson RC, Bosworth M. 2005. Multilevel modelling of built environment characteristics related to neighbourhood walking activity in older adults. J Epidemiol Community Health. 59(7):558–564. doi:https://doi.org/10.1136/jech.2004.028399.
- Longo A, Hutchinson WG, Hunter RF, Tully MA, Kee F. 2015. Demand response to improved walking infrastructure: A study into the economics of walking and health behaviour change. Soc Sci Med. 143:107–116. doi:https://doi.org/10.1016/j.socscimed.2015.08.033.
- Loukaitou-Sideris A. 2006. Is it safe to walk? Neighborhood safety and security considerations and their effects on walking. J Plann Lit. 20(3):219–232. doi:https://doi.org/10.1177/0885412205282770.
- LTA. 2013. Land transport master plan 2013, land transport authority. Singapore. Available from: https://www.lta.gov.sg/content/dam/ltagov/who_we_are/statistics_and_publications/master-plans/pdf/LTMP2013Report.pdf.
- Meng M, Zhang J, Wong YD, Au PH. 2015. Effect of weather conditions and weather forecast on cycling travel behavior in Singapore. Int J Sustain Transp. 10(9):773–780. doi:https://doi.org/10.1080/15568318.2016.1149646.
- Nutter FW, Esker PD. 2006. The role of psychophysics in phytopathology: the Weber–Fechner law revisited. Eur J Plant Pathol. 114(2):199–213. doi:https://doi.org/10.1007/s10658-005-4732-9.
- Ovstedal L, Ryeng E. 2002. Understanding pedestrian comfort in European cities: how to improve walking conditions. Cambridge (UK): In European Transport Conference.
- Perchoux C, Enaux C, Oppert JM, Menai M, Charreire H, Salze P, Roda C. 2017. Individual, social, and environmental correlates of active transportation patterns in French women. Biomed Res Int. 2017. doi:https://doi.org/10.1155/2017/9069730.
- Sarkar S. 2003. Qualitative evaluation of comfort needs in urban walkways in major activity centers. Transp Q. 57(4):39–59.
- Stone JP, McBeath MK. 2010. Gender differences in distance estimates when exposed to multiple routes. Environ Behav. 42(4):469–478. doi:https://doi.org/10.1177/0013916509341790.
- Tudor-Locke C, Ham SA. 2008. Walking behaviors reported in the American time use survey 2003–2005. J Phys Act Health. 5(5):633–647. doi:https://doi.org/10.1123/jpah.5.5.633.
- Von Sturmer G, Wong T, Coltheart M. 1968. Distraction and time estimation. Q J Exp Psychol. 20(4):380–384. doi:https://doi.org/10.1080/14640746808400178.
- Watson JB. 1919. Psychology from the standpoint of a behaviorist. Philadelphia: Lippincott.
- Witten K, Pearce J, Day P. 2011. Neighbourhood destination accessibility index: a GIS tool for measuring infrastructure support for neighbourhood physical activity. Environ Plan A. 43(1):205–223. doi:https://doi.org/10.1068/a43219.
- Yang Y, Diez-Roux AV. 2012. Walking distance by trip purpose and population subgroups. Am J Prev Med. 43(1):11–19. doi:https://doi.org/10.1016/j.amepre.2012.03.015.
- Zakay, D., & Block, R. A. 2004. Prospective and retrospective duration judgments: an executive-control perspective. Acta Neurobiologiae Experimentalis, 64(3), 319–328.
Appendix.
Level of service (LOS) rating parameters.