
ABSTRACT
This paper takes an urban planning perspective on environmental justice by separately analysing vulnerable socioeconomic groups for multiple environmental burden (EB) at the neighbourhood level in Berlin. We selected five socioeconomic groups: i) beneficiaries of social welfare, ii) inhabitants with migration background, iii) old-age poverty, iv) child poverty, and v) single-parent households. Four ecological indicators, i) air pollution, ii) noise pollution, iii) bioclimate (heat stress), and iv) lack of urban green spaces were merged to assess multiple EB at the Planning Area Level. Combining environmental and socioeconomic maps we identified hotspots of environmental injustice (EIJ) and demonstrate that selected vulnerable socioeconomic groups are disproportionately more affected by multiple EB than population not belonging to these groups. Some of the identified hotspots overlap, except for single-parent households. Finally, multi-purpose planning measures that mitigate the EBs considering the needs of the socioeconomic groups are recommended.
Introduction
The concept of environmental justice (EJ) has spread internationally since its beginnings during the environmental grassroot movements in the USA during the 1980s (Agyeman et al. Citation2010). In general, EJ can be understood as an equitable relation between environment and society, incorporating three dimensions: environmental, societal, and relational. There exist several ways of analysing EJ and therefore of operationalising these dimensions. This study’s EJ analysis in the city of Berlin, Germany, will look at the geospatial relation between the most prominent environmental burdens and socioeconomic groups considered most vulnerable. The approach will be contextualised with existing literature in the following section before presenting the research aims, methods used and insights on EJ in Berlin. Finally, results will be discussed, and planning recommendations given.
The concept of EJ in research
The environmental dimension. EJ movements focussed initially on environmental hazards resulting from industrial sites, while the environmental dimension of EJ now comprises environmental ‘bads’ and goods alike. Injustice is understood broadly, ranging from health impacts to community isolation (Holifield Citation2013). Most studies analyse EJ in terms of one environmental aspect such as heat exposure, air or noise pollution, the presence of vegetation, urban green spaces (UGS) or blue infrastructure (Raymond et al. Citation2016). These environmental factors may be characterised by sub-components, e.g. different air particles or traffic data for air quality (Lakes et al. Citation2014; Fairburn et al. Citation2019). To a lesser extent, environmental indices combine two related environmental factors, such as air pollution which aggravates heat stress, or vegetation for its multifaceted benefits on air quality, heat reduction, noise alleviation and well-being (Kabisch and Haase Citation2014). Despite the variety of EJ research, perspectives on multiple or cumulative burdens remain limited. One example is Fairburn et al. (Citation2009) and for different air pollutants Lanier et al. (Citation2019). Most of the studies presently available conduct their analyses of the factors separately and neglect their interconnected nature (Lakes et al. Citation2014).
The societal dimension. The rationale behind the societal dimension is a presumed higher susceptibility to impacts and a lower capability to withdraw or mitigate the negativities due to inequality according to socioeconomic status (SES) (Raddatz and Mennis Citation2013; Mitchell and Chakraborty Citation2015). Socioeconomic indicators such as household income, education, unemployment, minority status or age are often combined and applied at both individual and neighbourhood level (Neimanis et al. Citation2012), substituting the operationalisation via racial and ethnic minorities. In a new reasoning, job accessibility was also used for the socioeconomic considerations (Zhao et al. Citation2018). Considerable attention has been given to over 65’s and children’s vulnerability although without considering their socioeconomic status. EJ is rarely investigated for single-parent families (Downey and Hawkins Citation2008; Buck et al. Citation2019).
The relational dimension. Considered the core of EJ, it addresses concerns regarding the unequal distribution of environmental hazards. Studies applying a spatial analysis of EJ are the most common. However, part of the equitable relationship EJ aims at is procedural justice, i.e. opportunities to participate in decision-making (Day Citation2010). It has been argued that involvement per se can be beneficial for the perception of equality (Anguelovski Citation2013). Capture of individual perceptions within the hotspots has been conducted, among others, by Day (Citation2010) and is regarded as a necessary follow-up to achieve EJ in practice (Edwards et al. Citation2016).
Each of the presented dimensions is of special relevance to cities. In cities, populations and their physical assets are most concentrated, resulting in elevated pressure on the environment and in the relationships between individuals and their surrounding environment across multiple scales (Fernández and Wu Citation2016). Urbanisation, the growing number of people living in cities, and specific urban environmental conditions are therefore widely mentioned in EJ literature (Mason et al. Citation2017). With its connection to urban research, EJ has also gained much attention in public health research in Europe (Annerstedt Van Den Bosch et al. Citation2016). Moreover, EJ was coined as an opportunity as well as an important aspect of sustainable development which should integrate social justice into its environmental concerns (Agyeman et al. Citation2010). However, the implementation of EJ into practice has been limited and is hampered by its complexity and variety of approaches as evidenced by the lack of guidelines (Strelau and Köckler Citation2015). At EU level, Petrić (Citation2019) identifies a lack of clarity regarding legal implications of findings on environmental injustice. Clarity is also hampered by structuring recommendations thematically rather than along planning process steps (Böhme et al. Citation2019). Similarly, planning theories lack integration of the different justice-related aspects of EJ which might initiate its implementation into practice (Ntiwane Citation2018).
Applications of the EJ research in Germany
EJ research in Germany, like in Europe, is primarily analysed in terms of socioeconomic status (Laurent Citation2011). Research on EJ in Germany is growing, and studies have been conducted for Berlin (Lakes and Klimeczek Citation2011; Franck et al. Citation2014; Kabisch and Haase Citation2014), Munich (Schüle et al. Citation2017), Hamburg (Raddatz and Mennis Citation2013), and smaller cities such as Hannover, Leipzig and Mannheim (Buck et al. Citation2019; Kabisch Citation2019; Wen et al. Citation2020) or at the national scale or by comparing cities (Kohlhuber et al. Citation2006; Wüstemann et al. Citation2017; Rüttenauer Citation2019). As in international studies, the pattern of EJ is analysed predominantly for one environmental factor in relation to several socioeconomic characteristics. EJ has also been recognised as a topic in public administration. It is implicitly considered in German public health programmes. Inequality assessments are also demanded to implement air pollution action programmes (Riedel et al. Citation2021). EJ also was explicitly put on the agenda of the state of North-Rhine-Westphalia (Hornberg and Pauli Citation2007). Furthermore, it is integrated in the Environmental Atlas (Umweltatlas) of Berlin (EAB) for monitoring purposes (Klimeczek Citation2019), also analysing cumulative impacts on a socioeconomic core index (Senatsverwaltung für Stadtentwicklung und Umwelt, editor. Citation2015b).
This paper will focus on geographical distribution of EBs, allowing the identification of hotspots as a first step to prioritise areas for in-depth and on-site analysis. Berlin was chosen as a case study, because it is currently experiencing EJ-relevant dynamics of population growth and housing price rises (Thomschke Citation2015), potentially aggravating social inequalities with regards to housing and environmental conditions. Moreover, Berlin being subject to EJ monitoring and studies (Kleinschmit et al. Citation2011; Kabisch and Haase Citation2014; Lakes et al. Citation2014) it offers the possibility to explore the difference of conclusions on EJ if distinct socioeconomic groups (SEGs) are analysed separately, and to a lesser extent, if cumulative effects of EBs are accounted for. Berlin’s 447 living environment areas (Lebensweltlich orientierte Räume) allow for addressing EJ at a suitable scale (Strelau and Köckler Citation2015; Mason et al. Citation2017), i.e., the neighbourhood-level. These have also been used as unit of analysis by the existing EJ studies against which implications will be compared.
For the spatial approach of research, EJ will be defined as dealing with the unequal spatial distribution of multiple environmental burden (EB) concerning selected socioeconomic groups (SEGs).
Planning advice will be given regarding the implications that result from differences in EJ for our five selected SEGs, which will be compared in a spatial analysis using an assessment of multiple environmental conditions. Recommendations will need to also consider the dilemma urban planners face in a dense urban environment (Anguelovski Citation2013).
Our research questions are therefore threefold:
Are specific vulnerable socioeconomic groups disproportionally exposed to multiple environmental burden in Berlin?
Where are the hotspots of environmental injustice (EIJ) in Berlin?
What are the implications for urban planning?
Material and Methods
Study area
Berlin, capital city, city state and one of the 16 federal states of Germany is in the north-east of the country (52° 31` 12`` N and 13° 24` 36`` E). The total area of Berlin is approximately 892 km2 (Senatsverwaltung für Stadtentwicklung und Umwelt Citation2016b). The Land Use Plan was updated in 2015 and provides a differentiated view of 52 land use types in Berlin, grouped into residential, industrial, public, traffic, green and other uses. Green and open spaces account for 47.4% of the total area (including, among others, water bodies, forested and unforested areas, allotment gardens). Transport and infrastructural uses, make up around 20% of the total city area (Senatsverwaltung für Stadtentwicklung und Umwelt Citation2016b). About 33.9% of surface was sealed in 2016 due to various inner-city land uses (Senatsverwaltsverwaltung für Stadtentwicklung und Wohnen, editor Citation2017c). Built-up areas are under different uses (e.g. residential or commercial uses), with a sealing rate of between 26.7% (weekend homes) and 83.2% (inner city use characterised as essentially important for services, commerce and cultural/scientific institutions) (Senatsverwaltung für Stadtentwicklung und Umwelt Citation2016b). The spatial distribution of land uses according to sealing rate follows an urban-rural gradient with most forested and green areas located in the south-eastern, south-western (Grunewald forest) and north-western outskirts. The population has fluctuated over the past decades but increased in the year 2019 to approximately 3.77 million inhabitants (Amt für Statistik Berlin-Brandenburg Citation2020), the highest value for 80 years and the largest population of German cities (Statistisches Bundesamt, editor Citation2017). The population density is about 3,948 inhabitants per km2. Berlin is home to people from over 100 countries (Amt für Statistik Berlin-Brandenburg Citation2020). The fraction of inhabitants with a migration background is about 27.7% and is steadily growing (Senatsverwaltung für Stadtentwicklung und Umwelt Citation2015a).
The administrative management, unified in 2006, allows planning and forecasting of demographic and social development at several hierarchical levels (Senatsverwaltsverwaltung für Stadtentwicklung und Wohnen, editor Citation2017a). These are grouped as living environment areas (Lebensweltlich orientierte Räume – LOR). Starting from the household address up to the district, this hierarchy comprises a structure for planning that is suitable for a wide range of different questions. The most local level contains 447 planning areas (PLA – congruent with LORs), which were chosen as level of analysis due to the possibility of carrying out a small-scale analysis. Statistics were presented and discussed on the level of the12 districts.
Socioeconomic and environmental indicators
Hotspots of EIJ were identified by comparing the socioeconomic and environmental layers as per-PLA assessment in a spatial analysis (ArcGIS Version 10.4.1). The socioeconomic and environmental evaluation was based on descriptive statistical methods (RStudio Version 3.5). Spatial joins were used to geospatially link the PLAs with environmental indicator.
Social indicators were taken from the Monitoring Social Urban Development Berlin (MSUD) published in 2015 with survey data of the years 2013 and 2014. They are provided at PLA level (Senatsverwaltung für Stadtentwicklung und Umwelt Citation2015a). Planning areas with small population (<300 inhabitants) or high outlier values were excluded from the MSUD. In 435 out of a total of 447 PLAs, five out of a total of 21 social indicators identified by the MSUD were examined. Missing PLAs correspond to a low percentage (2.7%) of Berlin’s area. Considering these population groups most vulnerable to key EBs, we selected i) beneficiaries of social welfare, ii) inhabitants with migration background, iii) old-age poverty, iv) child poverty, and v) single-parent households. These groups represent a heterogenous picture of the socioeconomic background considered in most literature on EJ. Moreover, new aspects so far rarely considered by literature (e.g., single-parent households) are analysed. Definitions are given in . The 435 PLAs were evaluated using a four-class system adopted from the MSUD. The MSUD provided information about the local distribution of each group in Berlin. The percentages of each group in comparison of the total population in the individual PLAs were used to build the SES classes based on mean values and standard deviations. The classes thus inform about the percentage (1: ‘below average’ to 4: ‘strongly above average’) share of the selected group’s population to all inhabitants in the respective PLA (). Based on the SES classes built, the spatial distribution of the groups at PLA level for Berlin was determined. Socioeconomic hotspots with an above average incidence of vulnerable groups, defined as class 4 or class 3 PLAs, were identified.
Table 1. Definition of the five selected socioeconomic groups (Senatsverwaltung für Stadtentwicklung und Umwelt Citation2015a)
Table 2. Socioeconomic status class building based on standard deviation
Each PLA also received an assessment regarding EB. Four ecological indicators that are considered a significant EB for EJ by several studies, namely i) air pollution, ii) noise pollution, iii) bioclimate (heat stress) and iv) lack of urban green spaces (UGS) were integrated into one indicator of multiple environmental burden at PLA level. For this purpose, data from the EAB and its online geoportal ‘FIS-Broker’ were used (Senatsverwaltsverwaltung für Stadtentwicklung und Wohnen, editor Citation2017b). The data sources, survey and assessment methods can be traced in . Each individual indicator was evaluated in a four-class system (degree of EB ‘1 – low’ to ‘4 – very high’) and analysed statistically according to PLA and class. Bioclimate (heat stress) and lack of UGS were re-evaluated (). For noise pollution no pollutant levels were recorded for 15 PLAs which remained unaffected and were removed from the examined dataset. Overall, 432 of 447 PLAs are considered in the EJ analysis. Every PLA received a per-indicator evaluation. For the combination of environmental indicators, the four assessments of every PLA were summed, and classified based on a four-step scale (). Totals ranging from 4 to 16 were determined for the overall environmental assessment. Thresholds were based on equal steps of the chosen scale. In case of a balanced distribution of the ecological classes, these PLAs were assigned to the lower class, modifying the threshold for the category of high cumulative burden. The data of the overall ecological assessment were spatially displayed at the PLA level and visualised as environmental impact map of Berlin. PLAs assessed with a high or very high EB (class 3 or 4) were defined as hotpots.
Table 3. Description of data source and methods of used indicator set for multiple environmental burden assessment
Table 4. Final assessment of multiple environmental burden
To evaluate EIJ for the five selected SEGs, the five social maps created were each combined with the cumulative EB map of Berlin and visualised in a map displaying the EJ assessment for every SEG. EIJ was designated where high or very high EBs (environmental classes 3 or 4) coincide with an overrepresentation of the low SES, i.e., PLAs with an above or strongly above presence of the SEGs of interest (socioeconomic classes of 3 or 4). 12 PLAs were not considered, either due to low numbers of inhabitants or due to high outliers. Furthermore, 15 PLAs were omitted due to missing data on noise pollution. As most of these unassessed PLAs overlap, the EJ analysis considers a total of 432 out of 447 PLA (96.6%).
Results
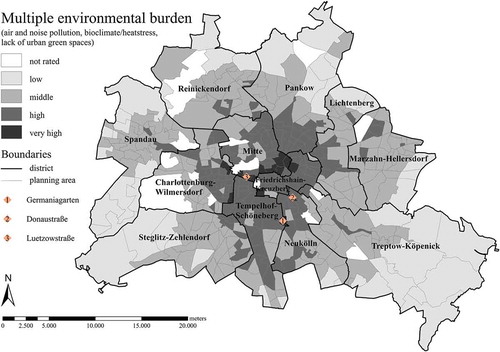
displays the number of PLAs assigned to the four assessment levels. Bioclimate (heat stress) is present with high or very high burden in over 50% of the PLAs and 60.4% of the population, followed by the lack of UGS which was found in 164 of the 432 planning areas, equivalent to 1,575,717 or 44.3% of inhabitants. The burden of air and noise pollution is high or very high in 103 and 85 PLAs, respectively, corresponding to the highest and lowest count of affected population. The spatial distribution of EB shows a clear concentration in the inner city of Berlin (). The multiple EB map () shows that almost all the PLAs with high and very high multiple EB are concentrated in the city centre and PLAs without high burdens are mainly in the outside area near the city boundary. Hotspots are most often found in the districts Friedrichshain-Kreuzberg, Mitte, Pankow-south, Tempelhof-Schöneberg and Neukölln-north. Overall, there are 161 PLAs with high EB. 14 PLAs received a very high rating, affecting 1,586,728 and 91,764 inhabitants, respectively. This corresponds to 47.1% of the population of Berlin in the 175 worst rated PLAs. The PLAs with a very high rating are mostly in Mitte-south (8 PLAs) adjacent to Friedrichshain-Kreuzberg.
Figure 1. Categorised PLAs (432) (left bars) and corresponding number of inhabitants (right bars) according to their environmental burden for the four analysed factors
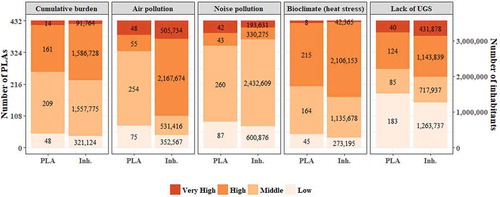
Figure 2. Multiple environmental burden (air and noise pollution, bioclimate/heat stress, lack of UGS) in 432 planning areas of Berlin. data source: EAB
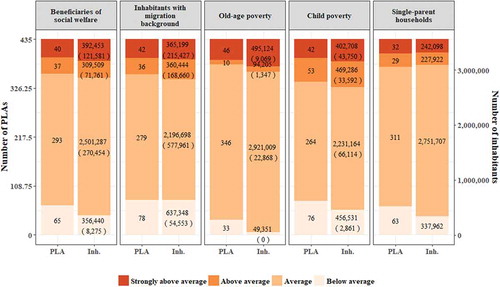
reveals that between 12.8% and 21.8% of the 435 analysed PLAs host above-average or strongly above-average shares of the selected SEGs. The overall population in socioeconomic hotspots ranges between 470,020 and 871,994 inhabitants. For beneficiaries of social welfare, inhabitants with migration background, old-age poverty and child poverty, data allowed the calculation of the absolute numbers of these groups living in the socioeconomic hotspots, amounting to 193,342, 384,087, 10,416, and 77,342 group members.
Figure 3. Categorised PLAs (435) according to socioeconomic group in relation of total population for the selected socioeconomic groups (left bars) and corresponding population (right bars) in the socioeconomic hotspots (population of selected groups in brackets where applicable)
(upper left) shows a heterogenous spatial distribution of PLAs with above-average and strongly above-average percentage of beneficiaries of social welfare in Berlin (weighted average incidence of 27.5% with a maximum of 45.3%). These are found in the districts of Spandau, Reinickendorf and Marzahn-Hellersdorf in the outskirts of the city. In the inner city, the hotspots, especially Neukölln and Mitte, mainly overlap with the concentration of EB. Only one PLA belongs to the worst category in both environmental and socioeconomic terms: Germaniagarten (Tempelhof-Schöneberg, see location in ).
Figure 4. Multiple environment burden with different social groups: i) beneficiaries of social welfare (upper left), ii) inhabitants with migration background (upper right), iii) old-age poverty (middle left), iv) child poverty (bottom left) and v) single-parent households (bottom right)
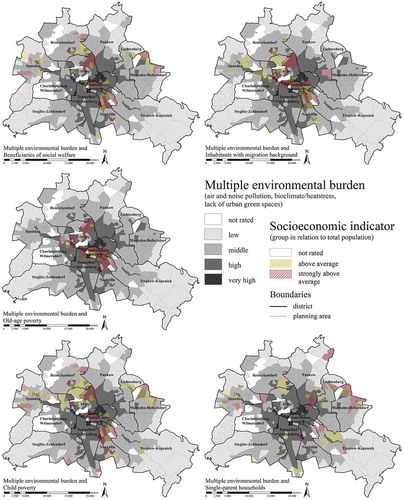
The indicator inhabitants with migration background shows a normal distribution, with group members making up 52.9% (weighted mean). The geographic location of hotspots is displayed in , upper right. Nonetheless, in some PLAs a share of up to 79.7% can be found. There is a clear accumulation in the centre of Berlin, similarly to before in Mitte and Neukölln-north, but also in Kreuzberg. Germaniagarten (as indicated in ) can be considered a hotspot as well, but in contrast to the beneficiaries of social welfare applied above, there are a total of 5 PLAs with the worst environmental assessment score and the highest concentration of inhabitants with migration background. These can be found in Donaustraße (see location in , Neukölln-north), around Lützowstraße (Mitte, indicated) and Charlottenburg-Wilmersdorf.
Old-age poverty (, middle left) also has a clearly centrally located distribution. Its average population share of 16.9% in the hotspots and its maximum value of 30.3% is the lowest for all five selected groups. PLAs with high or very high percentage are mostly in the city centre. Friedrichshain-Kreuzberg (9 PLAs), Mitte (14 PLAs) and Neukölln (12 PLAs) host most PLAs with a very high share, their distribution being rather clustered as they mostly lie adjacent to each other. Of those, the PLAs with most EB and thus with the highest EIJ are again Germaniagarten, Lützowstraße and Donaustraße (as indicated in ).
The distribution of child poverty (, bottom left), exhibiting an average of 59.4% (hotspots) with a maximum of 76.8%, is very similar to the results of beneficiaries of social welfare. The PLAs with a high and very high share tend to be located centrally but many PLAs can also be found in the outskirts of the city, mostly Spandau and Marzahn-Hellersdorf. Again, hotspots are Donaustraße and Germaniagarten.
The maximum percentage of single-parent households reaches 54.7% with a population-weighted mean of around 43.4% in the hotspots. However, the PLAs with a high and very high share in single-parent households are located rather heterogeneously and tend to be towards the outskirts of the city, mostly contiguously (, bottom right). There is no obvious concentration of this SEG in the inner city, but in each district, there is at least one PLA with a high or very high percentage of single parents. Marzahn-Hellersdorf, Lichtenberg, Treptow-Köpenick and Spandau are the districts that host most PLAs with a high share of single parents. It is noticeable that Germaniagarten in Tempelhof-Schöneberg stands out here as well, making it the PLA of a very high EB being a hotspot for all the five SEGs.
We found that vulnerable SEGs are disproportionately more exposed to EB when compared to the overall population of which 47.2% are affected by high or very high EB () In comparison, of all beneficiaries of social welfare, 53.3% live in burdened PLAs. For affected people under old-age poverty, inhabitants with migration background and child poverty the percentages are 56,7%, 59.7% and 51,6%, respectively. In short, the vulnerable socioeconomic population groups usually live where a high environmental impact exists. For the indicators single-parent households, no calculation of percentages was possible as they are based on a different main reference unit (households) than the available PLA inhabitants.
Table 5. Numbers and within-group share of overall population and vulnerable groups living in hotspots (high or very high environmental burdened planning areas)
Discussion
Comparison to other studies
Overall, the results of our analysis provide evidence of EIJ in Berlin. Our analysis of the spatial distribution of the SEGs and the multiple EB found hotspots of environmental injustice, expressed as a cumulative concentration of high EB as well as a high percentage of socioeconomic disadvantage, in the city centre. It can be assumed that the density of the disadvantages results from urban conditions in the city centre, namely, high building density and sealing rate. The result is an urban heat island effect and a lack of UGS as well as a high rate of traffic causing air and noise pollution. Strong similarities in the distribution can be found for the groups of beneficiaries of social welfare, inhabitants with migration background, old-age poverty, and child poverty. Our findings correspond to EJ literature in that we identified higher EB for neighbourhood areas of lower SES. Raddatz and Mennis (Citation2013), who focus on industrial hazards, find EIJ in Hamburg, the second-largest city in Germany. Wüstemann et al. (Citation2017) confirm EIJ for all larger German cities and Depietri et al. (Citation2013) find highest heat exposure among the elderly in Cologne. UGS distribution in neighbourhoods in Munich differed with proportion of elderly and long-term unemployed residents compared to those with a higher share of young residents (Xu et al. Citation2018). In Hannover, mixed patterns, depending on neighbourhood, for UGS access by elderly were found, with no general disadvantage (Wen et al. Citation2020).
The EJ monitoring carried out in 2015 as part of the EAB analyses the socio-spatial distribution of EB in Berlin. EJ was determined by correlating the multiple exposures of environmental factors and a socioeconomic development index (Klimeczek Citation2019). The results showed a spatial concentration of planning areas with high burden in the inner city. Coinciding with our results, several further studies find that hotspots of EB are in the inner city of Berlin. This concerns environmental quality regarding vegetation (noise pollution was distributed along main roads and around the two city-airports throughout the city) (Lakes et al. Citation2014), per capita UGS (Kleinschmit et al. Citation2011; Kabisch and Haase Citation2014) and several air pollutants (Franck et al. Citation2014; Kindler et al. Citation2018). PLAs without multiple EB are predominantly in the outskirts of Berlin. According to the EAB, multiple burden are found in the districts of Friedrichshain-Kreuzberg, Wedding (Mitte) and Neukölln-north.
The concentration of environmental pollution in the city centre correlates with the respective socioeconomic indicators. The findings about the EB were as expected. In contrast, the comparisons of hotspots with socioeconomic data revealed unexpected information through different patterns. Kabisch and Haase (Citation2014) used a similar indicator for inhabitants with migration background and found similar patterns. Although the old-age poverty distribution does not correspond to spatial patterns of over 65s as analysed in the same study, there is a clear overlap with the patterns of social development from Lakes et al. (Citation2014) and Franck et al. (Citation2014). Only the spatial distribution of the high and very high rated levels of single parent-households is not associated with environmental pollution. Thus, the social development index that was elaborated for Berlin can identify environmental injustice for SEGs that were not included in its calculation and only considered as context indicators. This applies to inhabitants with migration background and old-age poverty, as our selected indicators of child poverty and beneficiaries of social welfare are part of it as core indicators. Again, the only exception are single-parent households for which no strong conclusion about environmental injustice could be drawn. These findings imply that the identification of hotspots is to some extent robust to using different socioeconomic data. This paper’s results suggest that groups not yet regarded in EJ studies are exposed in similar ways to the ones analysed, albeit patterns may vary, as is especially the case for single-parent households. Whether this applies for EJ studies in contexts other than Berlin is subject to further research.
Limitations
We used an aggregated indicator to determine the spatial distribution of EB, which can be beneficial in serving as a benchmark for comparison, but does not allow establishing links between certain SEGs and specific environmental impacts or specific local patterns of EIJ (Lakes et al. Citation2014). Giang and Castellani (Citation2020), for example, demonstrate that hotspots identified may vary according to the air pollutant looked at in comparison to a cumulative analysis. Which SEG suffers in what intensity from what kind of EB, and what this means in terms of EJ when related to their specific needs and demands, are matters that still need to be examined. The choice of an additive classification of cumulative burdens while assigning the lower class in case of a balanced distribution (e.g., two burdens assessed as high and very high respectively results in a very high cumulative burden) creates a tendency to overestimate EB.
We assume that the identification of environmentally burdened hotspots is relatively consistent despite the time gap between the environmental data. The main reason is seen in a gradual urban development reinforcing existing patterns rather than changing them. Air and noise pollution probably did increase with growing traffic, yet, with a concentration on worsening conditions along the main roads. Thus, one may expect additional hotspots. Similarly, bioclimate (heat stress) may have worsened with increasing temperatures, but as other factors such as urban structures, these hotspots identified are assumed to prevail. Also, the data used for lack of UGS is based on major revisions made in 2010, while the actualisation 2015 focused mostly on documentation (Senatsverwaltung für Stadtentwicklung und Umwelt Citation2016b). The socioeconomic data (MSUD from 2015) has been chosen to best match the environmental data. The closure of the Tegel airport in November 2020 will probably alter the evaluation of two PLAs in near vicinity (Klixstraße, Scharnweberstraße) in south-central Reinickendorf identified as hotspots for beneficiaries of social welfare, inhabitants with migration background and child poverty due to their very high air pollution. Further changes in PLAs along former flight routes may be revealed when new data are available.
The socioeconomic data used refer to the place of residence, that is the registered address of the analysed groups. We share the view that this is the location where people – especially children and the elderly – spend most of their time in home (Day Citation2010) and can therefore serve as a reference point for our study. In contrast, single-parents tend to display a necessary above-average mobility, manifested as leaving the home often, regardless of their working situation (Chlond and Ottmann Citation2007). Other important locations frequented by residents should also be considered as this can change the loads they are exposed to. However, corresponding data on motion profiles are basically unknown and unavailable at the level of the city’s PLAs. Łaszkiewicz and Sikorska (Citation2020) demonstrate a way of analysing the ‘availability’ of UGS along children’s commute.The spatial data used in our analysis assume an equal geographical distribution of SEGs and EB within a PLA. No information about the distribution of these indicators within residential complexes or buildings is given. For instance, bioclimatic stress may not only depend on the residential area in the city, but on the floor that people live on. Temperatures are higher on top floors than in the basement during the summer and therefore cause higher heat-related stress. The corresponding ‘vertical’ distribution of socioeconomic as well as environmental indicators neither are considered. Similarly, noise and air pollution are highest near to their sources and may be reduced substantially with growing distance from a main street, e.g., flats in the backyard part of the building as is typical for Berlin. These implications call for a detailed analysis of local patterns.
Concerning the lack of UGS, we only considered their distribution per capita. However, we acknowledge the fact that distributional justice does not only depend on the availability of certain areas of green space. Various studies exist that address the differences in use of UGS by different people (La Barrera et al. Citation2016). Therefore, an examination of per capita values needs to be complemented by qualitative considerations when assessing the fairness of the distribution of UGS. Ways to cope with this problem are described as part of the planning recommendations.
Due to the small scale of certain green infrastructure – facade greening, hedges, or solitary trees for instance – it was not possible to include them in our analysis of UGS provision. Yet, urban tree canopy coverage, for example, is affecting air quality and public health and can be disaggregated in analyses up to effects of different tree species (Lai and Kontokosta Citation2019). Apart from the well-known ecological benefits on reduction of heat stress or pollutants in the atmosphere (Kabisch Citation2015), direct benefits such as the satisfaction of recreational needs are complemented indirectly by positive effects on psychological wellbeing like stress reduction or relaxation (Bertram and Rehdanz Citation2015). These may be especially important for people of lower SES, for whom health effects were found to be higher (Mitchell and Popham Citation2008). These benefits already unfold through having green in sight (Bertram and Rehdanz Citation2015). Bearing in mind such green infrastructure in urban planning when dealing with increasingly dense cities may, to a certain extent, compensate for the lack of UGS.
Another question that arises when detecting hotspots of EIJ is how affected SEGs evaluate their living environment. It remains unclear whether inhabitants of the identified hotspots consider themselves to be exposed to the stated EB involuntarily. Inhabitants may be satisfied with the place they live in, even though there may be EB. Rüttenauer and Best (Citation2020) state the importance of considering different dynamics by looking at movement of inhabitants with migration background in relation to perceived air pollution and income changes. Therefore, examining personal impressions of environmental injustice and living conditions in the identified neighbourhood hotspots and whether there is a feeling of need for improvements or not is necessary. This may be part of a follow-up qualitative study, e.g., using an interview research design within the hotspots, to identify the specific local social and environmental situation laid out in the previous section.
Implications of results for planning: multifaced measures and legal aspects
We will use our conclusions to draw recommendations for different levels of planning and point out encountered obstacles of implementing EJ into practice, mainly seen as time and budget constraints (Böhm et al. Citation2016). Successful planning needs multifaceted measures and approaches. Interdisciplinary coordination ensures that the various roots of injustice can be addressed such as a lack of power to determine living place contributing to limited residential choice, possibly linked to discrimination in the housing market and unemployment. Nieuwenhuijsen (Citation2016) exemplifies this complexity of the urban socio-ecological system for transport. The most integrated approach is expanding urban green for its multiple benefits and contribution to ecosystem services: UGS mitigate the analysed EB of air and noise pollution as well as heat risk, and lead to additional health benefits such as reduced stress (Yao et al. Citation2021) and psychological well-being (Wolch et al. Citation2014), an indicator of which has already been applied to EJ (Yee et al. Citation2020). This could be flanked by ensuring a network of UGS of different formats and levels, including informal UGS (Sikorska et al. Citation2020), urban gardening opportunities (Certomà and Martellozzo Citation2019) or residential greenery (Säumel et al. Citation2021). Such a network is foreseen in the Berlin Landscape Programme along 20 green main roads (Senatsverwaltung für Stadtentwicklung und Umwelt Citation2016a) or as a Green Belt Berlin along the former border (Kowarik Citation2019). Such greening along roads may promote bicycle use. Transport concepts can further be enhanced by increasing accessibility to UGS (Chen and Chang Citation2015) as well as promoting emission reductions through emission standards of vehicles and the use of filters in public transport (Senatsverwaltung für Stadtentwicklung und Umwelt Citation2014a). Noise levels can be reduced through similar measures that aim at enhancing technology of vehicles and road infrastructure such as railways, but as well through insulation programmes (Senatsverwaltung für Stadtentwicklung und Umwelt, editor Citation2014b). E-mobility is a promising concept that addresses both noise and air pollution. However, more attention is needed to implement e-mobility in public rather than private transport (Glotz-Richter and Koch Citation2016). Measures well-known to improve the bioclimate are planning buildings with low albedo and streets that offer shadow and favour air circulation (Fernandez Milan and Creutzig Citation2015). At the roof level, heat effects in main road neighbourhood in Berlin have proven to be mitigated through rooftop greenery (Knaus and Haase Citation2020). However, some of the above-mentioned sustainability measures need a justice perspective to avoid burdening on socioeconomically disadvantaged groups.
Justice can also be enhanced by designing appropriate and needs-tailored measures, which will be exemplified for UGS, but also applicable for transport planning, for example. The participation of local people is closely linked to the creation of UGS with possibilities for different uses (Kabisch and Haase Citation2014). This is also argued by Anguelovski (Citation2013) who highlights that EJ needs to go beyond its distributional pillar.
Creating UGS to meet the needs of local inhabitants requires planners to consider who is using the UGS, including who lives in walking distance, and involving them in the planning process. Several studies have already identified requirements for different user groups, including preferences of the analysed SEGs, with a focus on children (Kaymaz et al. Citation2017) or older citizens (Arnberger et al. Citation2017). Palliwoda et al. (Citation2020) do so for different types and characteristics of parks and brownfields in Leipzig.The large open spaces for active sport activities that are mostly offered by the current park design of the UGS Tempelhof (Kabisch and Haase Citation2014) do not address older individuals’ and immigrant families’ needs. Instead, enough space for barbequing or picnicking, which is equipped with shade, tables, seating and nearby playgrounds should be provided (Kabisch and Haase Citation2014). It can be assumed that single parents have similar demands towards UGS. Quality, in other words, attractiveness, and not merely the availability or access to UGS plays an important role for questions on EJ. In the German city of Mannheim, playgrounds had lower quality attributes (attractiveness, cleanliness, safety) in socioeconomically deprived neighbourhoods (Buck et al. Citation2019). These factors can be directly related to different barriers resulting from decisions taken during the planning process and be influenced by the involved actors (Biernacka and Kronenberg Citation2018). Planning for EJ offers prospects to reach distributional and procedural justice when participation is ensured, and participative procedures are designed to include all groups. EJ thus encourages a progress from community-placed to community-based planning (Ziegler et al. Citation2019). Here, the Berlin Neighbourhood Management Programme holds great potential to enhance EJ through horizontal exchange argued for by Verheij and Corrêa Nunes (Citation2020). Local offices that communicate planning proposals to residents at the same time as forwarding citizens’ ideas and wishes to local authorities, serve as a mediator between citizens and local administration. Moreover, the programme comprises a wide range of actors: it cooperates with local associations or day care centres and requires coordination between different departments (Böhme and Bunzel Citation2014).
Participatory GIS can further increase interaction between planners and residents and help to obtain valuable local information (Raymond et al. Citation2016). A less time-intensive approach is the use of smartphone applications with varying degree of interaction as analysed by Ertiö (Citation2015). This method may meet preferences of time-bound single-parents and could be designed in other languages to involve the inhabitants with migration background that may feel uncomfortable with German.
For a recognition of issues involving EJ at higher levels in the planning process, EJ may be integrated into communal landscape planning as own subject of protection in environmental assessments or landscape planning itself, or as a context of justification for goals (Rittel Citation2014). An integration of EJ as an independent protected good of landscape planning would break completely new ground, and therefore might be quite unrealistic (Rittel Citation2014). Moreover, it is not legally binding. Böhme et al. (Citation2019) argue for the legal integration into the Federal Building Code as well as through national programmes that foster recognition. As Strelau and Köckler (Citation2015) show, EJ plays no role in daily planning practice in German environmental agencies, because there is no necessity to consider social aspects unless public demand or legal foundations exist. Moreover, planning documents insufficiently consider factors promoting EJ such as urban tree canopy or EJ implications of other decisions (Kolosna and Spurlock Citation2019; Meenar et al. Citation2019)
Weighing the development of urban wasteland and brownfields with possibilities to their UGS use is demanded. The concept of ‘Urban Green in dual inner development’ addresses this by supporting cities and municipalities meet the challenges of using available space for settlement while developing urban open spaces. In addition to conflicts between the development of residential area and green space, different objectives concerning urban greenery compete such as protecting certain habitats versus spaces for recreation. Recommendations included improved collaboration between the departments responsible for inner city development as well as involving citizens and environmental organisations in planning processes at an early stage. In a newer project for German municipalities, additional recommendations included the identification municipality-specific EJ situation, defining responsibilities for EJ in administration and prioritising needs according to multiple burdens (Böhme et al. Citation2019).
To conclude, the development of UGS as a means of enhancing EJ by mitigating negative environmental impacts faces multiple conflicting goals and burdens in German cities and municipalities. Awareness of double inner development and effective identification of potential areas, in short, the putting into practice of research results, can contribute to reaching EJ aims. Recommending dedicating more public funds towards UGS seems difficult. Arguments from literature that suggest health benefits for the population, such as increased well-being, higher levels of health in general or lower abundance of diseases should be highlighted (Böhme et al. Citation2019). Awareness and willingness to invest among public administrations might increase by linking future benefits and current public expenditures that are currently disentangled by a temporal gap. To achieve this awareness, key factors are interdisciplinary teamwork and interdepartmental cooperation between social and healthcare planning, open space development and environmental management (Böhme et al. Citation2019). Accessible tools to assess EJ as does the EAB for Berlin or a tool at regional scale in Belgium (Habran et al. Citation2020) or to assess EJ outcomes for greening projects (Liotta et al. Citation2020) can support decisions. For Germany, Böhme et al. (Citation2019) developed a platform for municipalities on how to address EJ. Although desirable, increasing the relevance of EJ issues for environmental agencies by law or increased public attention may only be achieved in the long-term. A first step would be to establish clear and transparent guidelines on how to deal with this issue for planners as recommended by Strelau and Köckler (Citation2015).
Conclusion
This study identified hotspots of environmental injustice of five selected SEGs in Berlin. We found that these SEGs are differently and disproportionately more exposed to EB in Berlin. Some of the identified hotspots overlap, except for single-parent households. Different indicators for the social and environmental dimension of the EJ concept may lead to similar conclusions, a result that can contribute to the development of guidelines on incorporating EJ into policy. However, a differentiated look as has been provided is considered necessary to address environmental injustice in urban planning, including regarding the differing needs of the SEGs. Despite the limitations of neglecting specific local conditions of EB and exposure to them, the chosen spatial analysis approach allows for identifying most impacted planning areas. In a second step, these need to be assessed locally and included into PLA-specific planning, involving people’s perceptions of living conditions. Implementation of EJ includes designing multifaceted measures and can be best realised through multi-use UGS addressing the needs of different groups. Green elements distributed throughout the city on the one side and increasing awareness and public participation possibilities through local initiatives such as the Berlin Neighbourhood Management Programme on the other side, are further recommendations. Additionally, a double inner development approach allows for reversing negative densification outcomes. Further measures are needed that can deal with possible conflicts and raise awareness at various levels of planning while considering the constraints: General obstacles encountered in public administration when it comes to the realisation of EJ have been presented.
Acknowledgements
The authors would like to thank Scarlett Aßmann, Camilla Benninghofen, Miriam Bui, Michelle Eckhardt, Rosa Gather, Josephine Goutrié, Franziska Röpke, Susan Shafi, Julian Wendler and Elena Wernitz for their joint efforts and collaboration within the working group on environmental justice in Berlin as well as for preparing essential data used in this study.
Data availability statement:
The environmental data that support the findings of this study are openly available in the Environmental Atlas of Berlin at https://www.stadtentwicklung.berlin.de/umwelt/umweltatlas/eiinhalt.htm, reference numbers 09.01 (Environmental Justice), 06.01/02 (Land Use) and 03.11.3 (Clean Air Plan); the socioeconomic data in the Monitoring Social Urban Development at https://www.stadtentwicklung.berlin.de/planen/basisdaten_stadtentwicklung/monitoring/de/2015/index.shtml#Bericht (German only).
Disclosure statement
No potential conflict of interest was reported by the authors.
Additional information
Notes on contributors
Sonja Edith Hölzl
Sonja Hölzl works at the science-practice interface in human-nature relations and nature conservation. Her study fields were Integrated Natural Resource Management, Environmental Planning and Governance and Public Policy. She was part of the student working group on environmental justice in Berlin under the supervision of Prof. Dr. Kleinschmit.
Mihailo Veskov
Mihailo Veskov is members of the student working group on environmental justice in Berlin under the supervision of Prof. Dr. Kleinschmit. The project was part of the Ecology and Environmental Planning study programme.
Toni Scheibner
Toni Scheibner is members of the student working group on environmental justice in Berlin under the supervision of Prof. Dr. Kleinschmit. The project was part of the Ecology and Environmental Planning study programme.
Ti Thuong Le
Thi Thuong Le is members of the student working group on environmental justice in Berlin under the supervision of Prof. Dr. Kleinschmit. The project was part of the Ecology and Environmental Planning study programme.
Birgit Kleinschmit
Prof. Dr. Birgit Kleinschmit is head of chair of Geoinformation in Environmental Planning at Technische Universität Berlin.
References
- Amt für Statistik Berlin-Brandenburg. 2020 [inhabitants in the state berlin 31.12.2019]. Potsdam: AfS. German. https://www.statistik-berlin-brandenburg.de/publikationen/stat_berichte/2020/SB_A01-16-00_2019h02_BE.pdf.
- Agyeman J, Bullard RD, Evans B. 2010. Exploring the nexus: bringing together sustainability, environmental justice and equity. Space and Polity. 6(1):77–90. doi:https://doi.org/10.1080/13562570220137907.
- Anguelovski I. 2013. New directions in Urban Environmental Justice. J Plan Educ Res. 33(2):160–175. doi:https://doi.org/10.1177/0739456X13478019.
- Annerstedt Van Den Bosch M, Mudu P, Uscila V, Barrdahl M, Kulinkina A, Staatsen B, Swart W, Kruize H, Zurlyte I, Egorov AI. 2016. Development of an urban green space indicator and the public health rationale. Scand J Public Health. 44(2):159–167. doi:https://doi.org/10.1177/1403494815615444.
- Arnberger A, Allex B, Eder R, Ebenberger M, Wanka A, Kolland F, Wallner P, Hutter H-P. 2017. Elderly resident’s uses of and preferences for urban green spaces during heat periods. Urban For Urban Gree. 21:102–115. doi:https://doi.org/10.1016/j.ufug.2016.11.012.
- Bertram C, Rehdanz K. 2015. The role of urban green space for human well-being. Ecol Econ. 120:139–152. doi:https://doi.org/10.1016/j.ecolecon.2015.10.013.
- Biernacka M, Kronenberg J. 2018. Classification of institutional barriers affecting the availability, accessibility and attractiveness of urban green spaces. Urban For Urban Gree. 36:22–33. doi:https://doi.org/10.1016/j.ufug.2018.09.007.
- Böhm J, Böhme C, Bunzel A, Kühnau C, Landua D, Reinke M 2016 [ Urban green in double inner development]. Bonn-Bad Godesberg: Bundesamt für Naturschutz (BfN). 1270 p. (BfN-Skripten; vol. 444). ISBN: 978-3-89624-181-8. German.
- Böhme C, Bunzel A 2014 [urban environmental justice - instruments for securing and establishing justice]. Berlin: Umweltbundesamt. German.
- Böhme C, Franke T, Preuß T 2019. [Implementation of an integrated strategy to Environmental Justice - pilot project in German municipalities]. Dessau-Roßlau: Umweltbundesamt. 133 p. (Umwelt & Gesundheit; no. 2). German.
- Buck C, Bolbos A, Schneider S. 2019. Do poorer children have poorer playgrounds? a geographically weighted analysis of attractiveness, cleanliness, and safety of playgrounds in affluent and deprived urban neighborhoods. J Phys Act Health. 16(6):397–405. Epub 2019 Apr 15. eng. https://doi.org/10.1123/jpah.2018-0177.
- Certomà C, Martellozzo F. 2019. Cultivating urban justice? A spatial exploration of urban gardening crossing spatial and environmental injustice conditions. Appl Geogr. 106:60–70. doi:https://doi.org/10.1016/j.apgeog.2019.03.007.
- Chen J, Chang Z. 2015. Rethinking urban green space accessibility: evaluating and optimizing public transportation system through social network analysis in megacities. Landscape Urban Plan. 143:150–159. doi:https://doi.org/10.1016/j.landurbplan.2015.07.007.
- Chlond B, Ottmann P. 2007. The mobility behaviour of single parents and their activities outside the home. German Journal of Urban Studies. 46:49-61. https://difu.de/5943
- Day R. 2010. Environmental justice and older age: consideration of a qualitative neighbourhood-based study. Environ Plann A. 42(11):2658–2673. doi:https://doi.org/10.1068/a43109.
- Depietri Y, Welle T, Renaud FG. 2013. Social vulnerability assessment of the cologne urban area (germany) to heat waves: links to ecosystem services. Int J Disast Risk Re. 6:98–117.
- Statistisches Bundesamt, editor. 2017. [Data from the communal register. German cities according to area and population based on the census 2011 and population density.]. German: Wiesbaden: Destatis.
- Downey L, Hawkins B. 2008. Single-mother families and air pollution: a national study. Soc Sci Q. 89(2):523–536. doi:https://doi.org/10.1111/j.1540-6237.2008.00545.x.
- Edwards GAS, Reid L, Hunter C. 2016. Environmental justice, capabilities, and the theorization of well-being. Prog Hum Geog. 40(6):754–769. doi:https://doi.org/10.1177/0309132515620850.
- Ertiö T-P. 2015. Participatory apps for urban planning—space for improvement. Plann Pract Res. 30(3):303–321. doi:https://doi.org/10.1080/02697459.2015.1052942.
- Fairburn J, Butler B, Smith G. 2009. Environmental justice in south yorkshire: locating social deprivation and poor environments using multiple indicators. Local Environ. 14(2):139–154. doi:https://doi.org/10.1080/13549830802522038.
- Fairburn J, Sa S, Dreger S, Lk H, Bolte G. 2019. Social inequalities in exposure to ambient air pollution: a systematic review in the WHO European region. Int J Environ Res Public Health. 16. eng. (17): https://doi.org/10.3390/ijerph16173127.
- Fernández IC, Wu J. 2016. Assessing environmental inequalities in the city of santiago (chile) with a hierarchical multiscale approach. Appl Geogr. 74:160–169. doi:https://doi.org/10.1016/j.apgeog.2016.07.012.
- Fernandez Milan B, Creutzig F. 2015. Reducing urban heat wave risk in the 21st century. Curr Opin Environ Sustain. 14:221–231. doi:https://doi.org/10.1016/j.cosust.2015.08.002.
- Franck U, Klimeczek H-J, Kindler A. 2014. Social indicators are predictors of airborne outdoor exposures in berlin. Ecol Indic. 36:582–593. doi:https://doi.org/10.1016/j.ecolind.2013.08.023.
- Giang A, Castellani K. 2020. Cumulative air pollution indicators highlight unique patterns of injustice in urban Canada. Environ Res Lett. 15(12):124063. doi:https://doi.org/10.1088/1748-9326/abcac5.
- Glotz-Richter M, Koch H. 2016. Electrification of public transport in cities (horizon 2020 ELIPTIC project). Transp Res Proc. 14:2614–2619. doi:https://doi.org/10.1016/j.trpro.2016.05.416.
- Habran S, Crespin P, Veschkens M, Remy S. 2020. Development of a spatial web tool to identify hotspots of environmental burdens in Wallonia (Belgium). Environ Sci Pollut Res Int. 27(6):5681–5692. Epub 2019 Feb 6. eng. https://doi.org/10.1007/s11356-019-04418-5.
- Holifield R. 2013. Defining environmental justice and environmental racism. Urban Geogr. 22(1):78–90. doi:https://doi.org/10.2747/0272-3638.22.1.78.
- Hornberg C, Pauli A. 2007. Child poverty and environmental justice. Int J Hyg Environ Health. 210(5):571–580. doi:https://doi.org/10.1016/j.ijheh.2007.07.006.
- Kabisch N. 2015. Ecosystem service implementation and governance challenges in urban green space planning—The case of Berlin, Germany. Land Use Policy. 42:557–567. doi:https://doi.org/10.1016/j.landusepol.2014.09.005.
- Kabisch N. 2019. Urban ecosystem service provision and social-environmental justice in the city of Leipzig, Germany. In: Schröter M, Bonn A, Klotz S, Seppelt R, Baessler C, editors. Atlas of ecosystem services. Cham: Springer International Publishing; p. 347–352.
- Kabisch N, Haase D. 2014. Green justice or just green?: provision of urban green spaces in Berlin, Germany. Landscape Urban Plan. 122:129–139. doi:https://doi.org/10.1016/j.landurbplan.2013.11.016.
- Kaymaz I, Oguz D, Cengiz-Hergul OC. 2017. Factors influencing children’s use of urban green spaces. Indor Built Environ, 5:520–532. doi: https://doi.org/10.1177/1420326X17705943.
- Kindler A, H-j K, Franck U. 2018. Socio-spatial distribution of airborne outdoor exposures – an indicator for environmental quality, quality of life, and environmental justice: the case study of berlin. In: Kabisch S, Koch F, Gawel E, Haase A, Knapp S, Krellenberg K, Nivala J, Zehnsdorf A, editors. Urban transformations, Vol. 10, (Future City). Cham: Springer International Publishing; p. 257–279.
- Kleinschmit B, Geißler G, Leutloff H 2011. Socio-spatial distribution of green spaces in Berlin. In: Bunge C, Gebuhr K, editors: Environmental Justice. Berlin: Federal Office for Radiation Protection, Federal Institute for Risk Assessment, Robert Koch Institute, Federal Environment Agency; p. 35–37 (UMID: Environment and Human Health – Information Service; Special Issue II).
- Klimeczek H-J 2019. [Environmental justice in Berlin - summary]. In: Senatsverwaltung für Umwelt, Verkehr und Klimaschutz, editor. [Basic report environmental justice. Foundation for a socio-spatial environmental policy]. Berlin: Senatsverwaltung für Umwelt, Verkehr und Klimaschutz; p. 18–25.
- Knaus M, Haase D. 2020. Green roof effects on daytime heat in a prefabricated residential neighbourhood in Berlin, Germany. Urban Forestry & Urban Greening. 53:126738. doi:https://doi.org/10.1016/j.ufug.2020.126738.
- Kohlhuber M, Mielck A, Weiland SK, Bolte G. 2006. Social inequality in perceived environmental exposures in relation to housing conditions in Germany. Environ Res. 101(2):246–255. doi:https://doi.org/10.1016/j.envres.2005.09.008.
- Kolosna C, Spurlock D. 2019. Uniting geospatial assessment of neighborhood urban tree canopy with plan and ordinance evaluation for environmental justice. Urban For Urban Gree. 40:215–223. doi:https://doi.org/10.1016/j.ufug.2018.11.010.
- Kowarik I. 2019. The “Green Belt Berlin”: establishing a greenway where the Berlin wall once stood by integrating ecological, social and cultural approaches. Landscape Urban Plan. 184:12–22. doi:https://doi.org/10.1016/j.landurbplan.2018.12.008.
- La Barrera F, De, Reyes-paecke S, Harris J, Bascuñán D, Farías JM. 2016. People’s perception influences on the use of green spaces in socio-economically differentiated neighborhoods. Urban For Urban Gree. 20:254–264. doi:https://doi.org/10.1016/j.ufug.2016.09.007.
- Lai Y, Kontokosta CE. 2019. The impact of urban street tree species on air quality and respiratory illness: a spatial analysis of large-scale, high-resolution urban data. Health Place. 56:80–87. doi:https://doi.org/10.1016/j.healthplace.2019.01.016.
- Lakes T, Brückner M, Krämer A. 2014. Development of an environmental justice index to determine socio-economic disparities of noise pollution and green space in residential areas in Berlin. J Environ Plann Man. 57(4):538–556. doi:https://doi.org/10.1080/09640568.2012.755461.
- Lakes T, Klimeczek H-J 2011. Environmental justice in the Federal State of Berlin: an initial integrated analysis of the socio-spatial distribution of environmental burdens and resources. In: Bunge C, Gebuhr K, editors: Environmental Justice. Berlin: Federal Office for Radiation Protection, Federal Institute for Risk Assessment, Robert Koch Institute, Federal Environment Agency; p. 41–43 (UMID: Environment and Human Health – Information Service; Special Issue II).
- Lanier C, Deram A, Cuny M-A, Cuny D, Occelli F. 2019. Spatial analysis of environmental inequalities caused by multiple air pollutants: a cumulative impact screening method, applied to the north of France. Ecol Indic. 99:91–100. doi:https://doi.org/10.1016/j.ecolind.2018.12.011.
- Łaszkiewicz E, Sikorska D. 2020. Children’s green walk to school: an evaluation of welfare-related disparities in the visibility of greenery among children. Environ Sci Policy. 110:1–13. doi:https://doi.org/10.1016/j.envsci.2020.05.009.
- Laurent É. 2011. Issues in environmental justice within the european union. Ecol Econ. 70(11):1846–1853. doi:https://doi.org/10.1016/j.ecolecon.2011.06.025.
- Liotta C, Kervinio Y, Levrel H, Tardieu L. 2020. Planning for environmental justice - reducing well-being inequalities through urban greening. Environ Sci Policy. 112:47–60. doi:https://doi.org/10.1016/j.envsci.2020.03.017.
- Mason LR, Ellis KN, Hathaway JM. 2017. Experiences of urban environmental conditions in socially and economically diverse neighborhoods. J Community Pract. 25(1):48–67. doi:https://doi.org/10.1080/10705422.2016.1269250.
- Meenar M, Howell JP, Hachadorian J. 2019. Economic, ecological, and equity dimensions of brownfield redevelopment plans for environmental justice communities in the USA. Local Environ. 24(9):901–915. doi:https://doi.org/10.1080/13549839.2019.1652803.
- Mitchell BC, Chakraborty J. 2015. Landscapes of thermal inequity: disproportionate exposure to urban heat in the three largest US cities. Environ Res Lett. 10(11):115005. doi:https://doi.org/10.1088/1748-9326/10/11/115005.
- Mitchell R, Popham F. 2008. Effect of exposure to natural environment on health inequalities: an observational population study. Lancet. 372(9650):1655–1660. doi:https://doi.org/10.1016/S0140-6736(08)61689-X.
- Neimanis A, Castleden H, Rainham D. 2012. Examining the place of ecological integrity in environmental justice: a systematic review. Local Environ. 17(3):349–367. doi:https://doi.org/10.1080/13549839.2012.665863.
- Nieuwenhuijsen MJ. 2016. Urban and transport planning, environmental exposures and health-new concepts, methods and tools to improve health in cities. Environ Health. 15(Suppl S1):38. doi:https://doi.org/10.1186/s12940-016-0108-1.
- Ntiwane B. 2018. Environmental justice in the context of planning. TRP. 72(1):84–98.
- Palliwoda J, Banzhaf E, Priess JA. 2020. How do the green components of urban green infrastructure influence the use of ecosystem services? examples from Leipzig, Germany. Landscape Ecol. 35(5):1127–1142. doi:https://doi.org/10.1007/s10980-020-01004-w.
- Petrić D. 2019. Environmental justice in the european union: a critical reassessment. CYELP. 15:215–267.
- Raddatz L, Mennis J. 2013. Environmental justice in hamburg, germany. Prof Geogr. 65(3):495–511. doi:https://doi.org/10.1080/00330124.2012.700500.
- Raymond CM, Gottwald S, Kuoppa J, Kyttä M. 2016. Integrating multiple elements of environmental justice into urban blue space planning using public participation geographic information systems. Landscape Urban Plan. 153:198–208. doi:https://doi.org/10.1016/j.landurbplan.2016.05.005.
- Riedel N, Köckler H, Bolte G. 2021. Moving noise action planning towards more environmental health equity. Five Propositions Cities & Health. 2021:1–9.
- Rittel K. 2014. [Green, natural, healthy: the potential of multifunctional urban spaces. Research results]. Bonn-Bad godesberg, Bonn: Bundesamt für Naturschutz (BfN). 61 pages. (BfN-Skripten; vol. 371). ISBN:978-3-89624-106-1. German.
- Rüttenauer T. 2019. Bringing urban space back in: a multilevel analysis of environmental inequality in germany. Urban Studies. 56(12):2549–2567. doi:https://doi.org/10.1177/0042098018795786.
- Rüttenauer T, Best H. 2020. Perceived pollution and residential sorting in germany: income may not sort, but it helps to escape. SocArXiv, 9 Nov. 2020. Web.
- Säumel I, Hogrefe J, Battisti L, Wachtel T, Larcher F. 2021. The healthy green living room at one’s doorstep? use and perception of residential greenery in berlin, germany. Urban Forestry & Urban Greening. 58:126949. doi:https://doi.org/10.1016/j.ufug.2020.126949.
- Schüle SA, Gabriel KMA, Bolte G. 2017. Relationship between neighbourhood socioeconomic position and neighbourhood public green space availability: an environmental inequality analysis in a large German city applying generalized linear models. Int J Hyg Environ Health. 220(4):711–718. doi:https://doi.org/10.1016/j.ijheh.2017.02.006.
- Senatsverwaltung für Stadtentwicklung und Umwelt. 2014a [Air quality plan for Berlin 2011-2017]. Berlin: SenStadtUm. 227 p. German.
- [SenStadtUm] Senatsverwaltung für Stadtentwicklung und Umwelt. 2015a [Social urban development monitoring Berlin]. Berlin: SenStadtUm.
- Senatsverwaltung für Stadtentwicklung und Umwelt. 2016a [Landscape programme, species protection programme: commentary 2016]. Berlin: SenStadtUm.
- Senatsverwaltung für Stadtentwicklung und Umwelt. 2016b [Real land use and city structure. documentation of cartographic units and data actualization of data]. berlin: SenStadtUm. German.
- Senatsverwaltung für Stadtentwicklung und Umwelt, editor. 2014b [Noise action plan 2013-2018 for Berlin]. Berlin: SenStadtUm. 101 p. German.
- Senatsverwaltung für Stadtentwicklung und Umwelt, editor. 2017. Environmental atlas - 06.02.1 Actual use and vegetation cover (edition 2015) [dl-de/by-2-0]. Berlin: SenStadtUm.
- Senatsverwaltung für Stadtentwicklung und Umwelt, editor. 2015b [Environmental justice in the state of Berlin - background information and preliminary remarks]. Berlin: SenStadtUm. German.
- Senatsverwaltsverwaltung für Stadtentwicklung und Wohnen, editor. 2017a. [City knowledge and data - living environment areas]. Berlin: SenStadtWo; [accessed 2017 Aug 14]. German. http://www.stadtentwicklung.berlin.de/planen/basisdaten_stadtentwicklung/lor/.
- Senatsverwaltsverwaltung für Stadtentwicklung und Wohnen, editor. 2017b. Environmental atlas. Berlin: SenStadtWo; [updated 2017; accessed 2018 Apr 26]. http://www.stadtentwicklung.berlin.de/umwelt/umweltatlas/edua_index.shtml.
- Senatsverwaltsverwaltung für Stadtentwicklung und Wohnen, editor. 2017c. Environmental atlas [sealing rate (edition 2017)]. Berlin: SenStadtWo. German.
- Senatsverwaltsverwaltung für Stadtentwicklung und Wohnen, editor. 2017d. Environmental atlas - 03.11.3 clean air plan, 2011-2017 (edition 2012): scenario calculations for the assessment of the effectiveness of selected measures for air quality along streets [dl-de/by-2-0]. Berlin: SenStadtWo.
- Senatsverwaltsverwaltung für Stadtentwicklung und Wohnen, editor. 2017e. Environmental atlas - environmental justice (edition 2015): core indicators 1 and 4: noise load and bio-climate/thermal load [dl-de/by-2-0]. Berlin: SenStadtWo.
- Sikorska D, Łaszkiewicz E, Krauze K, Sikorski P. 2020. The role of informal green spaces in reducing inequalities in urban green space availability to children and seniors. Environ Sci Policy. 108:144–154. doi:https://doi.org/10.1016/j.envsci.2020.03.007.
- Strelau L, Köckler H. 2015. “It’s optional, not mandatory”: environmental justice in local environmental agencies in Germany. Local Environ. 21(10):1215–1229. doi:https://doi.org/10.1080/13549839.2015.1084278.
- Thomschke L. 2015. Changes in the distribution of rental prices in Berlin. Reg Sci Urban Econ. 51:88–100. doi:https://doi.org/10.1016/j.regsciurbeco.2015.01.001.
- Verheij J, Corrêa Nunes M. 2020. Justice and power relations in urban greening: can lisbon’s urban greening strategies lead to more environmental justice? Local Environment. 1–18. doi:https://doi.org/10.1080/13549839.2020.1801616.
- Wen C, Albert C, Haaren CV. 2020. Equality in access to urban green spaces: a case study in Hannover, Germany, with a focus on the elderly population. Urban Forestry & Urban Greening. 55:126820. doi:https://doi.org/10.1016/j.ufug.2020.126820.
- Wolch JR, Byrne J, Newell JP. 2014. Urban green space, public health, and environmental justice: the challenge of making cities ‘just green enough’. Landscape Urban Plan. 125:234–244. doi:https://doi.org/10.1016/j.landurbplan.2014.01.017.
- Wüstemann H, Kalisch D, Kolbe J. 2017. Access to urban green space and environmental inequalities in Germany. Landscape Urban Plan. 164:124–131. doi:https://doi.org/10.1016/j.landurbplan.2017.04.002.
- Xu C, Haase D, Pribadi DO, Pauleit S. 2018. Spatial variation of green space equity and its relation with urban dynamics: a case study in the region of Munich. Ecol Indic. 93:512–523. doi:https://doi.org/10.1016/j.ecolind.2018.05.024.
- Yao W, Zhang X, Gong Q. 2021. The effect of exposure to the natural environment on stress reduction: a meta-analysis. Urban Forestry & Urban Greening. 57:126932. doi:https://doi.org/10.1016/j.ufug.2020.126932.
- Yee SH, Paulukonis E, Buck KD. 2020. Downscaling a human well-being index for environmental management and environmental justice applications in Puerto Rico. Appl Geogr. 123:102231. doi:https://doi.org/10.1016/j.apgeog.2020.102231.
- Zhao J, Gladson L, Cromar K. 2018. A Novel Environmental Justice Indicator for Managing Local Air Pollution. Int J Environ Res Public Health. 15: 1260.
- Ziegler TB, Coombe CM, Rowe ZE, Clark SJ, Gronlund CJ, Lee M, Palacios A, Larsen LS, Reames TG, Schott J, et al. 2019. Shifting from “community-placed” to “community-based” research to advance health equity: a case study of the heatwaves, housing, and health: increasing climate resiliency in Detroit (HHH) partnership. Int J Environ Res Public Health. 16. (18): https://doi.org/10.3390/ijerph16183310.