
 ?Mathematical formulae have been encoded as MathML and are displayed in this HTML version using MathJax in order to improve their display. Uncheck the box to turn MathJax off. This feature requires Javascript. Click on a formula to zoom.
ABSTRACT
Quality of life (QoL) in urban areas is increasingly finding prominence in practice. There are numerous studies interlinking residential built environment and QoL at the city level but very few at the suburban level particularly for neighbourhoods. This research aims to prepare an analytical framework and a mathematical model to evaluate neighbourhood QoL as a function of its varying built environment and spatial attributes. In order to demonstrate this, a study is carried out for seven neighbourhood typologies of New Delhi by collecting data for both objective and subjective dimensions. The database is then analysed using statistical techniques of comparative analysis, correlation and regression analysis. The research indicates that (a) Quality of life within a city varies substantially at the neighbourhood level, and (b) current planning standards provide static city-wide benchmarks which are not attainable by most of the Indian neighbourhoods.
1. Introduction
The concept of quality of life (QoL) is a multidimensional, contextual and broad concept, virtually impossible to explain through one universally acceptable definition (Mittal and Sharma Citation2017). Most researchers agree that the concept of QoL is too broad to describe. There is neither an agreed definition nor a standard form of measurement (Cummins Citation1997). The complexity of defining QoL is exacerbated by the interchangeable usage of similar terms and notions. Many scholars described the concept of quality of life interchangeably with other terms, such as subjective well-being, happiness, life satisfaction, and good life (Andrews and Withey Citation1976; Shin and Johnson Citation1978; Veenhoven Citation1996; Diener and Suh Citation1997). More than one hundred definitions (Windsor & Bowling, Citation2001) varying between academic disciplines, schools of thought and social groups of population have been noted in the literature further elaborated in . While QoL has common connotations in these studies, there is little agreement among academics pertaining to its definition (Marans Citation2012). Commonly, in all these definitions, the quality of life is defined as a term to measure citizens satisfaction through understanding their actual needs and implementing most desired development in the future. In other words, quality of life emerged from the assessment of the multiple needs of the individuals, communities, cities, and countries. The degree to which each identified need is fulfilled and contributed to the subjective well-being of people is the necessity of assessing quality of life in various fields (Costanza et al. Citation2007). In all, QoL is a broad term which encompasses notions of a good life, a valued life, a satisfying life, and a happy life (McCrea et al. Citation2005).
Table 1. Different definitions of quality of life
Interestingly, the concept of ‘quality of life’ has recently been reinforced by the idea of ‘liveability or livability’. Liveability, though interpreted differently in different continents, still appears to be same as quality of life, well-being and life satisfaction (Lyndhurst Citation2004). Veenhoven equated “liveability: with “habitability and ‘quality of life’ in his study arguing that liveability is the degree to which its provisions and requirements fit with the needs and capacities of its citizens. Several texts and theories not only use QoL interchangeably with liveability or liveability but also interpret them as identical. A comprehensive review of studies on QoL, liveability and liveability reveals that these concepts essentially stand for the same values of upkeeping socio-economic wellbeing and they cannot be distinguished.
Like QoL, residential built environment is a vast subject with diversified aspects in different contexts, which is also dynamic-changing over time, space and social groups (OECD Citation1978). It’s the physical attributes of residential colonies mainly the structural, environmental, proximity, infrastructure and service dimensions which basically govern the quality of the environment (McClure and Bartuska Citation2007). There are numerous studies interlinking residential built environment and QoL at the city level (Leby and Hashim Citation2010; Ray and Vaidya Citation2011; Rosli and Hamsa Citation2012; Pandey et al. Citation2013; Balestra and Sultan Citation2013; Streimikiene Citation2015; Shekhar et al. Citation2019) but very few at the sub–city level (Erdogan et al. Citation2007; Berkoz Citation2009). Even at the sub-city level, some of the studies are normative while others establish empirical correlations (as outlined in )Factors such as green space, housing and urban form, transport network, socio-economic conditions are likely to have stronger immediate impacts on wellbeing while factors such as street network, land use, public space are likely to have more gradual impacts (Shekhar et al. Citation2019).
Table 2. List of identified parameters and indicators for the sample neighbourhoods
In the Indian context except Bardhan et al. (Citation2011) and Paul and Sen (Citation2017) there are no peer-reviewed research that presents empirical evidence of their complex relationship at the sub-city level. People living in different residential built environment are still assumed to have varying QoL conditions. This is because there is a relationship between people and their daily environment that associates socio-economic status with geographical location causing social-spatial variation in QoL (Pacione Citation2003). These socio-spatial variations can be better understood by looking at some of the studies carried out by the academicians in the available literature. For instance, Berkoz (Citation2009) compared satisfaction between gated communities and non-gated neighbourhoods in Istanbul whereby the findings revealed that, security is more significant in gated communities while housing is significant to the non-gated residential neighbourhoods. A similar kind of study was carried out in Edirine compared housing satisfaction between traditional and modern neighbourhoods (Nevnihalerdogan et al. 2006), showing satisfaction is significantly higher in traditional neighbourhoods. Hence understanding of socio-spatial attributes of a residentially built environment influencing QoL is of utmost importance for any investigation at the sub-city level. However, there is no universal agreement on the association between both of them and results are often contradictory. For instance, walk ability is often argued to improve well-being, but conversely researchers have found the car users to have high well-being too (Shekhar et al. Citation2019). The author also argues that sustainable settlements that foster high well-being of its residents are more likely to be compact, have high population density (actual numbers depending upon the context) and mixed land use with walkable built–up areas at the human scale and have interconnected high-quality green and public spaces that provide equal avenues for interaction and association to everyone. Spatial dimensions impacting well-being negatively tend to be related to pollution, insecurity (financial as well as safety), decay, disorder, poor building quality and lack of access. Proximity to city centre and medium density neighbourhoods can enhance well-being however car-based suburban areas offer some advantages as well. Such sub-urban variations and inequalities in any study of QoL should respond to several elementary questions: (1) Could residents’ response from diverse residential typologies about their QoL conditions be measured? (2) What are the crucial parameters of residential built environment which are responsible for these variations in QoL? (3) what is the optimum range of QoL for the above crucial parameters? (4) Can there be a scientific tool to evaluate QoL in cities of diverse residential neighbourhoods in the Indian context?
In order to address these research questions, the specific research objectives have been framed: (1) To determine built environment parameters/indicators influencing inhabitant’s QoL. (2) To formulate an analytical framework to quantify the objective and subjective dimensions. (3) To determine an optimum range of QoL for the built environment parameters impacting inhabitant’s QoL. (4) To formulate a mathematical equation to accurately measure neighbourhood QoL.
2. Theoretical conceptualisation and formulation of analytical framework
The research undertakes an intensive literature review to conceptualise a theoretical model and an analytical framework that assists in specifically determining and evaluating residential neighbourhood QoL as a function of its varying built environment and spatial attributes. We review key research papers, scientific studies, reports published by international organisation, policy documents of national and state government on QoL in urban areas. Based on snowball method, we augment the purview of literature covering about hundred such documents We specifically focus on identifying those urban parameters, indicators and benchmarks that influence QoL and assist in empirical and quantitative assessment. Beyond the scientific and policy literature, we also explore open access papers and webpages on the internet for the literature available on related keywords- sustainability, liveability, built environment and residential typologies and their relationship to QoL. presents the theoretical framework of this research.
Figure 1. The theoretical framework between quality of life and built environment is premised on the empirical study of parameters, indicators and benchmarks in the residential neighbourhood context
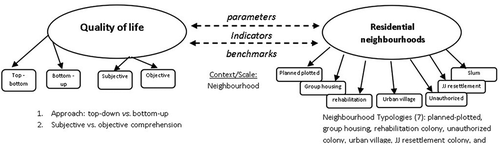
The inter-relationship between QoL and built environment is complex because the available parameters/indicators of measurement of QoL and built environment generally overlap and do not specifically group to any sphere. While none of the literature explicitly suggest this, but a close inspection reveals that QoL indicators and performance-based norms and built environment are spatial planning standards of neighbourhoods like physical distance, area and FSI per-capita supply of amenity, etc., for which benchmark has already been set up by various national and international organisation.
It has been widely acknowledged that the assessment and improvement of people’s QoL are considered one of the main challenges for governments, human development agencies, and researchers (Dodds Citation1997; Rawls Citation1999; Hagerty et al. Citation2001; Alkire Citation2002; Rahman et al. Citation2011). McMhom (Citation2002) describes that the development of QoL indicators for Bristol (United Kingdom) started as a local authority led top-down initiative, but improved by ideas and views of local people based on a bottom-up approach. The useful parameters/indicators to measure QoL require a balance between indicators guided by global concepts and national priorities (top-down approach) and indicators defined by local people (bottom-up approach). (Shin et al. Citation2003) interpret this as objective and subjective dimension of QoL. While objective dimension represents the external condition of life report factual condition, these measures are based on frequency and external to an individual. These are tangible conditions such as physical environment, economic or technical factors. It is argued that objective indicators may not accurately reflect people’s experience of well-being, for which subjective QoL attempts to comprehend and make an account of attitudes and self-perceived well-being of people. The subjective indicators represent the individual’s appraisal of objective life conditions mostly based on psychological responses like personal happiness, job satisfaction, life contentment, etc. (CitationRodriguez et al. t). While objective and subjective indicators do create a complexity in the collection of data and its assessment, these are potential-sum to arrive at more reliable and valid inferences about the level of quality of life in that environment (Milbrath Citation1979).
Various studies explicitly categorise the typology of Indian settlements (Kundu Citation2004; Dutta et al. Citation2005; Ahmad and Choi Citation2011) based on their security of tenure, housing conditions, infrastructure facilities and planning intervention. Policy and planning document define eight types of settlement in Delhi, only one of which is termed ‘planned’. The other seven types of settlement are categorised as ‘unplanned’. The typology under ‘planned’ includes the group housing (flats/apartments), rehabilitation colony and plotted housing built either by private builders or by the government. The typologies under ‘unplanned’ include unauthorised colony, urban village, JJ resettlement colony and slum. The definition and characteristics of all these typologies taken for a case study are given in .
Table 3. Details of sample neighbourhoods taken as a case study
2.1 Defining residential typologies of the built environment
In order to study heterogeneity at the sub-city level, residential typology is an important characteristic of settlements, exhibiting varied types of housing quality, clustering and the availability of basic amenities in them. For instance, Indian cities have high degree of variation across residential neighbourhoods, as captured by various studies which explicitly categorise the typology of built environment based on their security of tenure, housing condition, space availability, infrastructure facilities and planning intervention (Kundu Citation2004; Chander et al. Citation2005; Ahmad and Choi Citation2011).
In a study of urban types, formal and informal, Lupala (Citation2002) classifies formal and informal which refers to parts of settlements having a common set of physical characteristics in terms of house forms, density, space and plot characteristic. The same is applicable to most Indian cities too, for instance formal settlements are those which have been developed by a public or private agency duly following certain planning norms/guidelines. On the other hand, informal settlements are those which have come up illegally either on the government land or private land in a haphazard manner. The informal settlements are prevalent in many cities across the world, though forms and types may vary from country to country. While a slum specifically refers to dwellings which are sub-standard through construction, age, subdivision or neglect, generally having low to negligible level of services. They have been categorised as ‘the most deprived form’ as typically expressed in informal settlements (Drakakis Citation2011). At the national, city and local levels, a multiplicity of terms such as informal, squatter, unplanned settlements and ‘urban villages’ are also used and are nuanced with varying local meaning and interpretation. Their usage and application vary from place to place according to historical, political, economic and social circumstances (Jones Citation2017). Informal settlements have a wider meaning than slums as they refer to “unplanned’ settlements not authorised by the state. Most of the middle class live in such informal/unplanned settlements that may be neither slums nor well-planned colonies, but with limited access to public services and infrastructure (Bhan Citation2013).
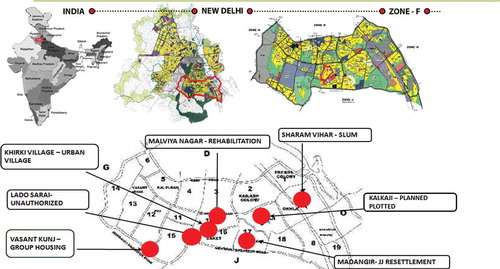
In case of New Delhi, the classification is even more extensive and complex. The Centre for Policy research (Citation2015) defined eight types of settlement in Delhi, only one of which is termed ‘planned’. These consist of planned-plotted and group housing. The other seven types of settlement become, by opposition can be assumed as ‘unplanned’, that include rehabilitation colony, urban village, unauthorised colony, JJ resettlement colony, slum, rural village, unauthorised-regularised colony. In order to omit any bias owing to city location, proximity to the city core and central facilities, for the purpose of this research, it is imperative to select neighbourhoods within the same district/zone of New Delhi. The ‘unplanned’ city houses the vast majority of Delhi’s residents across the economic spectrum: ranging from the affluent farmhouses of South Delhi, to decently built but non-regularised (illegal) colonies populated by upper middle-class society, to dense slum-like areas. Thus, owing to intense variability in built environment, Zone F (South Delhi District) forms a relevant case for further investigating QoL, as detailed in section 3.
2.2 Evaluating QoL in cities- methodological issues
Several methods and approaches have been engaged to evaluate QoL, but perhaps the most important and generalised is the approach based on indicators (Somarriba and Pena Citation2009). The approach bridges the link between the concept and its quantification, thus assisting in both furthering of scientific knowledge in this domain as well its application in development policy to enhance human lives (Hagerty et al. Citation2001; Dluhy and Swatrz Citation2006; Frones Citation2007)
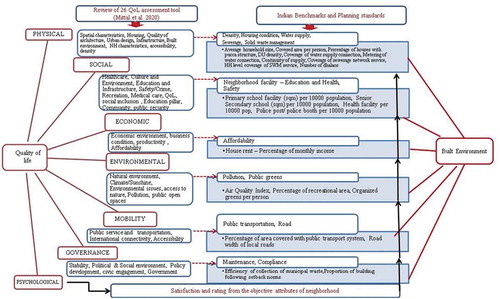
The most frequent indices used to measure QoL based on indicators are OECD Better Life Index (OECD Citation2015), Economist Intelligence Unit’s Global Liveability Index (EIU Citation2016), the Mercer’s Quality of Living Index (Mercer Citation2016and so on. Details of the QoL assessment and tools available at national and sub-national level are given in Annexure 7. An overview of limited but evolving literature (Giap et al. Citation2014; Randhawa and Kumar Citation2017) on QoL assessment models and tools suggests that while there are various assessment methods available at national and sub-national level applicable to provinces, states and even cities, they consider the entire study unit as homogeneous, i.e. assuming QoL to be consistently uniform throughout these units. Hence, there is a paucity of methods to assess varying QoL across different types of residential precincts or neighbourhoods at the sub-city level. Upon analysing 26 tools and indices for QoL assessment used worldwide at city, ward and neighbourhood level Mittal et al. (Citation2020) concluded that there is absence of a reliable scientific method, instrument or index for measuring neighbourhood QoL particularly in the Indian context. Mittal et al.2019 also inferred that the desired features of any urban QoL assessment tool should: (1) consider a balance of both objective and subjective parameters, (2) cover seven key dimensions–physical, social, economic, environment, mobility, compliance and psychological, (3) pro-actively consider bottom–up approach, (4) apply spatial and statistical attributes, (4) have simulation features on a user-friendly portal, and (5) be useful for both governance and general public. The challenge for an effective method to empirically evaluate urban QoL is to achieve a balanced mix between sufficient data on objective and subjective dimensions systematically including relevant parameters, indicators and benchmarks, as discussed in section 2.3
2.3 Identifying parameters, indicators and benchmarks
Fourteen parameters of built environment for quantification of inhabitants QoL were selected based on a comprehensive review 26 QoL tools and indices (Mittal et al. Citation2020) and other relevant studies across six dimensions (physical, social, economic, environmental, mobility, governance). Under the identified parameters, 22 key indicators were derived based on the benchmarks already established by public agencies in the form of norms or standards which become useful in relative analysis of the current QoL levels. However, actual satisfaction and rating of the objective attributes of the neighborhood is considered as psychological domain of QoL (as illustrated in ). Thus, QoL indices can possibly have seven distinct parameters (with the following sub-components): (1) Physical– Density, Housing condition, Water supply, Sewerage system, Solid waste management, (2) Social– Neighborhood facility and Safety, (3) Economic– Affordability, (4) Environment– Pollution, Public greens, (5) Mobility– Public transportation, Roads, (6) Governance– Maintenance, Compliance, and (7) Psychological– satisfaction from all these aspects. Based on normative literature, the QoL related parameters, indicators, benchmark in context of residential neighborhood case studies are listed in (refer Annexure 1 for details of parameters along with details of data sources, benchmarks and our metric/indicators across seven dimensions of QoL).
Figure 2. Conceptual diagram showing association between QoL and built environment
3 Methodology
In order to address the research enquiry, the researchers essentially formulate a framework to evaluate QoL in diverse residential typologies. It devises surveys and test it in sample neighbourhoods within the same city zone, to draw variabilities and peculiarities. The parameters and indicators identified in the preparation of analytic framework encapsulate a comprehensive database of all seven residential typologies in New Delhi, namely planned-plotted, group housing, rehabilitation colony, urban village, unauthorised colony, JJ resettlement colony and slum, using both primary and secondary sources. The data has been collected for a neighbourhood in each of the seven residential typologies in one of the most significant Zone F (for location map see ) in South Delhi Municipal Corporation of the city from 2018 to 2019. Refer for the details of these residential neighbourhoods and Annexure 5 for the comprehensive database of objective and subjective QoL.
Figure 3. Map showing location of sample neighbourhoods in zone F of New Delhi
The secondary information was procured for recent area/ward level population statistics (INDIA, P Citation2011), while primary data was obtained from field inventories for all typologies (land use survey and road inventory) and by conducting household surveys in each of these residential typologies. The head of the household was interviewed to assess objective and subjective dimensions of QoL. The data collection was carried out using trained field surveyors under our close supervision and monitoring. The household questionnaire and field inventory are provided in Annexures 2, 3 and 4. The questionnaire covers questions sequentially on basic household information, six objective QoL dimensions (physical, social, economic, environment, mobility, governance) followed by subjective dimension. The questions in the objective part deal with objective condition obtained from household surveys, field surveys and Google maps whilst the questions in the subjective part evaluate the perceived level of satisfaction from such condition of living environment. On a Likert scale of 1 to 5 where: ‘1ʹ indicates excellent/very satisfied/strongly agree and ‘5ʹ indicates very poor/very dissatisfied/strongly disagree. The percentage distribution (rounded off to the nearest integer) of respondent on the rating scale of 1 to 5 is then computed. Each percentage thus computed was then multiplied with a corresponding value assigned to the scale: 1.0 (Excellent), 0.75 (Good), 0.5 (Average), 0.25 (Poor) and 0.0 (Very poor). The overall perception (perceived performance) rating or score in respect of each parameter is arrived by adding five sets of values to get an overall aggregated score for different variables.
Sample size and Sampling technique: In order to ensure accuracy and consistency during the sampling process, the standard planning and legally binding definition of neighbourhood (DDA (Citation2008)) i.e. a contiguous area having a population of 10,000 residents has been identified for sampling in each typology. In order to arrive at a representative sample, the research uses the following sample size determination formula (National Education Association Citation1960).
Where, S = required sample size, X2 = table value of Chi square at degree of freedom = 1 (for desired confidence level 0.1 = 2.71); N = population size (10,000); P = population proportion (assumed to be 0.50); d = degree of accuracy (expressed as a proportion) (0.05). By using neighbourhood population of 10,000 (as per DDA (Citation2008)), the total number of surveys conducted in each neighbourhood was computed to be 200 accounting to total 1400 household survey. A stratified sampling technique was used in selecting households on the basis of spatially equal distribution across the neighbourhood, gender and age of respondent, so as to attain most representative responses. In unplanned settlement, major streets were identified to carry-out household survey while in the case of planned settlements housing blocks (clusters) were identified.
Data and information are analysed to draw results and synthesise key findings. The analysis of results would hinge on assessment of quantitative information using comparative, correlation and regression analysis in order to demonstrate QoL peculiarities and variability across different neighbourhood types. The comparative analysis covers assessment of 14 parameters and 22 indicators (density, housing condition, water supply, sewerage system, solid waste management, neighbourhood facility, safety, affordability, pollution, public greens, public transportation, roads, maintenance and compliance) to demonstrate variability across different neighbourhood types (refer section 4.1 for details) while correlation analysis examines the strength of correlation (Karl Pearson’s Coefficient) of these parameters & indicators with their level of satisfaction/rating to deduce optimum level of moderate and strong QoL variables with minimum and maximum threshold (refer section 4.2 for details). Finally, regression analysis is performed to yield an equation for estimating inhabitants of QoL as a function of varying built environment (refer section 4.3 for details).
4. Discussion of results
4.1 QoL variabilities across neighbourhood
The data of neighbourhoods for each parameter/indicator is reported (refer Annexure 5 for details). It is compared against the benchmark adopted in relevant norms and standards like the Master Plan of Delhi 2021 (DDA Citation2008), URDPFI Guidelines (MoHUA- Ministry of Housing and Urban Affairs Citation2018), and so on. The deviation of each indicator from the benchmark/standard is computed in percentage points (refer ). This finds concurrence with method used in developing the Ease of Living Index (MoHUA Citation2018) to compare liveability of Indian cities. The research findings clearly demonstrate that in spite of being located within the same city-zone) there are significantly measurable variations in QoL for most of the indicators (12 out of 22 across different residential typologies (for details see Annexure 5). For instance, covered area per person ranges from 2.2 to 40 sqm/person, public transport access from 20% to 95%, continuity of water supply from 0 to 5 hours/day and availability of primary education facilities from 0 to 10,588 sqm per 100,000 population (). Irrespective of the neighbourhood typology, certain indicators bear satisfactory values close or equal to the benchmark (highlighted in dark grey colour), while others show values above (highlighted in moderate grey colour) or below than the benchmark (highlighted in light grey colour).
Table 4. The variables showing variation among different neighbourhood typologies are colour coded below
When indicators of objective QoL are compared with the absolute benchmark, the following key observations emerge:
Average household size: the average household size (4–5) is close to the benchmark in all of the residential typologies except urban villages - Khirki (5.9) and slum- Shram Vihar (10.3).
Covered area per person (sqm): The covered area per person in planned residential localities like rehabilitation colony- Malviya Nagar (40), planned plotted- Kalkaji (36), group housing- Vasant Kunj (28) is much more than the absolute benchmark (12.5) as against unplanned settlements like urban village- Khirki (7.6), JJ resettlement colony- Madangir (7.0) and slum- Shram Vihar (2.2) which is considerably less, except in unauthorised colony- Lado Sarai (14) which is relatively close to the benchmark
DU density/hectare: All neighbourhoods (except JJ resettlement colony- Madangir) are under-utilised in terms of DU density when compared with Master Plan guidelines.
Extent of metering of water connection (%): There is a marked variation observed in metering of water supply connection across all types of settlements. There is a gap of 10–30% in planned settlements and 50–100% gap in unplanned settlements.
Continuity of water supply (nos): Hours of water supply in planned settlements (1.5–3 hour) is inadequate whereas 4–5 hour in unplanned settlements is found to be adequate. However, slum- Shram Vihar residents depend on water tank and hand pumps for their daily water requirements.
Primary school per 10,000 population (sqm): It shows that area facility for primary school is sufficient in case of most of the planned typologies, in fact quite high in rehabilitation colony – Malviya Nagar, but quite deficient for all the unplanned neighbourhoods.
Senior secondary school per 10,000 population (sqm): It shows that area facility for secondary school is sufficient in case of most of the typologies, except urban village- Khirki and slum- Shram Vihar.
Monthly rent (Percentage of income): Monthly rent as % of income of most residential localities don’t fall within the range of 30–35% of household income, except JJ resettlement colony – Madangir and urban village – Khirki.
Recreational area (proportion of developed area): All residential typologies exhibit an average or above average value for open/green land use, for e.g. JJ resettlement colony- Madangir (6%) and rehabilitation colony- Malviya Nagar (12.9%). The highest observed value 30.4% in slum- Shram Vihar is owing to the development being an unplanned slum over vacant land available.
Organised green area per person (sqm): Except group housing- Vasant Kunj (4.3 sqm/person), all residential localities have deficient organised green per person than required.
Area covered with public transport system (%): Only 30–50% of the area is covered by public transport system except planned plotted- Kalkaji where because of availability of two metro station, accessibility is 95%. The road width for local (m): The width of roads in all residential localities is below 10 m except group housing- Vasant Kunj and rehabilitation colony- Malviya Nagar whose roads are wide enough to cater parking and traffic.
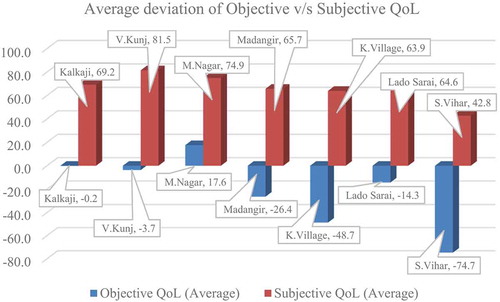
presents the average deviation of objective QoL which varies from +17.6% (rehabilitation colony- Malviya Nagar) to −74.7% (slum – Shram Vihar) and average subjective QoL which varies from +81.5% (group housing – Vasant Kunj) to +42.8% (slum–Shram Vihar). Significant variation between objective and subjective QoL demonstrates that prevailing planning standards are not performance based and do not consider subjective wellbeing of urban citizens. Hence, there is a need to revise and upgrade these planning standards, incorporating optimum levels of subjective wellbeing (QoL responses) of the inhabitants, as elaborated further.
Figure 4. Bar chart showing average deviation objective QoL and average subjective QoLof sample neighbourhoods
4.2 Optimum level of QoL
Correlation analysis (Karl Pearson’s Coefficient) is conducted between objective and subjective indicators to eliminate weak variables and selecting those variables that have shown moderate to strong correlation formulating a precise equation later. The method is adopted based on the study carried out by New York City while developing Wellbeing Index School of International and CIDI Citation2015. Based on mutual correlation strength (R2) of all indicators, i.e., physical, environmental, economic, social, mobility and governance, a correlation matrix is prepared (refer ). The horizontal axis reports the objective QoL indicators and the vertical axis shows respective subjective QoL results. The strongest correlations (R2 ≥ 0.75) as highlighted in dark grey colour are observed for covered area per person (0.83), proportion of pucca house (0.93), availability of primary school (0.79) & secondary school (0.94), proportion of recreational area (0.76), and access to public transport system (0.76). This is followed by moderately stronger correlation (0.6≤ R2 < 0.75) as highlighted in moderate grey colour observed for proportion of household having metered water (0.65) and sewerage connection (0.63), the availability of health facility (0.66) and proportion of houses following local building norms (0.74). A weak correlation (R2 < 0.60) as highlighted in light grey colour is observed for DU density (0.336), coverage water supply (0.556), continuity of water supply (0.58), number of dhalaos (0.273), household level coverage of solid waste management service (0.512), police booth (0.488), monthly rent (0.559), Air Quality Index (0.342), organised greens (0.587) road width for local loads (0.56), efficiency of collection of municipal solid waste (0.571).
Table 5. Correlation matrix showing correlation coefficients between objective and subjective dimension of QoL
Strong and moderate variables are analysed further for scattered path analysis to derive optimum level of QoL with minimum and maximum threshold. When objective value of each indicator is plotted against its satisfaction or rating value, the values at which 75–90% people are satisfied with its objective dimension is considered as optimum level of QoL with minimum and maximum threshold (see ). All diagrams are provided in Annexure 6, and a representative diagram for scattered path analysis for average household size and satisfaction with the habitat is presented in .
Figure 5. Scattered path analysis for average household size and satisfaction with the habitat
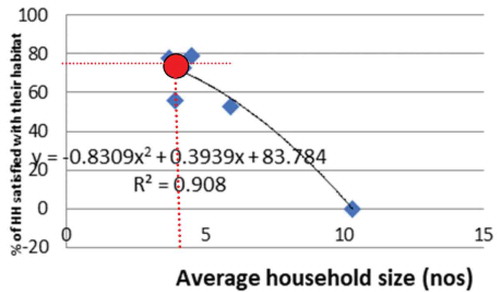
Table 6. Optimal range with certain maximum and minimum thresholds, to maintain different QoL indices
4.3 Modelling neighbourhood QoL
Binary logistic regression is used to find an equation that best predicts the probability value of the Y = subjective QoL as a function of objective dimensions and multiple variables (X1, X2 … .Xn). Regression modelling has been used by several investigations in developing the QoL model (Mamuye and Gotu Citation2015; Paul and Sen Citation2017). Based on a comprehensive study of QoL influencing dimensions and testing these in different circumstances, this research concludes with irrefutable evidence that the net resultant QoL of a neighbourhood i.e. its subjective QoL (Y) can reasonably be assessed through regression modelling of its objective dimensions (X1 – X10). The analysis would yield an equation that models the estimated score of quality of life (subjective wellbeing) or essentially Y = Psychological QoL, against the given different value of 10 independent variables (X1, X2 … .X10).
In the binary logistic regression analysis, two models emerge that tend to most appropriately establish a regression between dependent and independent variables. presents the estimated results of these two models. The evidence of over 1400 HH questionnaire surveys collected from seven diverse residential typologies in Delhi are analysed to deduce the following regression equation:Y =-1.098 - 0.116X1+ 0.0136 X2+ 0.0928 X3+ 0.893 X4 + 0.269 X5+ 0.0279 X6 + 0.234 X7 +0.619 X8- 1.053 X9
Table 7. Regression results estimated in model 1 and model 2
where XI is Average household size, X2 is Covered area per person, X3 is Proportion of pucca house, X4 is Extent of metering of water connection, X5 is Coverage of sewerage network services, X6 is Education facility per 10000 population, X7 is Health facility per 10000 population, X8 is Proportion of recreational area, X9 is Area covered with public transport facility, X10 is Proportion of buildings follows building setback norms.
All results are presented by the estimated intercept, slope coefficients and their standard errors. The regression model demonstrates that among all the independent variables, covered area/person, type of house, water metre connection, type of sewerage system, greens, school and health facility, access to the public transport system and adherence to building bye laws are positively associated with psychological QoL whereas average HH size is negatively associated to the psychological quality of life.
5. Conclusions
The research started as an exploration of links between QoL and residential built environment, the key objectives being (1) To determine built environment parameters/indicators influencing inhabitant’s QoL. (2) To formulate an analytical framework to quantify the objective and subjective dimensions. (3) To determine an optimum range of QoL for the built environment parameters impacting inhabitant’s QoL (4) To formulate a mathematical equation to accurately measure neighbourhood QoL. Based on the context, seven diverse residential neighbourhoods were identified, as planned-plotted, planned-group housing, rehabilitation colony, urban village, unauthorised colony, JJ resettlement colony and slum for a contiguous city zone in Delhi.
The above objectives have been addressed by performing various tasks explained in different sections of the paper. Objective 1 is addressed through comprehensive literature review and the results are presented in Section 2.3. The results reveal that 22 key indicators under 14 parameters are crucial to determine an inhabitant’s QoL. In pursuit of Objective 2, the research conducts primary surveys in the field for both the objective and subjective dimensions (the Questionnaire and Inventory format are provided in Annexure 2–4). The framework essentially consists of parameters and analysis technique identified based on exhaustive review of tool/indices and other relevant studies across seven dimensions, namely physical, social, economic, environmental, mobility, psychological, governance. Objective 3 is addressed by performing correlation analysis and the results are presented in Section 4.2. Most importantly, the analysis reveals that (a) There is a strong positive correlation between satisfaction and housing (covered area per person, pucca house) and education infrastructure (primary and senior secondary school) demonstrating coefficients ranging between +0.8 and 0.95. (b) There is a strong negative correlation between average household size/occupancy and satisfaction having high correlation coefficient (- 0.925) indicating too many people in a dwelling disturbs the privacy and makes the home environment unpleasant. The study suggests that factors determining crowding in housing and physical and social infrastructure should be taken into account to improve user satisfaction among diverse kinds of residential neighbourhoods. People who are satisfied with housing and education infrastructure also perceive their neighbourhood to be friendly, have sense of pride and belongingness. Having considered these factors, it will be possible to plan more livable and more sustainable neighbourhoods, which will thus provide higher level of residents’ satisfaction. Objective 4 is dealt with by performing regression analysis and the results are generated by a mathematical equation (Section 4.3). The regression model demonstrates that among all the independent variables, covered area/person, type of house, water metre connection, type of sewerage system, greens, school and health facility, access to the public transport system and adherence to building bye laws are positively associated with psychological QoL whereas average HH size is negatively associated to the psychological quality of life.
Some expected findings include that various forms of typologies showed different characteristics in terms of settlement type- planned/unplanned, available services and socio-economic characteristics of the residents. Residents of planned neighbourhood (planned plotted, group housing, rehabilitation colony) enjoy well-planned and designed neighbourhoods, conformity to building regulations, and ample social and infrastructure services. On the other hand, unplanned neighbourhoods (JJ resettlement colony, unauthorised colony) enjoy basic minimum standard of living while the slum and urban village residents live in extremely deplorable conditions especially for inadequate level of services. There are several interesting findings. With the exception of resettlement colony, the unplanned neighbourhoods occupy the highest percentage of recreational area (ranging from 22.9% to 30.4%) as compared to planned settlements (ranging from 12.9% to 18.3%). For satisfaction with green area, only 40–50% of people are satisfied in unplanned neighbourhoods as against 70–80% in planned ones. This can be attributed to the quality of greens which are available in the form of underutilised green, barren lands, reserved land, etc., and not as organised greens, parks, gardens, etc. It can therefore be said that accessible, well-maintained greens are crucial in enhancing inhabitant’s QoL. Secondly, as counterfactual claims suggest, group housing typology outscores plotted development for satisfaction essentially due to better parking and green areas on the ground. Thirdly, the study suggests that with an irrefutable evidence that all other things being constant, the optimum levels of household size, habitable space, durability of structures, reliable water & sewerage system, education facility, green areas, public transport system and compliance to building bye laws significantly influence (0.6 ≤ R2 ≤ 1.0) the QoL in diverse residential neighbourhoods.
What is the relevance of the findings for developed and other developing countries and the international agendas like the Sustainable Development goals (SDG) Goal 11 and the New Urban Agenda (NUA)? The research findings show that ‘one size fits all’ approach pursued by most national and municipal governments is not amenable for sub-urban planning and governance. Certain cities have reasonably decent location, mobility and physical environment (like Newham and Mitcham in London, Brownsville, East New York, Windsor Terrace, Sunset Park in New York), yet exhibit derelict clusters/NHs, that demand revitalisation and improvement of environment infrastructure and social well-being. In addition, city precincts demonstrating higher social interactions and cohesion especially evident in developing countries like Dharavi slum in Mumbai, Khayelitsha in Cape Town, Neza in Mexico, Orangi Town in Karachi can work towards enhancing their physical environment, mobility and green spaces. The evaluation and managing of QoL at the sub-city level thus become crucial in mainstreaming NUA and locally implementing sub-goals of SDGs, most notably that ensure access for all to adequate, safe and affordable housing and basic services (Target 11.1), provision of safe and accessible open/green spaces (Target 11.7), sustainable public transport system (Target 11.2) and to reduce the adverse per capita environmental impact of cities (Target 11.6), that includes paying special attention to air quality and municipal and other waste management.
Based on the research findings, the study proposed multi-pronged strategies to make QoL as an integral part of the society and community which can be adopted at multiple levels. A web-based tool needs to be initiated by GoI for monitoring and dissemination wherein a user can have an access to information about the neighbourhood feature and its respective objective and subjective QoL. This would serve to the real estate industry for investors, buyers, tenants to choose an appropriate place for conducting business activity and to choose a suitable neighbourhood to live. The research has further potential to develop architectonic and spatial planning guidelines/benchmarks for enhancing QoL in diverse type of neighbourhoods. These eventually require to be included in the National Building Code Guidelines and URDPFI Guidelines for nationwide adoption.
From policy perspective, the study demonstrated that different neighbourhoods require varying degrees of required QoL improvements as against prevailing benchmarks or planning standards, and thus enable local agencies towards an informed decision-making exercise. As this research shows, in reality there is no ‘good or bad’ or ‘rich or poor’ QoL, but there are certain maximum and minimum thresholds, that helps sustain different QoL indices. This research concludes with such an optimum range of QoL to enable towns, cities and their neighbourhoods to scientifically and accurately measure and analyse their status. This will help them to undertake specific progressive steps in improving QoL levels. Most importantly, this study proposed a QoL index that would be useful for area-based development (ABD) schemes which are currently focused on superficial feedback from citizens and experts which is unscientific and unreliable. In conclusion, the study of QoL in diverse residential precincts and their mutual association has been useful to understand sub-urban issues in a multi-dimensional manner as well as help planning agencies and decision makers in formulating policies that are focused towards crucial QoL parameters to promote better environment, infrastructure, social equity across the wide residential typologies that exist in large cities.
Disclaimer
On behalf of all authors, I state that there is no conflict of interest.
Disclosure statement
No potential conflict of interest was reported by the author(s).
Additional information
Notes on contributors
Shilpi Mittal
Ms. Shilpi Mittal is a Research Associate, Indian Society for Applied Research & DevelopmentPhD Scholar, GD Goenka University – IndiaShilpi Mittal is an Architect-Planner whose continuous efforts to address sustainable urban issues arises out from the common phenomenon of sporadic urbanization, especially in the developing context. She is currently a Research Associate at the Indian Society for Applied Research and Development (ISARD), and pursuing doctoral studies on “Evaluating Quality of Life in Diverse Residential Neighborhoods.” from GD Goenka University in India. In the past, she has served renowned research advisory & project management firms like Infrastructure like IL&FS and Ansal API. She possesses practical experience of 4 years on consultancy and redevelopment projects in the private sector and teaching/research experience of more than 9 years. Over these years, she has participated and presented papers in national and international conferences, focusing on issues of sustainable habitat, quality of life in an increasingly transforming world. She has extensively contributed in publishing peer-reviewed scientific papers, book chapters, etc. in prominent journals
Jayprakash Chadchan
Dr. Jayprakash Chadchan is a Associate Professor, School of ArchitectureVellore Institute of Technology, Vellore – IndiaHe is an Architect-Urban Planner by professional background having more than 18 years of professional experience including teaching, research and industry. Currently working as Associate Professor at School of Architecture, Vellore Institute of Technology, Vellore. Earned his doctorate degree in the field of Urban and Regional Planning from Indian Institute of Technology (IIT) Roorkee. His specialized area of interest is “Sustainable Urban Development” with special focus on application of contemporary urban growth theories (Smart Growth, Compact City, New Urbanism, Smart City etc). He has taught various inter-disciplinary courses in the field of Architecture and Planning both at Undergraduate and Graduate level. Published more than 30 research papers in referred national and international journals and conferences. He has supervised two Ph.D. candidates and worked on various prestigious funded research projects. He has participated and presented papers as invited key note speaker in some of the prestigious international conferences. Actively served on the editorial board of few selected international journals such as “Journal of Sustainable Development”, International Journal of Sustainable Society” and International Journal of Sustainable Built Environment”. In addition to this, out of passion he is associated with private and not for profit organizations as advisor and consultant in rendering educational services. He holds professional membership with Indian Institute of Architects (IIA), Mumbai, Council of Architecture (COA), New Delhi and Indian Institute of Town Planners (ITPI), New Delhi.
Sudipta K Mishra
Dr. Sudipta K Mishra is a Associate Professor Faculty In-charge, Department of Civil EngineeringSchool of Engineering and SciencesGD Goenka UniversityDr Sudipta K. Mishra is currently working as an Associate Professor in the Department of Civil Engineering at GD Goenka University in India. He did his PhD at the University of Iowa in the United States. His PhD work involved exploring the connection lies between US bio-energy goal and their implications on the environment through modelling flow and transport of water, nutrient from agricultural land in the US Midwest. His past work also involved developing a distributed hydrological model suitable for a semi-tropical region like India. Dr Mishra did his Masters from the Indian Institute of Technology and B.E. from Jadavpur University in India. He is currently working on WEF nexus issues in India and actively guiding multiple research scholar.
References
- Ahmad S, Choi MJ. 2011. The context of uncontrolled urban settlements in Delhi. Asien. 118(January):75–90.
- Alkire S. 2002. Dimensions of human development. World Development. 30(2):181–205. doi:https://doi.org/10.1016/S0305-750X(01)00109-7.
- Andrews FM, Withey SB. 1976. Social indicators of well-being Americans perceptions of life quality. New York: Plenum Press.
- Austin DM, Furr LA, Spine M. 2002. The effects of neighborhood conditions on perceptions of safety. J Crim Justice. 30(5):417–427. doi:https://doi.org/10.1016/S0047-2352(02)00148-4.
- Balestra C, Sultan J. 2013. Home sweet home: the determinants of residential satisfaction and its relation with well-being. OECD Statistics Working Papers, 2013/05. Paris: OECD Publishing. doi: https://doi.org/10.1787/5jzbcx0czc0x-en
- Bardhan R,H, Kurisu K, Hanaki K (2011). Linking urban form quality of life in Kolkata, India. The 47th ISOCARP Congress, Wuhan, China. http://www.isocarp.net/data/case_studies/1923.pdf
- Berkoz L, Turk SS, Kellekci ÖL. 2009. Environmental quality and user satisfaction in mass housing areas: the case of Istanbul. Eur Plann Stud. 17(1):161–174. doi:https://doi.org/10.1080/09654310802514086.
- Bhan G. 2013. Planned illegalities: housing and the’failure’of planning in Delhi: 1947-2010. Econ Polit Wkly. 48((24).58–70.
- BIS. (2016). National building code of India. Bure Ind stand.
- BWSSB/AusAID. 2002. Baseline socio-economic survey report. Bangalore: Bangalore Water Supply and Environmental Sanitation Master Plan Project.
- Calilung RBF (n.d.). Exploring local governance initiatives in the promotion of sustainable and livable cities: the case of Marikina City, Philippines. Unpublished report.
- Central pollution control board (CPCB), 2014. National Air Quality Index, Series CUPS/82/ 2014–15.
- Costanza R, Fisher B, Ali S, Beer C, Bond L, Boumans R, Danigelis NL, Dickinson J, Elliott C, Farley J, et al. 2007. Quality of life: an approach integrating opportunities, human needs, and subjective well-being. Ecol Econ. 61(2–3):267–276. doi:https://doi.org/10.1016/j.ecolecon.2006.02.023
- Cummins RA. 1997. Self‐rated quality of life scales for people with an intellectual disability: a review. J Appl Res Intellectual Disabilities. 10(3):199–216. doi:https://doi.org/10.1111/j.1468-3148.1997.tb00017.x.
- DDA. 2008. Master plan for Delhi 2021. New Delhi: Delhi Development Authority.
- Diener ED, Suh ME. 1997. Subjective well-being and age: an international analysis. Annu Rev Gerontol Geriatr. 17(1):304–324.
- Dluhy M, Swartz N. 2006. Connecting knowledge and policy: the promise of community indicators in the United States. Soc Indic Res. 79(1):1–23. doi:https://doi.org/10.1007/s11205-005-3486-2.
- Dodds S. 1997. Towards a ‘science of sustainability’: improving the way ecological economics understands human well-being. Ecol Econ. 23(2):95–111. doi:https://doi.org/10.1016/S0921-8009(97)00047-5.
- Drakakis-Smith D. 2011. Urbanisation, housing and the development process. Vol. 67.: 83–99. London: Routledge.
- Dutta V, Chander S, Srivastava L. 2005. Public support for water supply improvements: empirical evidence from unplanned settlements of Delhi, India. J Environ Develop. 14(4):439. doi:https://doi.org/10.1177/1070496505281841.
- Erdogan, N., Akyol, A., Ataman, B., & Dokmeci, V. (2007). Comparison of urban housing satisfaction in modern and traditional neighborhoods in Edirne, Turkey. Social Indicators Research, 81(1):127–148.
- Frønes I. 2007. Theorizing indicators: on indicators, signs and trends. Soc Indic Res. 83(1):5–23. doi:https://doi.org/10.1007/s11205-006-9061-7.
- Giap, T. K., Thye, W. W., & Aw, G. (2014). A new approach to measuring the liveability of cities: The Global Liveable Cities Index. World Review of Science, Technology and Sustainable Development, 11(2), 176–196.
- Housing T.A. 2016. Shelter.
- Hagerty MR, Cummins R, Ferriss AL, Land K, Michalos AC, Peterson M, Vogel J, Sirgy J, Vogel J. 2001. Quality of life indexes for national policy: review and agenda for research. Bullet Sociol Methodol/Bulletin De Méthodologie Sociologique. 71(1):58–78. doi:https://doi.org/10.1177/075910630107100104.
- Hassine, K., Marcouyeux, A., Annabi-Attia, T., & Fleury-Bahi, G. (2014). Measuring quality of life in the neighborhood: The cases of air-polluted cities in Tunisia. Social indicators research, 119(3):1603–1612.
- Heller, P., & Mukhopadhyay, P. (2015). Categorisation of settlement in Delhi. Centre for Policy Research. Available at: https://www.cprindia.org/sites/default/files/policy-briefs/Categorisation-of-Settlement-in-Delhi.pdf.
- Hur M, Nasar JL, Chun B. 2010. Neighborhood satisfaction, physical and perceived naturalness and openness. J Environ Psychol. 30(1):52–59. doi:https://doi.org/10.1016/j.jenvp.2009.05.005.
- IIHS. 2014. Future proofing Indian cities: Bangalore action plan for green-blue infrastructure. Bangalore: Indian Institute for Human Settlements.
- Initiative, O. B. L. (2011). Compendium of OECD well-being indicators. Paris: Organisation for Economic Cooperation and Development.
- INDIA, P. 2011. Census of India 2011 provisional population totals. New Delhi: Office of the Registrar General and Census Commissioner.
- Indian Roads Congress. 1996. IRC 69-1977.Space standards for roads in urban areas. Indian Road Congress, New Delhi.
- Jones P. 2017. Formalizing the informal: understanding the position of informal settlements and slums in sustainable urbanization policies and strategies in Bandung, Indonesia. Sustainability. 9(8):1436. doi:https://doi.org/10.3390/su9081436.
- Kundu A. 2004. Provision of tenurial security for the urban poor in Delhi: recent trends and future perspectives. Habitat Int. 28(2):259–274. doi:https://doi.org/10.1016/S0197-3975(03)00074-2.
- Leby JL, Hashim AH. 2010. Liveability dimensions and attributes: their relative importance in the eyes of neighborhood residents. J Construct Develop Countries. 15(1):67–91.
- Lucas RR. 2007. Long-term disability is associated with lasting changes in subjective well-being: evidence from two nationally representative longitudinal studies. J Pers Soc Psychol. 92(4):717–730. doi:https://doi.org/10.1037/0022-3514.92.4.717.
- Lupala JM. 2002. Infrastructure: Urban types in rapidly urbanising cities . Analysis of Formal and Informal settlements in Dar es Salaam, Tanzania (Doctoral dissertation).
- Lyndhurst B. 2004. Liveability & sustainable development: bad habits & hard choices. London: Final Report for the UK Office of the Deputy Prime Minister.
- Mamuye N, Gotu B. 2015. Statistical analysis of urban quality of life (Case study: Hawassa Town, SNNP Region, Ethiopia). Am J Theor Appl Stat. 4(6):547–554. doi:https://doi.org/10.11648/j.ajtas.20150406.26.
- Marans RW. 2012. Quality of urban life studies: an overview and implications for environment-behaviour research. Procedia-Social Behav Sci. 35:9–22. doi:https://doi.org/10.1016/j.sbspro.2012.02.058.
- Marans RW, Stimson R. 2011. An overview of quality of urban life. .Investigating quality of urban life. 1–29. New York: Springer.
- McClure WR, Bartuska TJ. 2007. The built environment: a collaborative inquiry into design and planning. 2nd ed. Hoboken, NJ: John Wiley and Sons. 3–15
- McCrea R, Stimson R, Western J. 2005. Testing a moderated model of satisfaction with urban living using data for Brisbane-South East Queensland, Soc. Indic Res. 72(2):121–152. doi:https://doi.org/10.1007/s11205-004-2211-x.
- McKinsey Global Institute. 2010. India’s urban awakening: building inclusive cities, sustaining economic growth. McKinsey and Company. [cited 2010 Jun 24]. http://www.mckinsey.com/mgi/reports/freepass_pdfs/india_urbanization/MGI_india_urbanization_fullreport.pdf
- McMhom SK. 2002. The development of quality of life indicators—a case study from the city of Bristol, UK. Ecol Indic. 2(1–2):177–185. doi:https://doi.org/10.1016/S1470-160X(02)00039-0.
- Mercer. (2016). Mercer make tomorrow, today. Retrieved 2017, from 2016 Quality of Living Rankings: https:http://www.imercer.com/content/mobility/quality-of-living-city-rankings.html
- Milbrath LW. 1979. Policy relevant quality of life research. Annal Am Acad Polit Soc Sci. 444(1):32–45. doi:https://doi.org/10.1177/000271627944400104.
- Mittal S, Chadchan J, Mishra SK. 2020. Review of concepts, tools and indices for the assessment of urban quality of life. Soc Indic Res. 149(1):187–214. doi:https://doi.org/10.1007/s11205-019-02232-7.
- Mittal S, Sharma AK. 2017. Quality of life and built environment: theoretical understanding and research gaps. Urban India. 37(2):37–54.
- MoHUA- Ministry of Housing and Urban Affairs. 2018. Ease of living index. New Delhi: Government of India.
- MoUD G. 2009. Handbook of service level benchmarking. New Delhi, Service Level Benchmarks. Ministry of Urban Development, Government of India. 19-79
- National Education Association. 1960. Small-sample techniques. NEA Res Bulletin. 38(4):99–104.
- NYC-New York City Center for Innovation through Data Intelligence (CIDI) (2015). State of New Yorkers— A well-being index. Retrieved from https://www1.nyc.gov/assets/cidi/downloads/pdfs/nyc_well_being_index_full_report_2015.pdf.
- Organization for Economic Cooperation & Development. Working Group on Environmental Indicators. (1978). Urban environmental indicators. Organisation for Economic Co-operation and Development. Washington, DC: sold by OECD Publications Center.
- Pacione M. 2003. Introduction on urban environmental quality and human wellbeing. Landsc Urban Plan. 65(1–2):1–3. doi:https://doi.org/10.1016/S0169-2046(02)00231-1.
- Pandey RU, Garg YG, Bharat A. 2010. A framework for evaluating residential built environment performance for livability. ITPI J. 7(4):12–20.
- Pandey RU, Garg YK, Bharat A. 2013. Understanding qualitative conceptions of livability: an Indian perspective. Int J Res Eng Technol. 2(12):374–380. doi:https://doi.org/10.15623/ijret.2013.0212064.
- Paul A, Sen J. 2017. Identifying factors for evaluating livability potential within a metropolis: a case of Kolkata. Int J Civil, Environ, Struct, Construct Archit Eng. 11(1):50–55.
- Rahman T, Mittelhammer RC, Wandschneider PR. 2011. Measuring quality of life across countries: a multiple indicators and multiple causes approach. J Socio Econ. 40(1):43–52. doi:https://doi.org/10.1016/j.socec.2010.06.002.
- Randhawa, A., & Kumar, A. (2017). Exploring sustainability of smart development initiatives in India. International Journal of Sustainable Built Environment, 6(2), 701–710.
- Rawls J. 1999. A theory of justice (Revised ed. Oxford: Oxford University Press.
- Ray SI, Vaidya C. 2011. Planning for sustainable urban form and for Indian cities. Urban India 32(2): 32-49.
- Rosli NS, Hamsa AAK. 2012. A literature analysis on the living environmental elements in residential areas. Urban Plann Manage Malaysia. Unpublished.
- Shekhar H, Schmidt AJ, Wehling HW. 2019. Exploring wellbeing in human settlements-A spatial planning perspective. Habitat Int. 87:66–74. doi:https://doi.org/10.1016/j.habitatint.2019.04.007.
- Shin DC, Johnson DM. 1978. Avowed happiness as an overall assessment of the quality of life. Soc Indic Res. 5(1–4):475–492. doi:https://doi.org/10.1007/BF00352944.
- Shin DC, Rutkowski CP, Park CM. 2003. The quality of life in Korea: comparative and dynamic perspectives. Soc Indic Res. 62(63):3–36.
- Smith DT, Appleyard D, Leuw D. 1981. Improving the residential street environment. (Report FHWA/RD-81/031). Washington DC: Federal Highway Administration, U.S. Department of Transportation.
- Somarriba N, Pena B. 2009. Synthetic indicators of quality of life in Europe. Soc Indic Res. 94(1):115–133. doi:https://doi.org/10.1007/s11205-008-9356-y.
- Streimikiene D. 2015. Quality of life and housing. Int J Inform Educ Technol. 5(2):140. doi:https://doi.org/10.7763/IJIET.2015.V5.491.
- TCPO. 2017. Model building bye-laws. New Delhi: Town & Country Planning Organisation.
- The Economist. (2016). A summary of the liveability ranking and overview. London: The Economist Intelligence Unit
- Veenhoven R. 1996. Happy life-expectancy. Soc Indic Res. 39(1):1–58. doi:https://doi.org/10.1007/BF00300831.
- Windsor, J., & Bowling, A. (2001). Towards the good life: A population survey of dimensions of quality of life. Journal of Happiness Studies, 2, 55–81. http://dx.doi.org/10.1023/A:1011564713657
- Zainal NR, Kaur G, Ahmad NA, Khalili JM. 2012. Housing conditions and quality of life of the urban poor in Malaysia. Procedia-Soc Behav Sci. 50:827–838. doi:https://doi.org/10.1016/j.sbspro.2012.08.085.
- Zorondo-Rodríguez F, Gómez-Baggethun E, Demps K, Ariza-Montobbio P, García C, Reyes-García V. 2014. What defines quality of life? The gap between public policies and locally defined indicators among residents of Kodagu, Karnataka (India). Soc Indic Res. 115(1):441–456. doi:https://doi.org/10.1007/s11205-012-9993-z.