Abstract
A new experimental characterization is presented of time-, field-, and temperature-dependent dynamic effects in magnetization of a nanocomposite which displays slow decay. Field and temperature variations of irreversible susceptibility, χ
irr
, decay coefficient, S, fluctuation field, hf
, and activation volume, V, have been calculated for the nanocomposite sample (Co80Ni20) using a recently developed modified Preisach–Arrhenius (MPA) model. The sample is composed of non-interacting nanoparticles having negligible reversible magnetization. Non-Arrhenius behavior is observed in both the maximum decay coefficient, S
max, and the fluctuation field, hf
, as a function of temperature T. The peak of both temperature curves are identical and occur at a critical temperature Tk
of ∼50 K, which agrees with our experimental results. Based on the effect of a temperature-dependent chemical potential on energy barrier, hf
is studied for T < Tk
and T ≥ Tk
, respectively. A more complete MPA model that can predict the magnetization as function of time, field and temperature for a magnetic material with slow decay rates is proposed. This model uses a multi-variable analytical formula, , which incorporates the characteristic parameters.
1.Introduction
In magnetic information storage devices where a certain magnetization state must be permanently conserved, the decay of magnetization towards anhysteretic ground state with time is normally slow due to the presence of large energy barriers. However, continuous reduction of particle sizes is required in order to achieve ultra-high storage density and the reversal of magnetization has become easier as a result. Thus, magnetic aftereffects of mono-domain ferromagnetic nanoparticles with diameters in the range 10–100 nm, and exhibiting slow decay, have attracted considerable interest [Citation1–5 Citation Citation Citation Citation5].
A modified Presiach–Arrhenius (MPA) model has recently been presented [Citation6] which predicts time reliability of magnetization state in magnetic nanoparticles based on (i) quasi-equilibrium thermodynamics [Citation7,Citation8], (ii) the assumption that the decay rate is maximized at the field that maximizes the irreversible susceptibility [Citation9], and (iii) experimental and artificial data on a Co80Ni20 nanocomposite.
The model can predict the shape of the entire magnetic aftereffect curves, for magnetic materials with slow decay rate, which cannot be observed experimentally within a reasonable time interval. It resolved problems that were attributed to the instability of the Preisach function by including a feedback parameter derived from the Moving model [Citation10,Citation11] and the variance–variable model [Citation12] into the operative field.
The following analytical formula is derived from the MPA model [Citation6],
where t is the relative decay time, hri
is the holding field within the region of interest, T is temperature, tk
is the critical time and σ
t
is the standard deviation of decay rate. EquationEquation (1)(1) enables us to predict the magnetization at any time during the decay process at a given hri
and a given temperature.
In this investigation, the joint presence of field-induced effects and thermal activation in magnetic aftereffect is interpreted. Both field and temperature dependence are shown in characteristic magnetic state parameters, such as coercivity, irreversible susceptibility, decay coefficient and fluctuation field, that are derived from hysteretic and aftereffect measurements. Extension of EquationEquation (1)(1) to a multi-variable function is proposed so that the precise nature of time, field and temperature dependence in magnetic aftereffect can be rigorously described. The accuracy of the extended model has been validated by experimental data.
2. Experimental characterization
The nanocomposite sample used in this study consists of monodispersed quasi-spherical Co80Ni20 ferromagnetic nanoparticles with 50 nm average diameter (i.e., homogeneous in size). The nanoparticles, prepared by the polyol method, are embedded in a diamagnetic PVC polymer matrix with uniform distribution [Citation13]. The nanocomposite contains the Co80Ni20 nanoparticles at 0.4 wt % concentration. Hence, each nanoparticle is an isolated single-domain particle, and according to Wohlfarth [Citation9], the activation volume of each nanoparticle is the actual particle volume. The sample also satisfies the MPA model criteria: (i) negligible reversible magnetization and (ii) negligible interaction between the magnetic nanoparticles. As shown in , physical properites (i.e. size, shape, and distribution) of the nanocomposite sample are obtained from TEM and SEM images.
Figure 1. (a) TEM image [Citation1] of Co80Ni20 nanoparticles with 50 nm average diameter and (b) SEM image [Citation13] of the Co80Ni20 nanoparticles prepared by polyol process.
![Figure 1. (a) TEM image [Citation1] of Co80Ni20 nanoparticles with 50 nm average diameter and (b) SEM image [Citation13] of the Co80Ni20 nanoparticles prepared by polyol process.](/cms/asset/9c611259-18fc-4a87-85ae-7b13c2b0c0f0/tsnm_a_672343_o_f0001g.gif)
Hysteresis loops and magnetic aftereffect curves of the Co80Ni20 nanocomposite were measured at temperatures ranging from 5 K to 300 K, using a SQUID magnetometer (Quantum Design, MPMS XL 5.0 Tesla). The diamagnetic contribution of the PVC matrix has been measured separately and substracted in the data presented.
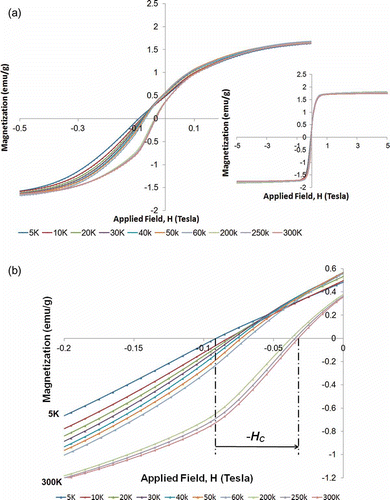
shows descending hysteretic curves at selected temperatures from 5 K to 300 K over the field range –5 Tesla to 5 Tesla. As the temperature increases from 5 K to 300 K, coercivity Hc decreases monotonically from 0.095 Tesla to 0.035 Tesla (, shown by an arrow).
Figure 2. (a) Hysteresis loops of the Co80Ni20 nanocomposite at selected temperatures from 5 K to 300 K after correction for the diamagnetic PVC matrix. Main panel: highlight of the hysteresis loops over field range –0.5 to 0.5 Tesla. Inset: hysteresis loops over the field range –5 to 5 Tesla. (b) Highlight of hysteresis loops in (a) over the field range –0.2 to 0.0 Tesla. The arrow illustrates the shift of decreasing coercivity H c (increasing –H c) as the temperature increases from 5 K to 300 K.
The irrversible susceptibility χ irr [Citation14] is defined as
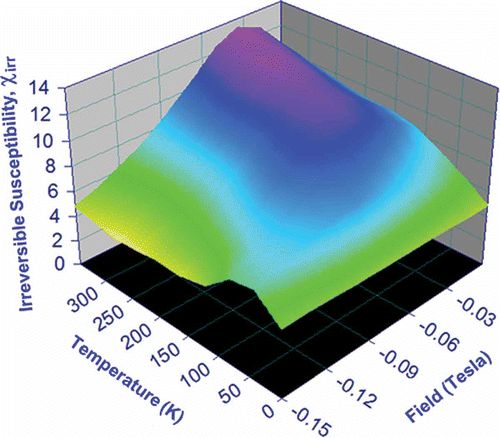
Since the reversible magnetization is negligible for the Co80Ni20 nanocomposite, χ irr can be derived from the remanent magnetization curve. As shown in , χ irr is dependent on both applied field and temperature. As temperature increases from 5 K to 300 K, the value of the maximum irrversible susceptibility χ irr,max (i.e. the peak of each χ irr curve) increases monotonically and the location of the χ irr,max shifts to lower field (shown by arrow). For any combination of temperature and field, the value of the correponding irrversible susceptibility can be found on the three-dimensional surface in .
Figure 3. Applied field dependence of irrversible susceptibility for the Co80Ni20 nanocomposite at selected temperatures from 5 K to 300 K. The maximum irreversible susceptibility χ irr,max of each curve (peak value) is represented by black dot. The arrow illustrates the shift of increasing χ irr,max as the temperature increases from 5 K to 300 K.
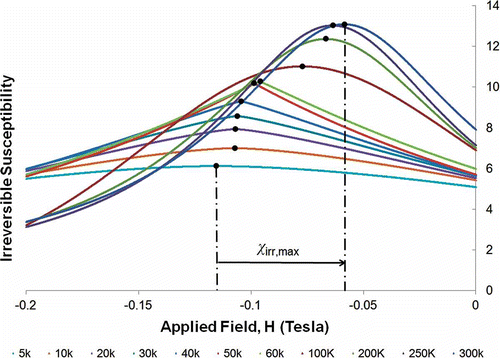
Figure 4. Applied field and temperature dependence of irreversible susceptibility for the Co80Ni20 nanocomposite. The color varies from light green for small values of χ irr to purple for χ irr,max.
3. Implementation of modified Preisach-Arrhenius model
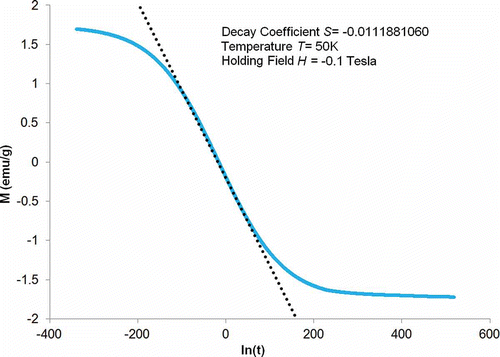
The recently developed MPA model can predict the shape of the entire magnetic aftereffect curves for magnetic materials with slow decay rate, and thus, enables us to accurately extract the maximum decay coefficient, S max, at a given holding field, H, and temperature, T. shows the predicted sigmodal-shaped decay curve at a given temperature (T = 50 K) and holding field (–0.1 Tesla) using MPA model (solid blue). The location and value of the maximum decay slope S max (dotted) can be accurately calculated.
Figure 5. Extraction of decay coefficient from decay curve using MPA model.
After obtaining the values of decay coefficient at any given temperature and field, the applied field dependence of decay coefficient is studied for selected temperatures within the range of 10 K to 300 K. As shown in , the decay coefficient is dependent on both the applied field and the temperature. At each temperature, the applied field at which the maximum decay coefficient (black dot) occurs has been defined as the remanent coercivity hrc [Citation15]. As the temperature increases from 10 K to 300 K, the value of hrc decreases monotonically, as shown by the arrow. The value of S max, increases as temperature increases from 10 K to 50 K (dotted line) and then decreases as temperature increases further from 50 K to 300 K (dashed line). Note: S max reaches the maximum value when the temperature is 50 K.
Figure 6. Holding field dependence of decay coefficient, S, for the Co80Ni20 nanocomposite at selected temperatures from 10 K to 300 K. As temperature increases from 10 K to 300 K, S max increases first from 10 K to 50 K, reaches peak value at 50 K and then decreases from 50 K to 300 K.
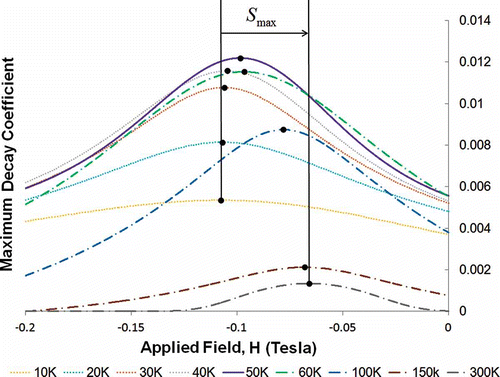
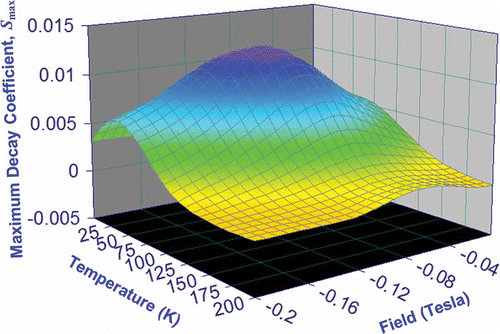
Non-Arrhenius behavior [Citation16] is observed in the maximum decay coefficient S max as a function of the temperature T curve, with the peak, S max, at the critical temperature Tk of ∼50 K (). The non-Arrhenius behavior implies that the density of states in energy space is not uniform and the energy distribution of magnetic excitations obeys quantum statistics rather than Maxwell–Boltzmann statistics which are assumed in the Preisach–Arrhenius model. Bose-Einstein statistics have been proposed to explain similar non-Arrhenius behavior in nano-magnetic materials [Citation17,Citation18]. In , the maximum decay coefficient is plotted, in three dimensions, as a function of both temperature and holding field. For any combination of temperature and field, the value of the correponding maximum decay rate can be found on the surface in .
Figure 7. Temperature dependence of the maximum decay coefficient for the Co80Ni20 nanocomposite. MPA model evaluated S max at selected temperatures are represented by red dots. The non-Arrhenius behavior is illustrated by the black fitting curve.
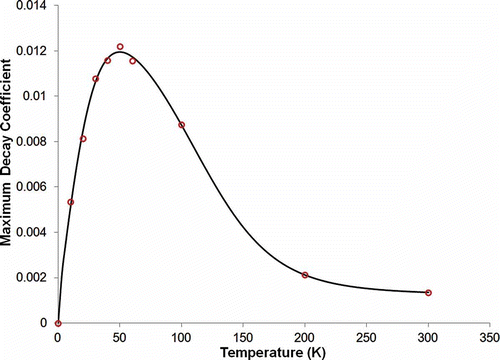
Figure 8. Temperature and field dependence of the maximum decay coefficient for the Co80Ni20 nanocomposite. The maximum decay coefficient varies from light green for small values of S max to dark blue for peak value of S max.
4. Extension to modified Preisach-Arrhenius model
The fluctuation field hf , introduced by Néel [Citation19] and expanded by Street and Brown [Citation14] is defined as
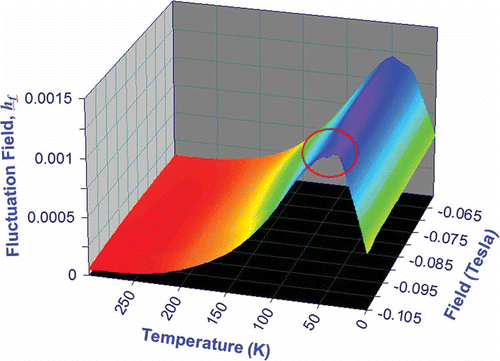
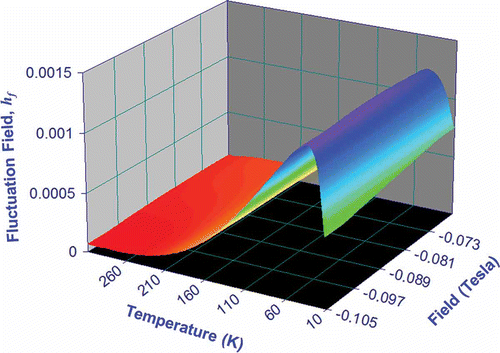
where S is the decay coefficient and χ irr is irreversible susceptibility. Hence, hf can be rigorously determined from macroscopic measurements of S and χ irr . As shown in and , both S and χ irr are dependent on the variation of T and H, where H is the holding field in S(H, T) and the applied field in χ irr (H, T). Note, the fluctuation field may also have time dependence, which can be attributed to the gradual variation in magnetic properties of the moments during the thermal relaxation process.
In , the fluctuation field is plotted, in three dimensions, as a function of both temperature and field. Note: the generated surface (highlighted by red circle) is expected to have percent error of ±0.5%, due to the limited amount of data obtained from measurements of S and χ irr .
Figure 9. Temperature and applied field dependence of the fluctuation field for the Co80Ni20 nanocomposite. hf were rigorously determined from macroscopic measurements of S and χ irr .
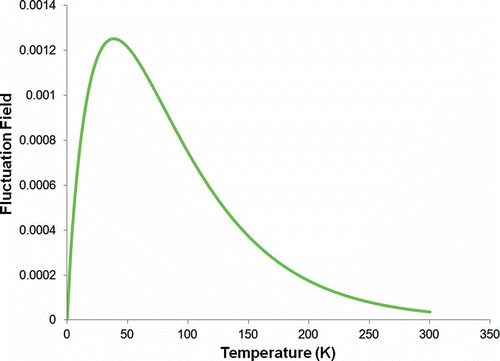
At each holding field in the region of interest, the non-Arrhenius behavior has been observed in the fluctuation field vs. temperature curves. shows the temperature dependence of the fluctuation field at a representative applied field of –0.1 Tesla, with a peak value at a critical temperature Tk of ∼50 K. Even though the location of the critical temperature varies at different holding fields in the range of negative saturation to positive saturation, the variation is negligible within the region of interest. Hence, for the special case of a monodispersed nanoparticulate system that exhibits slow decay, the fluctuation field, the driving force of the magnetic thermal aftereffect over the energy barrier, can be assumed to be independent of the holding field within the region of interest. Therefore,
Figure 10. Temperature dependence of fluctuation field at a representative applied field of –0.1 Tesla.
Wohlfarth [Citation9] suggested that hf can alternatively be evaluated by equating two definitions of an activation energy
Hence, the hf can alternatively been given by
where μ0 is the Bohr magneton, k is the Boltzmann constant, MS is the saturation magnetization, T is the temperature and V is the activation volume [Citation20–22 Citation Citation22].
Della Torre and co-workers [Citation16] introduced a temperature-dependent chemical potential ζ to describe the magnetic aftereffect when the holding field is close to coercivity, i.e. the system has a substantial spin entropy s. The temperature dependence of the fluctuation field below and above the critical temperature can then be described separately. For T < Tk
, the fluctuation field hf
(T) can be described by EquationEquation (6)(6), which is directly proportional to temperature, except for weak temperature changes associated with variations in MS
and V. For T ≥ Tk
, the effect of chemical potential on the energy barrier is not negligible and the expression of hf
(T) is modified, accordingly:
shows the joint field and temperature dependences of the fluctuation field that were evaluated using EquationEquation (7)(7). The difference between and in the peak region (highlighted by red circle in ) is attributed to the inaccuracy in the measured data (±0.5%).
Figure 11. Temperature and applied field dependence of the fluctuation field for the Co80Ni20 nanocomposite. hf
were evaluted using EquationEquation (7)(7).
It is proposed to incorporate the interpretation of the temperature dependence of magnetic aftereffect into the previously developed MPA model and to extend EquationEquation (1)(1) to a multi-variable function, based on the behavior of fluctuation field
where critical time tk (T) is given by
the standard deviation of decay rate σ t (T) is given by
and fluctuation field hf
(T) can be given by EquationEquation (6)(6) and EquationEquation (7)
(7) for T < Tk
and T ≥ Tk
, respectively.
Note that expanding EquationEquation (8)(8) up to the 4th order term (n = 4) gives a computationally efficient approximation of the equation.
5. Conclusion
The characteristic parameters, such as irreversible susceptibility, χ irr , maximum decay coefficient, S max, and fluctuation field, hf , have been derived on dimensional grounds, i.e. both field and temperature variation, from hysteretic and thermal aftereffect measurements and theoretical analysis based on the MPA model. As the temperature increases, while χ irr,max increases monotonically, S max and hf within hri demonstrate non-Arrhenius behaviors, which are interpreted as follows: (i) for T < Tk , hf , derived by equating two definitions of activation energy, is directly proportional to temperature, except for weak variations in saturation magnetization MS and activation volume V with temperature, (ii) for T ≥ Tk , a temperature-dependent chemical potential reduces the effective energy barrier, and as a result, exerts an influence on the behavior of hf . These interpretations have been incorporated into the extended multi-variable analytical MPA model, which is quantatively consistent with the presented data.
Acknowledgements
The authors thank Dr. Vázquez of CISC, Madrid, Spain for providing us with the nanocomposite sample. The authors are grateful to Prof. M. Wagner and Dr. C. Yan of The George Washington University for collaboration and to Drs. C. Dennis and V. Provenzano of the National Institute of Standards and Technology for fruitful discussions. The work is partially supported by National Science Foundation under Contract no. 0733526 and no. 1031619.
References
- Luna , C. , Morales , M. , Serna , C. and Vázquez , M . 2003 . Multidomain to single-domain transition for uniform Co80Ni20 nanoparticles . Nanotechnology , 14 : 268 – 272 .
- Baker , C. , Ismat Shah , S. and Hasanain , S.K. 2004 . Magnetic behavior of iron and iron-oxide nanoparticle/polymer composites . J. Magn. Magn. Mater , 280 : 412 – 418 .
- Jeong , J. , Lee , S. , Kim , J. and Shi , S. 2004 . Magnetic properties of Fe3O4 nanoparticles encapsulated with poly(d,l-lactide-co-glycolide) . IEEE Trans. Magn , 40 : 3015 – 3017 .
- Parekh , K. and Upadhyay , R.V. 2010 . Static and dynamic magnetic properties of monodispersed Mn0.5Zn0.5Fe2O4 nanomagnetic particles . J. Appl. Phys , 107 : 053907
- Calero-DdelC , V.L. , Santiago-Quinonez , D.I. and Rinaldi , C. 2011 . Quantitative nanoscale viscosity measurements using magnetic nanoparticles and SQUID AC susceptibility measurements . Soft Matter , 7 : 4497 – 4503 .
- Gu , S. , Jin , Y. , Chen , P. , Yan , C. , Della Torre , E. and Bennett , L. H. 2012 . Modeling of magnetic material displaying magnetic aftereffect with slow decay rates . Phys. B: Condens. Matter 407 , pp. 1372–1376.
- Demokritov , S.O. , Demidov , V.E. , Dzyapko , O. , Melkov , G.A. , Serga , A.A. , Hillebrands , B. and Slavin , A. N. 2006 . Bose–Einstein condensation of quasi-equilibrium magnons at room temperature under pumping . Nature , 443 : 430 – 433 .
- Bennett , L.H. , Della Torre , E. , Johnson , P.R. and Watson , R.E. 2007 . A phase diagram for the Bose–Einstein condensation of magnons . J. Appl. Phys , 101 : 09G103
- Wohlfarth , E.P. 1984 . The coefficient of magnetic viscosity . J. Phys. F: Met. Phys , 14 : L155 – L159 .
- Della Torre , E. 1966 . Effect of interaction on the magnetization of single domain particles . IEEE Trans. Audio Electroacoust , 14 : 86 – 93 .
- Alejos , Ó. and Della Torre , E. 2001 . Magnetic aftereffect dependence on the moving parameter of the Preisach model . Phys. B: Condens. Matter , 306 : 67 – 71 .
- Pardavi-Horvath , M. , Della Torre , E. and Vajda , F. 2011 . A variable variance Preisach model . IEEE Trans. Magn , 37 : 3793 – 3795 .
- Sanz , R. , Luna , C. , Hernández-Vélez , M. , Vázquez , M. , López , D. and Mijangos , C. 2005 . A magnetopolymeric nanocomposite: Co80Ni20 nanoparticles in a PVC matrix . Nanotechnology , 16 : S278 – S281 .
- Street , R. and Brown , S. D. 1994 . Magnetic viscosity, fluctuation fields, and activation energies . J. Appl. Phys , 76 : 6386 – 6390 .
- Della Torre , E. , Bennett , L.H. , Fry , R.A. and Ducal , O.A. 2002 . Preisach–Arrhenius model for thermal aftereffect . IEEE Trans. Magn , 38 : 3409 – 3416 .
- Rao , S. , Della Torre , E. , Bennett , L.H. , Seyoum , H.M. and Watson , R.E. 2005 . Temperature variation of the fluctuation field in Co/Pt . J. Appl. Phys , 97 : 10N113
- Swartzendruber , L. , Rugkwamsook , P. , Bennett , L.H. and Della Torre , E. 2000 . Non-Arrhenius temperature dependence of magnetic after effect . J. Appl. Phys , 87 : 5684 – 5686 .
- Della Torre , E. and Bennett , L.H. 2001 . Temperature variation of magnetic aftereffect . IEEE Trans. Magn , 37 : 1118 – 1122 .
- Néel , L. 1951 . Le trainage magnetique . J. Phys. Radium , 12 : 339 – 351 .
- Gaunt , P. 1986 . Magnetic viscosity and thermal activation energy . J. Appl. Phys , 59 : 4129 – 4132 .
- Wernsdorfer , W. , Orozco , E.B. , Hasselbach , K. , Benoit , A. , Barbara , B. , Demoncy , N. , Loiseau , A. , Pascard , H. and Mailly , D. 1997 . Experimental evidence of the Néel–Brown model of magnetization reversal . Phys. Rev. Lett. , 78 : 1791 – 1794 .
- Bennett , L.H. , Della Torre , E. , Rao , S. and Watson , R.E. 2006 . Activation volumes of magnetic aftereffects: Role of the magnon chemical potential in nanomagnets . IEEE Trans. Magn , 42 : 3614 – 3616 .