
Abstract
Dielectric elastomers are widely investigated as soft electromechanically active polymers (EAPs) for actuators, stretch/force sensors, and mechanical energy harvesters to generate electricity. Although the performance of such devices is limited by the dielectric strength of the constitutive material, the electrical breakdown of soft elastomers for electromechanical transduction is still scarcely studied. Here, we describe a custom-made setup to measure electrical breakdown of soft EAPs, and we present data for a widely studied acrylic elastomer (VHB 4905 from 3M). The elastomer was electrically stimulated via a planar and a hemispherical metal electrode. The breakdown was characterized under different conditions to investigate the effects of the radius of curvature and applied force of the hemispherical electrode. With a given radius of curvature, the breakdown field increased by about 50% for a nearly 10-fold increase of the applied mechanical stress, while with a given mechanical stress the breakdown field increased by about 20% for an approximately twofold increase of the radius of curvature. These results indicate that the breakdown field is highly dependent on the boundary conditions, suggesting the need for reporting breakdown data always in close association with the measurement conditions. These findings might help future investigations in elucidating the ultimate breakdown mechanism/s of soft elastomers.
Introduction
Soft materials are currently enabling the design of new sets of applications, far beyond the possibilities of conventional engineering solutions based on hard materials. Examples of applications include microfluidic devices, stretchable electronics, haptics, and tuneable optics[Citation1–Citation6].
Dielectric elastomers are soft materials used to obtain soft electromechanical transducers for applications such as actuators[Citation7,Citation4], mechanical energy harvesters to generate electricity [Citation8,Citation9], and stretch or force sensors[Citation10,Citation11]. The elementary configuration of a dielectric elastomer transducer consists of a soft deformable capacitor made of an elastomer film sandwiched between two compliant electrodes. When used as a dielectric elastomer actuator (DEA), electrical charge is transferred to the electrodes, so as to generate an electrostatic stress that compresses the elastomer at constant volume, such that the film reduces in thickness and expands in area[Citation7].
The electrical and mechanical properties of the elastomer determine the extent of the achievable electrically induced deformations, which are characterized by the mechanical nonlinearity[Citation12–Citation15]. While mechanical instabilities of freestanding membranes have been identified to depend strongly on viscoelastic properties [Citation15], the ultimate mechanism/s of electrical breakdown of elastomers are still poorly understood. Indeed, previous studies are greatly fragmented, being focused on the effects of different factors (often considered individually), such as stiffness [Citation16], pre-stretch [Citation17–Citation23], temperature [Citation24], as well as thickness[Citation19,Citation22]. The interaction of these test parameters and others in combination has never been investigated.
Here, we report on the significance of the following two boundary conditions of the electrical breakdown test: the curvature of a hemispherical electrode used to probe (together with a planar counter-electrode) the breakdown strength and the normal contact force applied between the two electrodes. While this investigation still doesn’t address the need for more comprehensive and exhaustive insights on the combined effect of a large number of key parameters, we believe that it adds useful information that so far has not been studied sufficiently.
Materials and methods
Experimental setup
The electrical breakdown measurements were undertaken in accordance with the standards for dielectric elastomer transducers[Citation25]. In particular, the measurements were taken on a layer of a dielectric elastomer electrically stimulated via two metal electrodes, one having a planar and the other a hemispherical shape. The hemispherical electrode was indented into the elastomer with a controlled force F, as represented in .
Figure 1. Schematic diagram of the configuration used to measure the dielectric strength of a soft elastomer film backed by a planar rigid electrode and indented by a hemispherical rigid electrode.
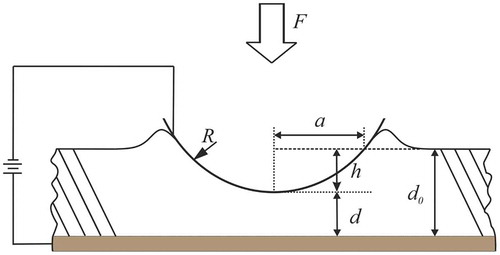
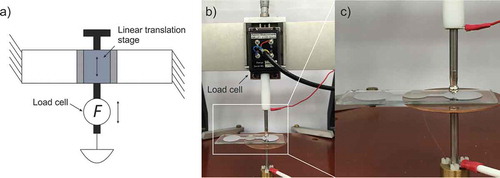
The setup allowed for the variation of the following parameters: the radius of curvatures R of the hemispherical electrode and the loading force F applied by it. The hemispherical electrode deformed the elastomer down to a penetration depth h, with a hemispherical contact surface of base radius a. The applied force F was monitored by a load cell (model UF1 200 g, Applied Measurements Limited, UK) attached to a linear translation stage, which together formed a custom-made system specifically designed and assembled for this work. The translation stage was manually operated (via a micrometer screw) to control the electrode position, so as to have a desired initial force. So the system was operated in position control mode and the force was allowed to vary according to the material’s stress relaxation. The entire system is presented in .
Figure 2. Experimental setup: (a) schematic of the system; (b) visualization of the entire system; (c) magnification of the sample, electrodes, and electrical contacts.
For the sake of clarity, it is worth mentioning here that the electrode position was not determined from the micrometer screw (to avoid errors associated with a visual reading), but from a separate micro-indentation test, described later in the paper, which allowed to accurately obtain the relationship between force and electrode penetration depth.
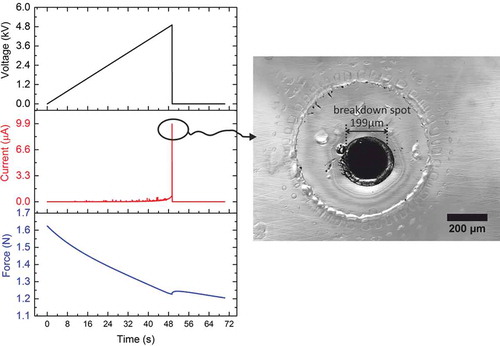
Voltage, current, and force signals were simultaneously measured while applying voltage ramps of 100 V/s until breakdown, as shown in the example of .
Figure 3. Examples of voltage, current, and force signals simultaneously measured during a breakdown test. It is worth noting the typical stress relaxation of the elastomer that continues for the entire duration of the test, even after the breakdown event. The inset photo shows the damage left on the elastomer by the electrical breakdown, visualized using a confocal microscope.
The voltage ramps were generated using a high-voltage amplifier (model 610E, Trek Inc., USA) connected to a personal computer. The current was measured using a variable gain virtual ground current amplifier with selectable current ranges from 10 pA to 1 A.
Preparation of the samples
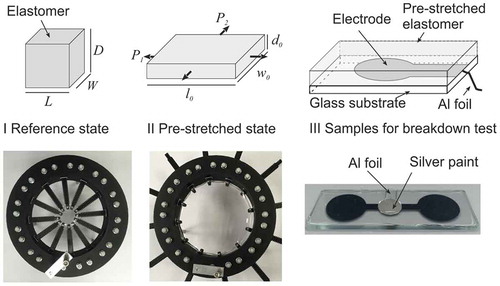
A newly acquired batch of acrylic elastomer film VHB 4905 from 3M (St. Paul, MN, USA) was used. After releasing the film from the support liner, a piece of the elastomer was first radially pre-stretched by a stretch ratio λ = 4, so as to achieve an equi-biaxial pre-strain of 300%, using the apparatus shown in . The pre-stretched freestanding elastomer membrane was then attached to a clean glass slide previously coated with evaporated aluminum (working as the backing planar electrode), also shown in .
Figure 4. Preparation of the samples: the dielectric elastomer film (I) is first radially pre-strained by 300% using a stretching apparatus (II) and then attached to a glass substrate with an evaporated aluminum electrode (III). An aluminum foil was used to connect the planar electrode to the high-voltage lead and a silver conductive paint was applied to ensure the electrical contact between the aluminum foil and the electrode. Note that in the picture the evaporated Al electrodes (which coat the top surface of the glass substrate) are two in number (so as to test two regions of the same elastomer sample), and they appear black because of an optical effect.
The application of a 300% pre-strain to the elastomer film was justified by the well-known beneficial effect of pre-stretch, which increases the electromechanical transduction performance, as first documented by Pelrine et al. [Citation7] and later explained in different ways by Brochu and Pei [Citation26] and Koh et al. [Citation8].
Due to the incompressibility of the elastomer film, the applied pre-stretch caused an increase of its initial lengths L and W to l0 and w0, respectively, with a reduction of the initial nominal thickness from D = 500 µm to d0 = 31.25 µm (as calculated from the applied pre-stretch), as shown in .
Electrodes
Different hemispherical electrodes were manufactured by Käfer Messuhrenfabrik GmbH (Villingen-Schwenningen, Germany) using stainless steel, with different radii of curvature R equal to 1.0, 2.5, and 5.0 mm. The electrodes were cleaned before use with acetone. Also, the electrode was frequently cleaned during the whole test using acetone and any damaged electrodes with burning spots were discarded directly after usage.
As described above, the bottom electrode consisted of a layer of aluminum deposited on the surface of the glass slide used as a support of the elastomer film. Prior to evaporating aluminum, the glass slide was cleaned using acetone, isopropanol, and then pure water, in sequence, in an ultrasonic bath. The aluminum layer had a thickness of 70–100 nm and was deposited by evaporation. The aluminum electrode was shaped as two connected circles, as visible in and , each of them having a diameter of 20 mm. Samples with observable flaws such as air bubbles at the interface between the glass slide and the aluminum layer were discarded prior to testing.
The top electrode was grounded (as an electrical safety measure to protect the load cell), while the bottom electrode was connected to the high-voltage source. An aluminum foil was used to establish the contact between the aluminum electrode and the high-voltage lead. The electrical connection between the aluminum electrode and the aluminum foil was ensured using a silver conductive paint (Silver 20 g Bottle Paint Conductive Adhesive from RS Components).
Measurement of the penetration depth and minimum thickness
As the system was not able to measure force and displacement simultaneously, the penetration depth h was separately measured for selected samples via an independent quasi-static micro-indentation test. The adopted apparatus is schematically represented in .
Figure 5. Schematic of the micro-indentation system used to correlate the penetration depth to the applied force.
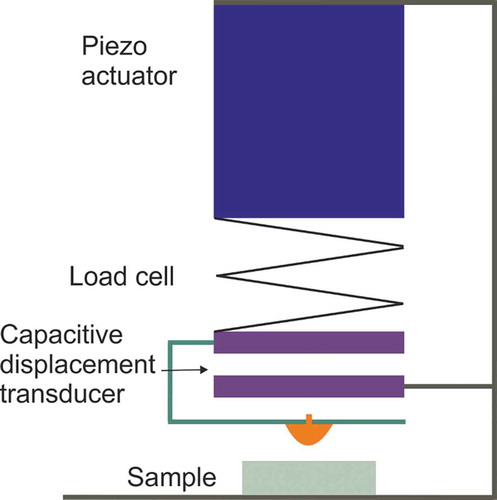
The details of this system have been described in[Citation27]. It included an indenter driven by a piezoelectric linear actuator, coupled to a load cell and a parallel plate capacitive displacement transducer. The tip of the indenter was equipped with the same hemispherical electrodes used for the electrical breakdown tests, so as to mimic exactly the same loading conditions.
The displacement transducer had a nominal displacement resolution of 20 nm. The load cell was based on a strain gauge and had a nominal force resolution of 1 mN. The machine allowed for either force or displacement control. In this work, it was used in force control mode, so as to measure different indentation depths corresponding to given applied forces. The point of contact between the indenter and the sample was determined once the force reached 0.01 N.
The final displacement of the indenter was determined after compensation of the inherent compliance of the system. This was done by first recoding the output of the system when the indentation was performed on a simple glass slide, not covered by any elastomer film; this condition allowed us to quantify the system’s own compliance.
The measurement of the penetration depth of an elastomer film covering a glass substrate allowed us to calculate the minimum thickness d achieved by the film, underneath the hemispherical electrode, as a result of the compression exerted by the electrode ():
It is worth remarking here that the micro-indentation apparatus was not used also for the breakdown measurements because of safety concerns. Indeed, the high voltages could have exposed the apparatus to a risk of damage or malfunctioning (due to the capacitive principle of operation of the position sensing). However, the actual risk was not analyzed in detail in this work and, so, future developments might re-consider the option of using this apparatus for the breakdown tests.
Estimate of the hemispherical contact area
The area of the portion of the hemispherical electrode’s surface in contact with the elastomer, which is the electrode’s contract area A, was estimated geometrically as the area of a hemispherical cap having radius of curvature R and height h ():
It is worth mentioning that an alternative method to quantify the contact area was also attempted, but then it was discarded. The method was based on the measurement of the base radius a of the hemispherical contact surface (). Indeed, once the top electrode had been pulled out after the indentation test, a residual circular mark on the surface of the elastomer was visible, especially with confocal microscopy, as shown in .
Figure 6. Microscopic images showing a circular mark that was left on the elastomer film by a hemispherical electrode with R = 2.5 mm after an indentation with F = 2 N, as soon as the electrode was pulled out: in (a) the mark is visualized under a conventional bright light microscope; in (b) the same mark is visualized more clearly under a confocal microscope, which enhances the edges; in (c) the mark is identified by a circle via post-processing of the confocal microscopic image. Note: the images show also a large number of air bubbles of variable size (including a very big one on the right-hand top side), which remain trapped between the elastomer film and the underlying glass slide, resulting from the film being stretched and released while the hemispherical electrode is pulled away.
The contact area can be expressed as a function of a and h, as follows:
However, h can be expressed as a function of a and R:
So, A can be expressed as a function of a and R, as follows:
The base radius a was determined as an average value from five confocal microscopic images taken from five different samples.
Contact area values calculated from measurements of the penetration depth (Equation (2)) and measurements of the base radius (Equation (5)) are compared in .
Figure 7. Contact area as a function of the radius of curvature of the hemispherical electrode under an applied force of 2 N: comparison between values calculated from measurements of the penetration depth (Equation (2)) and values calculated from measurements of the base radius (Equation (5)). For the data points related to Equation (5), error bars represent the standard deviation of five measurements. For the data points related to Equation (2), the error was determined with reference to the accuracy (20 nm) of displacement sensing offered by the micro-indentation system; however, the resulting error was too small to be visible in this figure. Lines connecting data points are used as a guide for the eye.
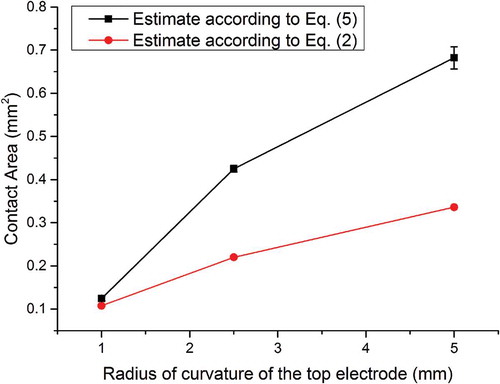
The comparison of the contact area values calculated from Equation (5) with those calculated from Equation (2) shows that the former are significantly larger. So, the two methods are not equivalent and a selection is needed. Our choice for the method based on Equation (2), which relies on the measurement of the penetration depth rather than on that of the base radius, had the following motivation. The base area observed under the microscope was considered to be not sufficiently reliable, as the permanent set ring in the elastomer (still visible after the electrode had been pulled off) did not necessarily relate to the actual outer edge of the contact ring during the test, owing to a number of reasons. First, it might include the footprint of the material that was stacking at the edge of the electrode. Moreover, the actual outer edge could undergo a weak compression under test and so it might peel off without leaving any visible witness marks. Also, the microscopic image was taken after (not simultaneously with) the mechanical indenting and therefore the elastomer had already started a relaxation. So, any future further investigation of this possible alternative method of assessment of the contact area would necessarily require a measurement in situ, simultaneously with the breakdown test.
Definition and measurement of the electrical breakdown
As the event of electrical breakdown of any elastomer is not unequivocally identified in terms of quantifiable electrical variables, any investigation aimed at measuring electrical breakdown requires a robust definition of the event itself. In this work, it was defined as follows. The voltage applied between the electrodes was ramped up at 100 V/s, and the leakage current was monitored until an amplitude of 10 µA was detected. The voltage corresponding to this (arbitrarily set) current threshold was defined as the breakdown voltage, Vbreak. This choice for this current threshold value was justified by the fact that an inspection of the samples afterwards generally revealed only one breakdown spot (localized burned area), as shown by the example in .
Aimed at gathering data of statistical significance, the breakdown voltage was assessed with repeated tests, according to the following procedure. For each hemispherical electrode under each applied force, 36 breakdown measurements on different samples were performed. Usually, four breakdown measurements were gathered from each sample by sampling it at different locations.
The ratio between the breakdown voltage Vbreak and the minimum thickness d of the elastomer film underneath the hemispherical electrode was defined as the breakdown field:
Ebreak corresponded to the amplitude of the electric field along the axis that is perpendicular to the surface of the elastomer film and passes through the center of the hemispherical electrode. Along that axis, the electric field had its highest amplitude within the whole sample, as the distance between the two electrodes had the minimum value.
Results and discussions
Penetration depth, contact area, and average stress
presents results of the micro-indentation test. As expected, the penetration depth h increased with an increase of the applied force F, for every tested electrode (indenter).
Figure 8. (a) Results of the micro-indentation of the elastomer film with the different hemispherical electrodes used as indenters having a different radius of curvature R: penetration depth h as a function of the applied force F; dots have been added to the curves returned by the measurements to mark the initial values of the force used in the breakdown tests. (b) Material’s stiffening effect due to the indentation: average stress σ as a function of the penetration depth h; lines connecting data points are used as a guide for the eye.
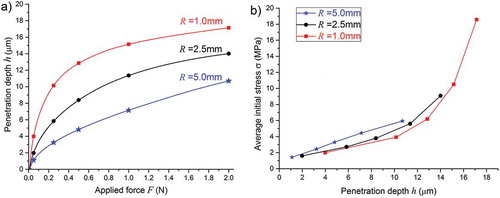
For any applied force, an increase of the radius of curvature of the indenter caused a reduction of the penetration depth and, therefore, an increase of the minimum thickness. This was due to the fact that indenters with larger size had a higher contact area A and, therefore, applied a lower average stress σ, defined as follows:
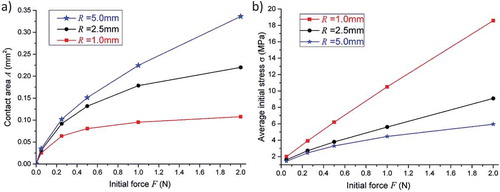
By extracting from the data points marked therein and using them in Equations (2) and (7), it is straightforward to ascertain the relationship between the applied force F (initial value used in the breakdown tests) and both the contact area A and the average stress σ (initial value). The results are plotted in .
Figure 9. Contact area A (a) and average initial stress σ (b) as functions of the applied force F (initial value used in the breakdown tests), for different radii of curvature R of the hemispherical electrode. Lines connecting data points are used as a guide for the eye.
Breakdown voltage and breakdown field
presents the breakdown voltage and breakdown field as functions of the applied force F, the minimum thickness d, and the average stress σ, for the different radii of curvature R of the hemispherical electrode.
Figure 10. Electrical breakdown variables for the different radii of curvature R of the hemispherical electrode: breakdown voltage (a, b, c) and breakdown field (d, e, f) as functions of the applied force F (initial value), minimum thickness d and average stress σ (initial value) resulting from F. Bars represent the standard deviation of 36 measurements. Lines connecting data points are used as a guide for the eye.
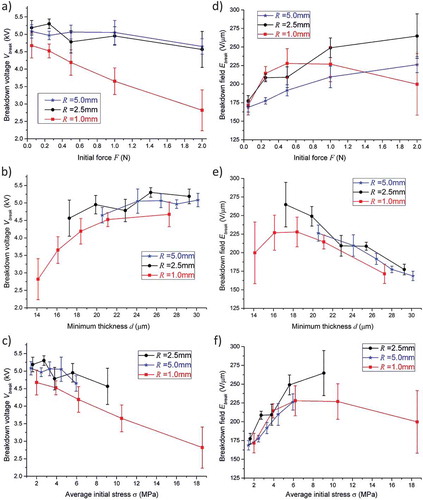
The substantially monotonic decrease of the breakdown voltage with the increase of the applied force, for each electrode, () was expected, as it is consistent with the monotonic decrease of the minimum thickness caused by a monotonic increase of the average stress (). This effect of straightforward dependence of the breakdown voltage on the minimum thickness and average stress is summarized in and .
Nevertheless, the situation does not appear so trivial when the breakdown field (rather than the breakdown voltage) is considered. Indeed, and show that breakdown did not occur at a constant ratio between voltage and minimum thickness. Actually, we observe a dependence of the breakdown field on the applied force (), which varied according to both the size and the force applied by the hemispherical electrode. This result might be ascribed to two distinct and somewhat antagonistic effects, as discussed below.
For relatively low applied forces (up to 0.5 N in this work), the increase of the force caused a substantially monotonic increase of the breakdown field, for each size of the electrode (). Also, smaller electrodes corresponded to a higher breakdown field (). This behavior might be due to an increase of the average stress, occurring with both an increase of the applied force and a reduction of the electrode’s size (). Indeed, higher compression stresses led to a stiffening of the elastomer (), which would be consistent with findings of previous studies showing that the breakdown strength of polymers increases with the material’s Young’s modulus[Citation28,Citation16].
However, this effect does not stand alone, as it is not able to explain the full range of our data. Indeed, at high forces (higher than 0.5 N in this work), our smallest electrode (R = 1 mm) corresponded to a progressive decrease of the breakdown field (), despite a continuous and very significant increase of the stress (). So, it is evident that an increase of the average stress does not necessarily cause an increase of the breakdown field. This is evident from , where the field for R = 1 mm shows a non-monotonic trend with the average stress.
This observed ‘deviation’ might be due to the following effect that takes place at the same time with the other. Smaller electrodes have a smaller contact area (), which causes a smaller surface distribution of electrical charge, creating a higher local charge density. As a higher charge density would then correspond to a higher electrical stress applied to the material locally, this might explain the observed reduction of the breakdown field.
However, it is worth stressing that both the effects mentioned above should be considered as attempts to provide simple interpretations of our experimental results from a purely qualitative standpoint and with a limited set of data available. The experimental results presented here show that the electrical breakdown of soft elastomers is an area of research that still requires extensive and deeper enquiry in order to obtain coherent understanding of the whole diversity of interplaying physical effects.
Future developments of these investigations are necessary to add important missing information. Among the improvements that could be introduced, some aspects that we consider of primary interest are briefly mentioned below.
First of all, it would be useful to extend this study to different levels of pre-stretch and to different materials, for comparisons. A second aspect of interest deals with an investigation on the effect of the stress relaxation. Indeed, in this work, the amount of time elapsed from pre-stretching to testing was not controlled systematically. This should be considered for future developments, which could certainly benefit from a more a systematic approach. A third aspect of interest deals with the determination of how the stiffness of the elastomer changes with the applied force, so as to correlate breakdown and stiffness[Citation16]. While our data show (as expected) a stiffening effect with the indentation (), a reliable estimate of the stiffness would require an accurate model of the system, referring to a condition of indentation of a constrained elastomeric membrane. Finally, this study has not investigated any possible effects played by volumes. This would require nonlinear electromechanical modeling, especially taking into account how the distribution of the electric field varies by changing the size and indentation of the hemispherical electrode.
So, while this paper was aimed at describing custom-made equipment and methodological approach that could be used to initiate systematic investigations from a purely experimental standpoint, complementary studies approaching the problem from a fundamental standpoint (with modeling and simulations) represent an essential requirement to be addressed by future investigations.
Conclusions
The results of these tests show the following two main evidences. First, the breakdown field (expressing the dielectric strength) greatly depends on the applied mechanical stress; the most remarkable variation was obtained with the electrode having a radius of curvature of 2.5 mm, which caused an increase of the breakdown field by about 50% for a nearly 10-fold increase of the applied mechanical stress (approximately from 1 to 10 MPa, as shown in ). Second, the breakdown field greatly depends on the electrode size; the most remarkable variation was obtained at a mechanical stress around 10 MPa, which caused an increase of the breakdown field by about 20% for an approximately twofold increase of the radius of curvature (precisely 1 and 2.5 mm, as shown in ).
These results indicate that the breakdown field is highly dependent on the boundary conditions. This evidence suggests the need for reporting breakdown data always in close association with the related measurement conditions. Moreover, we hope that the preliminary findings presented here (and, especially, more systematic extensions that might follow in the future) could serve as a useful contribution to attempts to elucidate the ultimate breakdown mechanism/s for soft elastomers.
Disclosure statement
No potential conflict of interest was reported by the authors.
Additional information
Funding
References
- S.R. Quake, and A. Scherer, From Micro- to Nanofabrication with Soft Materials, Science 290 (2000), pp. 1536–1540.
- J. Ryu, M. D’Amato, X. Cui, K.N. Long, H. Jerry Qi, and M.L. Dunn, Photo-origami—Bending and folding polymers with light, Applied Physics Letters 100 (2012), p. 161908.
- C. Keplinger, J.Y. Sun, C.C. Foo, P. Rothemund, G.M. Whitesides, and Z. Suo, Stretchable, transparent, ionic conductors, Science 341 (2013), pp. 984–7.
- F. Carpi, S. Bauer, and D. De Rossi, Stretching Dielectric Elastomer Performance, Science 330 (2010), pp. 1759–1761.
- F. Carpi, G. Frediani, S. Turco, and D. De Rossi, Bioinspired Tunable Lens with Muscle-Like Electroactive Elastomers, Advanced Functional Materials 21 (2011), pp. 4152–4158.
- M. Aschwanden, and A. Stemmer, Polymeric, electrically tunable diffraction grating based on artificial muscles, Optics Letters 31 (2006), pp. 2610–2612.
- R. Pelrine, R. Kornbluh, Q. Pei, and J. Joseph, High-Speed Electrically Actuated Elastomers with Strain Greater Than 100%, Science 287 (2000), pp. 836–839.
- S.J.A. Koh, T. Li, J. Zhou, X. Zhao, W. Hong, J. Zhu, and Z. Suo, Mechanisms of large actuation strain in dielectric elastomers, Journal of Polymer Science Part B: Polymer Physics 49 (2011), pp. 504–515.
- T.G. McKay, B.M. O’Brien, E.P. Calius, and I.A. Anderson, Soft generators using dielectric elastomers, Applied Physics Letters 98 (2011), p. 142903.
- B. O'Brien, J. Thode, I. Anderson, E. Calius, E. Haemmerle, and S. Xie, Integrated extension sensor based on resistance and voltage measurement for a dielectric elastomer, Proc. SPIE 6524 (2007), p. 652415.
- H. Böse, and E. Fuß, Novel dielectric elastomer sensors for compression load detection, Proc. SPIE 9056 (2014), p. 905614.
- Z. Suo, Theory of dielectric elastomers, Acta Mechanica Solida Sinica 23 (2010), pp. 549–578.
- C. Keplinger, T. Li, R. Baumgartner, Z. Suo, and S. Bauer, Harnessing snap-through instability in soft dielectrics to achieve giant voltage-triggered deformation, Soft Matter 8 (2012), p. 285.
- X. Zhao, and Q. Wang, Harnessing large deformation and instabilities of soft dielectrics: Theory, experiment, and application, Applied Physics Reviews 1 (2014), p. 25.
- M. Kollosche, G. Kofod, Z. Suo, and J. Zhu, Temporal evolution and instability in a viscoelastic dielectric elastomer, Journal of the Mechanics and Physics of Solids 76 (2015), pp. 47–64.
- M. Kollosche, and G. Kofod, Electrical failure in blends of chemically identical, soft thermoplastic elastomers with different elastic stiffness, Applied Physics Letters 96 (2010), p. 071904.
- G. Kofod, P. Sommer-Larsen, R. Kornbluh, and R. Pelrine, Actuation Response of Polyacrylate Dielectric Elastomers, Journal of Intelligent Materials Systems and Structures 14 (2003), pp. 787–793.
- H.R. Choi, K. Jung, N.H. Chuc, M. Jung, I. Koo, J. Koo, J. Lee, J. Lee, J. Nam, M. Cho, and Y. Lee, Effects of prestrain on behavior of dielectric elastomer actuator, Proc. of SPIE 5759 (2005), pp. 283–291.
- J. Huang, S. Shian, R.M. Diebold, Z. Suo, and D.R. Clarke, The thickness and stretch dependence of the electrical breakdown strength of an acrylic dielectric elastomer, Applied Physics Letters 101 (2012), p. 122905.
- A. Tröls, A. Kogler, R. Baumgartner, R. Kaltseis, C. Keplinger, R. Schwödiauer, I. Graz, and S. Bauer, Stretch dependence of the electrical breakdown strength and dielectric constant of dielectric elastomers, Smart Materials and Structures 22 (2013), p. 104012.
- A.P. Gerratt, and S. Bergbreiter, Dielectric breakdown of PDMS thin films, Journal of Micromechanics and Microengineering 23 (2013), p. 067001.
- D. Gatti, H. Haus, M. Matysek, B. Frohnapfel, C. Tropea, and H.F. Schlaak, The dielectric breakdown limit of silicone dielectric elastomer actuators, Applied Physics Letters 104 (2014), p. 052905.
- S. Zakaria, P.H.F. Morshuis, M.Y. Benslimane, L. Yu, and A.L. Skov, The electrical breakdown strength of pre-stretched elastomers, with and without sample volume conservation, Smart Materials and Structures 24 (2015), p. 055009.
- L. Liu, H. Chen, B. Li, Y. Wang, and D. Li, Thermal and strain-stiffening effects on the electromechanical breakdown strength of dielectric elastomers, Applied Physics Letters 107 (2015), p. 062906.
- F. Carpi, I. Anderson, S. Bauer, G. Frediani, G. Gallone, M. Gei, C. Graaf, C. Jean-Mistral, W. Kaal, G. Kofod, M. Kollosche, R. Kornbluh, B. Lassen, M. Matysek, S. Michel, S. Nowak, B. O’Brien, Q. Pei, R. Pelrine, B. Rechenbach, S. Rosset, and H. Shea, Standards for dielectric elastomer transducers, Smart Materials and Structures 24 (2015), p. 105025.
- P. Brochu, and Q. Pei, Advances in Dielectric Elastomers for Actuators and Artificial Muscles, Macromolecular Rapid Communications 31 (2010), pp. 10–36.
- B. Roebuck, M. Stewart, and M. Brooks, Mapping Indentation Hardness, National Physical Laboratory Measurement Note DEPC-MN 030 (2005), p. 12.
- K.H. Stark, and C.G. Garton, Electric Strength of Irradiated Polythene, Nature 4495 (1955), p. 2.