
ABSTRACT
The pristine point of zero charge (p.p.z.c) and zeta potential as a function of pH of boehmite oxide/hydroxide (α-Al2O3·H2O) have been determined for three filter media. The active component in the first two filter media is boehmite nanofibers, only 2 nm in diameter and about 300 nm long. Boehmite nanofibers create high zeta potential (ζtrue≥46 mV) in aqueous solutions in the pH range of 3–8. The p.p.z.c. values were determined to be 11.60 ± 0.15 for nanofibers grafted onto microglass fibers and 11.40 ± 0.15 for agglomerated nanofibers. In the third filter media, a boehmite nanolayer in the form of monocrystalline oxide/hydroxide with a thickness of approximately 1.2 nm is electroadhesively deposited onto siliceous support material with large surface area of about 50 m2/g, therefore forming a highly electropositive composite of boehmite nanolayer on the second highly electronegative solid. Boehmite’s oxide-hydroxide nanolayer surface creates high zeta potential (ζtrue≥50 mV) in aqueous solutions in the pH range of 3–8. The p.p.z.c. value was determined to be 11.38 ± 0.15. The reported values are within accuracy, but they are much higher than the values reported in the literature. X-ray powder diffraction data were supplemented by microscopy, infrared spectroscopy in order to characterize fully synthetic boehmite surfaces.
1. Introduction
In the first half of the twentieth century, measurements were made at mercury electrodes in aqueous electrolytes. Pristine electrode surfaces were in the use in electrochemical measurements with expectation of rigorously clean surface of liquid mercury before the solid electrodes came into use in the 1950s and polymer-modified electrodes in 1978 [Citation1]. The basic ideas and terminology of pristine point of zero charge (p.p.z.c.) were borrowed from the mercury solution system [Citation2]. The p.p.z.c. value of mercury against a normal hydrogen electrode has been established by Grahame in 1947 in his famous review of experimental works that at the time all have been studied at liquid mercury solution systems [Citation3]. Certain electrolytes (e.g., NaF, NaOH, K2CO3, and Na2SO4) behave indifferently [Citation2,Citation4]; that is, their concentration does not affect the position of the p.p.z.c. of mercury. The concept of p.p.z.c., inert electrolytes, and specific adsorption is applicable for materials other than mercury, e.g., metal oxides, but with certain limitations [Citation2,Citation4]. The p.p.z.c. are typically properties of a surface in the uncharged state and can only be defined for positively or negatively charged surfaces. They play an important role in double layers and are sensitive to impurities on a surface that can significantly affect the p.p.z.c. value. Because of the sensitivity of the p.p.z.c. value to small amounts of adsorbed charged or uncharged molecules, radicals or atomic ions, the notion p.p.z.c. has been defined as the point of zero charge of a virgin (uncontaminated) surface (see Section 3.8 of ref. [Citation4]).
Parks [Citation5] has compiled the p.p.z.c. values of metal oxides and related materials published until 1965, and Kosmulski [Citation2,Citation6,Citation7] collected the p.p.z.c. values of metal oxides and related materials published over the period 1966–2009. The purity of materials is the most important factor responsible for discrepancies in the literature data. In contrast to the success of new spectroscopic methods in the studies of specific adsorption, the progress in studies of primary surface charging of oxides over recent years is less spectacular [Citation2]. The p.p.z.c./isoelectric point (i.e.p.) values range from <2, if any (see Table 3.205 of ref. [Citation7]), for natural boehmite to 10.4 (see Table 3.202 of ref. [Citation7] and ref. [Citation8]) with an average value of 8.7 ± 0.9 based on 37 out of total 40 reported values [Citation7] where the error bound is an estimated value of 1 standard deviation (1σ).
There is a limited number of experimental work available in the literature where the derived p.p.z.c. values, Fourier transform infrared (FTIR) spectra, X-ray powder diffraction (XRD) patterns, transmission electron microscopy (TEM), and scanning electron microscopy (SEM) images were analyzed simultaneously to study the microstructure and properties of surfaces.
In this paper, we report on the similarity in the surface charges as a function of pH and on differences in geometrical parameters of boehmite’s nanofibers either agglomerated into a micron-sized powders with average particle size of ~50 μm [Citation9] or grafted onto microglass fibers [Citation10] and boehmite’s oxide-hydroxide nanolayer in the form of monocrystalline oxide/hydroxide electroadhesively deposited onto high surface area (from 20 to 200 m2/g) siliceous support material [Citation11]. XRD data were supplemented by SEM and TEM microscopy and infrared spectroscopy in order to characterize fully synthetic boehmites and to discern the property variations among them. The boehmites that have been produced and studied are probably more chemically pure than most boehmite materials previously studied and which were reported in the literature. In all cases involved in this study, the syntheses involve a reaction of high-purity aluminum metal (purity >99%) with alkaline water, resulting in a pristine boehmite surface [Citation9–Citation11].
2. Materials and methods
2.1. SEM and TEM analyses
The TEM images were recorded on the JEOL JEM2010 TEM at 200 kV accelerating voltage. No coating was applied. The SEM images were recorded on the JEOL JSM6335F SEM at 5 kV. Sample preparation for a nonconductive materials seen in was by applying a gold-palladium alloy by sputtering in vacuum to a thickness of a few nanometers (<5 nm). A coating of this thickness would not be visible in images at this magnification.
Figure 1. TEM and SEM images of boehmite nanostructures: top panel: (a) TEM image of boehmite nanofibers; (b) TEM image of boehmite nanofiber agglomerate; (c) SEM image of boehmite nanofiber agglomerates. Courtesy of Ms T. Rivkin of National Renewable Energy Laboratory (NREL). Middle panel: (d) TEM image of boehmite nanofibers bonded to glass microfiber; (e) SEM shows a carpet of boehmite nanofibers completely covering the glass microshaft; (f) nano silica enveloping the nano boehmite structure. Courtesy Dr R. Ristau of IMS, University of Connecticut. Bottom panel: (g) SEM of aluminized DE60 particles; (h) TEM of aluminized DE80 particles. Courtesy of Dr A. Slesarev of Rice University.
2.2. XRD patterns
Powder XRD pattern with filtered Cu Ka line with wavelength at 0.154056 nm shows (see ) that sample of agglomerated nanofibers seen in is principally boehmite oxide/hydroxide (α-Al2O3·H2O, also labeled as AlO(OH) or AlOOH) with some amount of aluminum hydroxide (Al(OH)3) and unknown phase of alumina (Al2O3). After baking at 465°C for 3 h and then at 200°C for 24 h, the powders were examined again. The hydroxide and boehmite peaks disappeared and weak and broad peaks (see ) after baking could be matched with cubic Al2O3. The first reflection at the lowest diffraction angle, corresponding to the 020 reflection of boehmite [Citation12], has measured position 2θ = 14.54° with an estimated breadth of β = 0.8 ± 0.5° based on three reflections that were measured at half-maximum intensity after subtracting the sharp portion of the reflections. The Scherrer equation (1),
Figure 2. XRD spectrum of boehmite nanofibers seen in . Courtesy of Ms T. Rivkin of NREL.
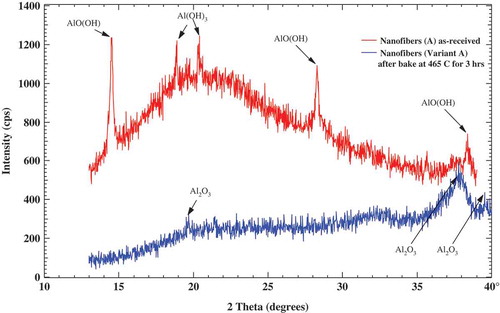
where τ is the mean size of the ordered (crystalline) domains, which may be smaller or equal to the grain size, and K is a dimensionless shape factor, with a value close to unity. The shape factor has a typical value of about 0.9, but varies with the actual shape of the crystallite; λ is the X-ray wavelength; β is the line broadening at half the maximum intensity (FWHM), after subtracting the instrumental line broadening, in radians; and θ is the Bragg angle, had been used in the determination of size of particles of crystals in the form of powder [Citation13] seen in to give an average geometrical size of 10 ± 6 nm while using the typical value of the shape factor K = 0.9 which is in a good accord with the average geometrical fiber size of ~10 nm seen in with average diameter d ~ 2 nm and average length l ~ 300 nm.
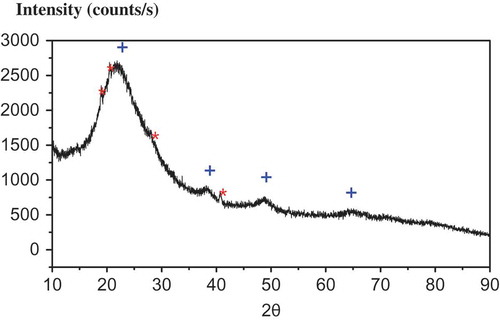
Powder XRD pattern with filtered Cu Ka line with wavelength at 0.154056 nm shows (see ) that a sample of aluminized siliceous powders is principally boehmite oxide/hydroxide (α-Al2O3·H2O) with some amount of bayerite (Al(OH)3). The parameter β = 3.0 ± 0.9° was estimated using a simplified integral breadth method where size-induced and strain-induced broadenings are deconvoluted by considering the peak width as a function of 2θ, based on three reflections at 2θ = 38.3°, 49.0° and 64.0° that were measured at half-maximum intensity. The Scherrer equation (1) gives an average geometrical size of 2.9 ± 0.9 nm while using the typical value of the shape factor K = 0.9 which is in a good accord with the average geometrical cluster size of ~2.3 nm (see below) with N = 10 and a, b, and c being the boehmite orthorhombic crystal lattice cell parameters with the space group
. When boehmite’s crystallite size decreased the local octahedral symmetry tended to be tetrahedral [Citation14].
Figure 3. XRD spectrum of boehmite nanocoating. Broad reflection features at 2θ = 38.3°, 49.0° and 64.0° marked by crosses (blue) correspond to nanosized boehmite coating with estimated geometrical size of ~ 2.3 nm. Sharp features marked by crosses (red) correspond to crystalline structure of bayerite. (Courtesy of Dr S. Valloppilly of Nebraska Center for Materials and Nanoscience of University of Nebraska–Lincoln.)
2.3. FTIR spectrum of agglomerated boehmite nanofibers
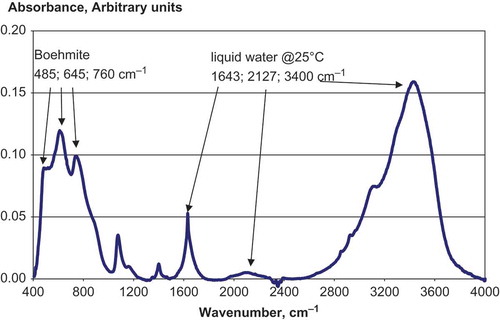
The FTIR spectrum of agglomerated boehmite nanofibers seen in is shown in . All analyzed samples contain the broad hydroxyl OH stretch absorption around 3300–3400 cm−1 that can be due to water. Boehmites have absorption bands below 1000 cm−1 which can be seen in . The FTIR pattern closely resembles the IR pattern of boehmite sample #7 of ref. [Citation12], which was synthesized at temperature of 42°C followed by freeze-drying and mechanical grinding.
Figure 4. Fourier transform infrared (FTIR) spectrum of boehmite nanofibers seen in . Courtesy of Ms T. Rivkin of NREL.
2.4. Theoretical background on streaming and zeta potentials
When a nonconducting dielectric solid with high surface area is immersed in a dilute electrolyte, it generally causes an increase in electrical conductivity of the electrolyte. This increase is usually associated with the electrical double layer at the solid/liquid interface and is referred as surface conductance (λs) [Citation15]. The phenomenon is quantified in terms of the surface conductivity, Kσ, which is the surface equivalent to the bulk conductivity, KL [Citation16]. Smoluchowski has pointed out that ‘surface conductivity’ might become an important factor in electrokinetic measurements when the conductivity of the liquid was very low [Citation4,Citation17]. A measure of the relative importance of surface conductivity is given by the dimensionless Dukhin number (Du), relating surface (Kσ), and bulk (KL) conductivities, Du = Kσ/KLasurface, where asurface is the local curvature radius of the surface [Citation16]. The surface conductivity can have contributions owing to the diffuse-layer charge outside the plane of shear [Citation18] and to the charge in the stagnant layer [Citation16].
In the case of capillary flow, when the external circuit has high resistance, a potential difference builds up across the capillary (Δϕ≡Estreaming) due to a counter-conduction current inside the capillary, which has a surface (Kσ) and bulk (KL) conduction contributions (see Equation (4.3.41) of ref. [Citation4]):
where ζtrue represents the (true) zeta potential that is characteristic for the surface under study, μ is the dynamic viscosity of the electrolyte solution (for water at 25°C it equals to ~900 μPa·s), ε is the relative dielectric constant of the medium (for water at 25°C it equals to ~78.4), ε0 is the dielectric constant of a vacuum, and Δp is the differential pressure across either a packed bed or a nonwoven filter media that could be viewed as the networks of the capillaries with the same diameter. Results from capillaries of different radius, asurface, gave a consistent value of ζtrue [Citation19]. The effect was significant in the case of a small radius or the electrolyte concentration, c, was small. In the 1930s when this effect was not yet appreciated, the values of ζ-potentials, computed from streaming potentials using
were inconsistent.
The use of Equation (3) sometimes resulted in radius-dependent ζ-potentials and sometimes not, which led to a debate on the question whether or not ζ really was a material- or condition- (pH, c) specific characteristic.
In this limiting case, the measuring signal is independent from the geometry of the capillary provided that kacapillary≫1, where 1/k is known as the Debye length (see Equation (5.2.12b) of ref. [Citation20]). It is important to note that the parameters asurface and acapillary could be very different (see Section 3.5). Streaming potentials are counted positive if the higher potential is on the high pressure side.
By rearranging Equation (3), we can write:
By rearranging Equations (2) and (3), we can write (see also refs. [Citation15,Citation21]):
where RL is the resistivity of the electrolyte (RL = 1/KL). The plot of the reciprocal ζapparent should be linear with intercept 1/ζtrue and slope 2 Kσ /ζtrue asurface. In this way, the Dukhin number can also be measured. As it was noted in ref. [Citation4] (see Section 4.5c), the establishment of Kσ has not yet got the attention it deserves.
Equation (5) allows for a relatively easy estimation of zeta potential with the streaming potential measurements (see Equation (4)). However, the literature tends to favor electrophoresis where the electrophoretic mobility is measured and calculate zeta potential of very small particles capable of undergoing Brownian motion. In the recent publication [Citation22] on the influence of the particle size on the zeta potential of ultra-pure silica powders, the authors found that the maximum zeta potential occurs somewhere along 100 nm and 1 µm. However, after a debate on the question whether or not ζ really was a material- and condition- (pH, c) specific characteristic, now we know that it is the former [Citation18]. When it comes to evaluate ζ, the literature tends to favor the electrophoresis, an instrument used to measure electrophoretic mobility of very small particles via the Helmholtz–Smoluchowski (HS) equation for electrophoresis [Citation16]:
where ue is the electrophoretic mobility.
The act of grinding or crushing large particles for use in electrophoresis, particularly those in which the surface composition differs from the inner bulk material, as in the case of coatings, will lead to incorrect conclusions on surface potential [Citation23].
2.5. Streaming and zeta potential measurement on granular filter media
Streaming potential theory mandates the differential pressure to be within the regime of laminar flow with conservative estimate of the Reynolds number (Re) as
where v0 is the superficial velocity for a granular media. The Δp is a subject of the Burke–Plummer equation as well [Citation24]:
where k = 150 is an empirical constant established via experimentation. This pressure drop value should not be exceeded during streaming potential measurements. For the granular media seen in used in this study (average particle size of aluminized DE18 is approximately 18 µm), a maximum pressure drop was approximately 0.67 bar (~10 psi) at a maximum vsuperficial velocity of 2 mm/s and void fraction of 0.5. The condition for the laminar flow was established by a very low Reynolds number (Re < 0.05) under the condition of the packed bed experiment. Similarly, for the granular media seen in (average particle size of agglomerated boehmite fibers is approximately 50 µm), a maximum pressure drop was 0.41 bar (~6 psi) and condition for the laminar flow was established by a very low Reynolds number (Re < 0.05) under the condition of the packed bed experiment.
The streaming potential is measured by means of a pair of Ag/AgCl electrodes located on both sides of two parts of a channel (ID-19 mm) separated by a septum (three layers of two-dimensional filter media having an irregular pore pattern and an irregular pore size of 0.1–0.2 mm. The aluminized DE powder seen in was packed inside the tube on the septum with depth of 3.5–4.0 cm. A solution of a known conductivity, as measured by Oakton ECTestr Pure, is placed in a pressurized, aluminized DE-packed column and pressure is applied to the vessel and therefore the pressure is transferred to the filter media. The streaming potential is found by applying at a given time an overpressure (Δp, bar) to the vessel and measuring the resulting potential difference (Δϕ≡Estreaming, V) on both sides of the filter bed. The Estreaming and Δp values are measured at ±0.1 mV and ±0.007 bar, respectively. The bulk conductivity of the solutions ranged from 2.9 μS/cm for 0.03 mM/dm3 NaCl to 12.96 mS/cm for 0.12 M/dm3 NaCl solutions in deionized reverse osmosis water with initial conductivity <0.1 μS/cm. The pH values were adjusted with 1 M/dm3 NaOH or with 1 M/dm3 HCl.
2.6. Streaming and zeta potential measurement on nonwoven filter media
A similar approach described above for the granular media was used in ref. [Citation25] to characterize surface electrical conductance and electrokinetic potentials in networks of fibrous materials. The same approach was used in the present work. A novel water purification filter is in the process of development over the past 12 years [Citation9]. The filter’s active component is an alumina monohydrate nanofiber with an external surface area of ~500 m2/g [Citation26]. Micron-size and nanosize particles were readily held by electrostatic forces while forming the nonwoven paper-like sheet [Citation27]. For instance, a 30 × 30 cm2 handsheet was prepared containing 28 wt% of fumed silica with average particle size of ~10 nm (see ). The fumed silica that is very difficult to filter from aqueous mixtures was rapidly clarified to form a clear suspension. The resulting handsheet had a low differential pressure drop of 10 kPa at flow velocity of 0.7 mm/s that is not characteristic of filtered colloidal silica. When examined under the electron microscope, we noted that the silica nanoparticles were clinging to the alumina nanofibers. Handsheets (30 × 30 cm2) were also formed containing atomically thick sheets of graphene oxide (up to 40 wt%), 50 nm titanium dioxide (12 wt%), and RNA (5 wt%). The result was a nanoengineered media that could retain and utilize the function of virtually any submicron or nanosize particle [Citation26]. A practical application was focused on integrating powdered activated carbon (PAC) with average particle size of ~8 μm into the nonwoven structure. Activated carbon has a large amount of its surface area within micropores of about 0.2–2 nm in diameter [Citation28]. At the same time, the dimensions of the pore have a significant impact upon diffusion rates of adsorbed molecules through the granule. Generally, diffusion rates are determined by the mean free path length of the molecules being adsorbed. The smaller the pores, the longer is the mean free path length and the slower the diffusion rates [Citation29]. By substantially reducing the particle’s size, one could reduce the length through the tortuous mesopore and micropore structures, thereby increasing the adsorption rate.
Two layers of nanoalumina media with combined thickness of 1.6 mm and four layers of lyocell-based nanoalumina media [Citation27] with combined thickness of 2.4 mm were inserted into the same apparatus designed for measuring streaming potentials of granular and nonwoven filter media. The flow-average pore diameters of nanoalumina (dflow average~2 μm) and lyocell-based nanoalumina media (dflow average~1 µm) developed for drinking water filtration were determined from the composition data shown in ref. [Citation27] and water permeability B(m2) defined as [Citation30]
where ε is the porosity of the media and
where z is the thickness of the media.
Assuming the highest value of the superficial velocity of 10 mm/s in Equation (7), the Reynolds numbers are low (Re < 0.003) for all studied filter media.
The solution of NaCl of a known conductivity is placed in a pressurized vessel and pressure is applied to the vessel and therefore to the filter.
2.7. Pristine point of zero charge and isoelectric point
The electrokinetic counterpart of the point of zero charge is the i.e.p., that is, where by electrokinetic methods no charge is measured. The i.e.p. and p.p.z.c. can be very different quantities because the former measures the situation where ζ = 0, whereas the latter represents a zero surface charge (see Section 3.8 of ref. [Citation4]). Only under the pristine conditions are they identical.
3. Results and discussion
3.1. Specific surface area analysis of aluminized DE coating in the form of monocrystalline oxide/hydroxide (α-Al2O3·H2O) granular media
shows the Brunauer, Emmett, and Teller (BET) surface area of different grades of aluminized DE composite using nitrogen adsorption. Results of show that the nitrogen BET surface area of several grades of aluminized DE is on the same order of magnitude, that is, the BET ratios of different grades are lesser than a factor of 3.
Table 1. BET surface area of different grades of aluminized DE composites with the use of Nitrogen adsorption at 77 K.
For the purpose of this study, the boehmite content was optimized at 17 wt% (R = 0.17) to 83 wt% of DE18 with average particle size of 18 μm so that the monocrystals cover densely the available surface on the DE scaffolding.
compares the nitrogen BET surface area of untreated DE18 and aluminized DE18. Results of show that the surface area of aluminized DE18 increased by 157% as well as the mean pore volume by 185% as compared to the uncoated DE. This suggests that surface properties of aluminized DE significantly change upon the coating procedures. The mean pore width does not change within the accuracy of measurements.
Table 2. BET specific surface area of DE18 and aluminized DE18 with the use of nitrogen adsorption at 77 K.
Assuming that the thickness of the coating, hAlOOH, is the same on the surface ADE of the DE support, we can estimate volume and mass
of the coating as
The thickness of the coating, , can be estimated as
where is nitrogen BET specific surface area (SSA) at 77 K SDE of untreated DE18 of ~ 49.2 m2/g (see ). Using Equation (13) and density of boehmite crystals from 3.0 to 3.07 with average 3.03 and calculated density of 3.07 g/cm3, the thickness of the coating is estimated to be
=11.25 Å which is somewhat shorter than the boehmite orthorhombic crystal lattice cell parameter bAlOOH = 12.12(1) Å [Citation14].
Assuming that the boehmite monocrystals form a cluster with N × N squire that stands alone with two gaps (wa) and (wc) between the N·aAlOOH = N·2.868 Å and N·cAlOOH = N·3.700 Å sides. The surface area (S) of the N × N squire cluster consists of the porous surface (Spores) and external surface area () and the best fit of data of could be obtained if we suggest that monocrystals form into a cluster with Nave = 10:
Table 3. True zeta potential and surface conductivity of aluminized DE18 media in the pH range of 3.0–7.0.
with the ratio of that compares favorably with experimentally determined ratio of nitrogen BET surface area
(see ). The estimated size of the clusters (2.9 × 3.7 nm2) is ten times (Nave = 10) the unit cell dimensions which is consistent with boehmite crystals growth mainly along the a–c plane, where atomic bonds are stronger than interlayer hydrogen bonds [Citation14].
Assuming that the two gaps (wa) and (wc) are equal, we can estimate an increase in pore volume due to the gaps for the surface area covered by one unit:
while excluding the external surface area ():
wa≈wc≈8.4 Å, which are comparable with micropore widths of activated carbon fiber (ACF) wACF≈9.4 Å [Citation31] determined via helium adsorption at 4.2 K and small-angle X-ray scattering experiments. Surface coverage can be estimated as
The above calculations show that the boehmite nanolayer in the form of monocrystalline oxide/hydroxide (α-Al2O3·H2O) with a thickness of approximately 1.2 nm has similar geometrical characteristics with boehmite that was prepared by annealing a boehmite precipitate under hydrothermal conditions at 23°C [Citation14], metal-oxide nanostructures such as quantum-sized ZnO nanocrystals deposited onto SnO2 nanowires substrate [Citation32], CdSe/ZnS quantum dots [Citation33] and ultrathin amorphous alumina nanoparticles [Citation34].
Assuming that no surface exists, other than the inner walls of the pores and that the pore is cylindrical geometry, the mean pore diameter can be calculated from the ratio of the total pore volume and the BET surface area from the following equation:
The mean pore diameter of 15 ± 1 Å for all studied aluminized DE powders (see and ) is comparable with the micropore widths wa≈wc≈8.4 Å estimated from Equation (16).
The He adsorption at 4.2 K, Ar adsorption at 87 K and high-resolution TEM images would be indispensable to verify the above analysis of ultramicroporous character of the coating because the micropore analysis only by N2 adsorption is insufficient and gives a misleading conclusion in the case of ACF fibers [Citation31]. However, such an analysis is outside of the scope of the present work.
3.2. SSA analysis of boehmite 2 nm diameter nanofibers grafted onto microglass fibers
For the purpose of this study, the boehmite nanofiber content was optimized at 40 wt% (R = 0.4) to 60 wt% of glass microfibers (1 – R) so that the alumina nanofibers cover densely the available surface on the 0.6 μm glass microfiber scaffolding. Assuming that boehmite nanofiber grows along the b-axis, the number of nanocrystalline cells in the 2 nm diameter cross section of boehmite nanofiber can be estimated as
which is different from the boehmite clusters of 100 monocrystals that could be viewed as quantum dots (see below) attached individually to the DE surface.
3.3. Streaming and zeta potential measurement on aluminized DE granular media
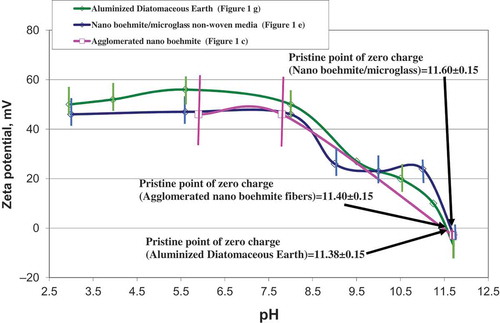
The computed results for true zeta potential and specific surface conductance of aluminized DE coating in the form of monocrystalline oxide/hydroxide (α-Al2O3·H2O) granular media are presented in and and in . As it could be seen from , aluminum oxide-hydroxide nanolayer surface creates high zeta potential (ζtrue≥50 mV) in aqueous solutions in the pH range of 3–8. The p.p.z.c. was determined to be 11.38 ± 0.15.
Table 4. True zeta potential and surface conductivity of aluminized DE18 media in the pH range of 7.0–13.71.
Figure 5. True zeta potentials of nano boehmite agglomerates (c); nano boehmite fiber/microglass filter media (e); and aluminized DE (g) as a function of pH.
3.4. Streaming and zeta potential measurement on nonwoven filter media () and on agglomerated granular media ()
The computed results for true zeta potential are presented in and . As it could be seen from , aluminum oxide-hydroxide nanofibers create high zeta potential (ζtrue≥46 mV) in aqueous solutions in the pH range of 3–8. The p.p.z.c. values were determined to be 11.60 ± 0.15 for nonwoven filter media () and 11.40 ± 0.15 for agglomerated granular media (). The p.p.z.c. values of nanoalumina fibers are within accuracy of measurements with aluminized DE coating and with boehmite adjuvant in the form of aluminum oxyhydroxide fibers [Citation35] with p.p.z.c. value of 11.4. All of the above p.p.z.c. values differ significantly from the value of point of zero charge (p.z.c.) obtained for boehmite surfaces via surface titration and electrophoresis. The p.z.c./i.e.p. values range from <2, if any, for natural boehmite, to 10.4 [Citation7] with an average value of 8.7 ± 0.9.
Table 5. True zeta potential and surface conductivity of nanoalumina fibers grafted on microglass and lyocell support in the pH range of 3.0–11.71.
3.5. True zeta potential and specific surface conductance of low-pressure drop nanoalumina filters at pH 7.0
The computed results for true zeta potential and specific surface conductance of low pressure drop nanoalumina filters [Citation27] at pH 7.0 are presented in . Data of indicate that all filters have similar values of the true zeta potential (ζ true) and surface conductance (Kσ) values even though the pore sizes of the media are 10–20 times greater than these for drinking water filter media of . However, the radius of the assembly seen in , asurface (see Equation (2)), is about the same in the range from 0.5 to 0.6 µm that translates into similar values of the true zeta potential (ζtrue) and surface conductance (Kσ) values for these media.
Table 6. True zeta potential and specific surface conductance of low-pressure drop nanoalumina/microglass filters at pH 7.0.
3.6. Structural characteristics of boehmite’s nanolayer and nanofiber surfaces
Chemical modification of oxide surfaces by deposition of nanosized oxide layers and/or nanostructures has led to the development of zero-, one-, and two-dimensional nanostructures as well as quantum-confined in one-, two-, or three-dimensional nanostructures [Citation32,Citation36 –Citation47]. These developments resulted in a profound impact on electronics, nanocomposite materials, physical, biological, and therapeutic sciences. The exceptional electronic, optical, mechanical, and magnetic properties of the nanoscale materials are usually attributed to the quantum mechanical phenomena when the electrons tend to follow the ‘particle in a box’ model. In the free electron model, the energies of the electronic states vary as a function of 1/L2, where L is the dimension in that direction. These structures can be in the form of ‘stand-alone’ materials or embedded within another media. When the dimensions of a system are reduced to the nanoscale domain, the number of atoms on the surface significantly increases together with the increase in the SSA up to a theoretical surface-to-mass ratio ~2630 m2/g for graphene [Citation44] and up to SSA of ~3000 m2/g for ACF that are commercially available [Citation48].
Nature provides us with many examples of nanostructures that are not new for the scientists. Systems containing aluminosilicates have been investigated as mesoporous materials in the form of zeolite and alumina and asbestos fibers. In 1930, Pauling discussed alkaline-earth aluminosilicates with tetrahedral structures in naturally occurring minerals such as natrolite, the scapolites, and davynite-cancrinite [Citation49] and the formation of fibrous structures in naturally occurring minerals like kaolinite and brucite due to the inherent asymmetry along the c-axis [Citation50]. The basic building blocks of clay minerals are tetrahedrons with Si4+ ions in the center, which are four-coordinated by oxygen and octahedrons with Al3+ ions in the center, which are three-coordinated by oxygen. Tetrahedral and octahedral sheets can be stacked on top of each other as seen in Figure 1.5.12 of ref. [Citation51]. Kaolinite is a clay mineral consisting of a repetition of this double sheet with the links realized through oxygen. It belongs to the category 1:1 clay minerals (see p. 3.164 of ref. [Citation4]). A schematic of the ‘ideal’ kaolin layer (Al(OH)2)2·O·(SiO2)2 is given in Fig. 1.5.14 of ref. [Citation51]. Kaolinite is called a 1:1 nonswelling dioctahedral clay because it has one silica layer to one alumina layer that does not separate from one another under any normal conditions (see p. 28 of ref. [Citation51] and p. 3.164 of ref. [Citation4]). A typical kaolinite crystal would have about 100 or so layers hexagonally shaped into disks with axial ratio of the order of 10:1 (Fig. 1.5.14 of ref. [Citation51]) and they seldom grow to sizes of more than a few microns.
–f shows the TEM and SEM images of boehmite nanofibers. The active component can be classified as 1D nanorods and the entire nanofiber/microglass assembly as a quantum wire (). The assembly can be viewed as a straight cylinder with rough surface and a charge density of approximately 0.08 C/m2. This creates a significant electric field with negligible screening (ka<<1) in the region close to the surface of the assemblies at an electrolyte ionic strength of <~ 1 mM. This field attracts nano- and micron-size particles from as far as 0.3 mm in less than a few seconds, many orders of magnitude greater than the conventional Derjaguin–Landau–Verwey–Overbeek (DLVO) theory, which predicts only nanometer-scale effects arising from the presence of the surface. The strong electric field on the surface is then able to retain particles such as micron-size PAC as well as much smaller particles such as fumed silica nanoparticles of 10–15 nm in diameter (), viruses, atomically thick sheets of graphene oxide, latex spheres, RNA, DNA, proteins, dyes, etc.
Table 7. Classification of quantum-confined structures.
The pore size of the media is 2 μm, yet it can filter suspended solids as small as viruses and does so at high flow rates and at salinity values up to 3.4 M of NaCl (near saturation at 300 K) and at pH in the range from 4 to 10. A single layer can retain 6 LRV (log retention value) of Escherichia coli bacteria and 4 LRV of MS2 viruses. A dual layer of media increases bacteria and virus retention to >7 and 6 LRV, respectively. An alternative media, containing ultrafine (8 µm) PAC particles, was also characterized for metal and particle retention. Its retention of colloidal and suspended solids, including bacteria and virus, was found to be at least as good as by the above media.
The active component in the filter media of ref. [Citation11] is boehmite nanolayer in the form of monocrystalline oxide/hydroxide (α-Al2O3·H2O) with a thickness of approximately 1.2 nm electroadhesively deposited onto siliceous support material with large SSA of about 50 m2/g, thereby forming a highly electropositive composite of boehmite nanolayer on the second electronegative solid. The active component can be classified as quantum dots rather than 2D continuous nanocoating (see and Equations (14–16)). The composite can be viewed as a sphere with a rough surface and charge density of approximately 0.08 C/m2. This creates a significant electric field with negligible screening (ka<<1) in the region close to the surface of the nanocomposite at electrolyte ionic strengths <~ 50 mM. This field attracts nano- and micron-sized particles from as far as 200 μm in a few seconds, many orders of magnitude greater than conventional DLVO theory and does so at high flow rates and at salinity values up to 3.5 M of NaCl and at pH in the range from 3 to 10.5.
4. Conclusions
This paper demonstrates that electropositive charge properties of boehmite’s nanolayer and nanofiber surfaces are similar. The media are suggested for purification of virus and proteins where a high dynamic binding capacity is combined with high flow velocities and at low differential pressure. Chromatographic separations of a range of submicron particles of biological relevance such as viruses, chromosomes, DNA, RNA, and macromolecules at pressure drops <1 bar over ambient, in thin beds and with high flow rates, appear feasible.
The aluminized DE composite in a precoat configuration and nanoalumina nonwoven filters create a strong electric field that extends as far as 380 µm from boehmite’s surfaces into an aqueous dispersive medium. This is many orders of magnitude (>4) greater than that predicted by the DLVO theory. Whatever the mechanism of attraction and adsorption of nano- and micron-size particles, the long-range phenomena are novel and striking and may have important implications not only for surface science but for physics and life sciences.
Acknowledgments
We thank Ms T. Rivkin of National Renewable Energy Laboratory (NREL), Dr R. Ristau of IMS, University of Connecticut, for providing us with XRD, FTIR, TEM, and SEM images of boehmite nanofibers agglomerated and bonded to microglass and lyocell microfibers, Dr S. Valloppilly of Nebraska Center for Materials and Nanoscience of University of Nebraska–Lincoln for providing us with XRD pattern of aluminized siliceous powders, and Dr A. Slesarev of Rice University for providing us with XRD, SEM, and TEM images of aluminized DE powders.
Disclosure statement
No potential conflict of interest was reported by the authors.
References
- A. Merz and A.J. Bard, A stable surface modified platinum electrode prepared by coating with electroactive polymer, J. Am. Chem. Soc. 100 (1978), pp. 3222–3223. doi:10.1021/ja00478a049
- M. Kosmulski, The pH-dependent surface charging and the points of zero charge, J. Colloid. Interface Sci. 253(1) (1 September2002), pp. 77–87. doi:10.1006/jcis.2002.8490
- D.C. Grahame, The electrical double layer and the theory of electrocapillarity, Chem. Rev. 41 (1947), pp. 441–501. doi:10.1021/cr60130a002
- J. Lyklema, Fundamentals of Interface and Colloid Science, Volume II: Solid-Liquid Interfaces, Academic Press, San Diego, 1995.
- G.A. Parks, The isoelectric points of solid oxides, solid hydroxides, and aqueous hydroxo complex systems, Chem. Rev. 65 (1965), pp. 177–198. doi:10.1021/cr60234a002
- M. Kosmulski, Chemical Properties of Materials Surfaces, Dekker, New York, 2001.
- M. Kosmulski, Surface Charging and Point of Zero Charge, CRC Press, Taylor & Francis group, Boca Raton, 2009.
- J. Bugosh, Colloidal alumina- the chemistry and morphology of colloidal boehmite, J. Phys. Chem. 65 (1789), pp. 1961.
- F. Tepper and L.A. Kaledin, Nanosize electropositive fibrous adsorbent. US patent application 20030127393 (2003).
- L.A. Kaledin, F. Tepper, and T.G. Kaledin, Long-range attractive forces extending from alumina nanofiber surface, Int. J. Smart Nano Mater 5 (2014), pp. 133–151. doi:10.1080/19475411.2014.919970
- L.A. Kaledin, F. Tepper, and T.G. Kaledin, Long-range attractive forces extending from the alumina’s nanolayer surface in aqueous solutions, Int. J. Smart Nano Mater. 6 (3) (2015), pp. 171–194. doi:10.1080/19475411.2015.1095254
- R. Tettenhorst and D.A. Hofmann, Crystal chemistry of boehmite, Clays Clay Miner. 28 (1980), pp. 373–380. doi:10.1346/CCMN.1980.0280507
- A. Patterson, The Scherrer Formula for X-Ray particle size determination, Phys. Rev. 56 (10) (1939), pp. 978–982. doi:10.1103/PhysRev.56.978
- X. Bokhimi, J.A. Toledo-Antonio, M.L. Guzman-Castillo, and F. Hernandez-Beltran. Relationship between crystallite size and bond lengths in boehmite. J. Solid State Chem. 159 (2001), pp. 32–40.
- C.S. Oulman and E.R. Baumann, Streaming potentials in diatomite filtration of water, J. Awwa 56 (July 1964), pp. 915–930.
- A.V. Delgado, F. González-Caballero, R.J. Hunter, L.K. Koopal, and J. Lyklema, Measurement and interpretation of electrokinetic phenomena, J Colloid Interface Sci. 309 (2007), pp. 194–224. doi:10.1016/j.jcis.2006.12.075
- J.J. Bikerman, Electrokinetic equations and surface conductance. A survey of the diffuse double layer theory of colloidal solutions, Trans. Faraday Soc. 35 (1940), pp. 154. doi:10.1039/tf9403500154
- J. Lyklema and M. Minor, On surface conduction and its role in electrokinetics, Colloids Surf. A Physicochem. Eng. Asp. 140 (1998), pp. 33–41. doi:10.1016/S0927-7757(97)00266-5
- R.J. Hunter, The significance of stagnant layer conduction in electrokinetics, Adv. Colloid Interface Sci. 100-102 (2003), pp. 153–167. doi:10.1016/S0001-8686(02)00060-X
- J. Lyklema, Fundamentals of Interface and Colloid Science, Volume I: Fundamentals, Academic Press, London, 1991.
- H.R. Kruyt, Colloidal Science, Vol. I, Elsevier Publishing Co., New York, 1952.
- S. Seeger, B. Palm, J. Günster, and J.G. Heinrich, On the influence of the particle size on the zeta potential of ultra-pure silica powders, Ber. DKJ 92 (9) (2015), pp. E35–E40.
- S.E. Truesdail, G.B. Westermann-Clark, and D.O. Shah, Apparatus for streaming potential measurements on granular filter media, J. Environ. Engineer. Dec. (1998), 1226–1232.
- R.B. Bird, W.E. Stewart, and E.N. Lightfoot, Transport Phenomena, John Willey & Sons, Inc., New York, 1960.
- C.E. Mossman and S.G. Mason, Surface electrical conductance and electrokinetic potentials in networks of fibrous materials, Can. J. Chem. 37 (1959), pp. 1153–1164. doi:10.1139/v59-170
- F. Tepper and L.A. Kaledin, Nanostructured chem-bio non-woven filter, in Nanoscience and Nanotechnology for Chemical and Biological Defense. ACS Symposium Series, Vol. 1016, Chapter 21, R. Nagarajan, W. Zukas, T.A. Hatton, and S. Lee, eds., American Chemical Society, Washington, DC, 2009, pp. 273–288.
- F. Tepper and L.A. Kaledin, Drinking water filtration device, US patent 7,390,343 (2008).
- D.R.U. Knappe, K. Li, P.A. Quinlivan, and T.B. Wagner, Effects of Activated Carbon Characteristics on Organic Contaminant Removal, IWA Publishing, Denver, CO, 2003.
- G.M. Tom and L.J. Haltquist, Channelized sorbent media, and methods of making same, US patent 6764755, 2004.
- P.R. Johnston, Fluid Sterilization by Filtration, Interpharm Press, Inc., Buffalo Grove, 1992.
- N. Satoyama, M. Ruike, T. Kasu, T. Suzuki, and K. Kaneko, Surface characterization of microporous solids with He adsorption and small angle X-ray scattering, Langmuir 9 (1993), pp. 2612–2617. doi:10.1021/la00034a021
- W. Yu, X. Li, X. Gao, and F. Wu, Large-scale synthesis and microstructure of SnO2 nanowires coated with quantum-sized ZnO nanocrystals on a mesh substrate, J. Phys. Chem. B 109 (2005), pp. 17078–17081. doi:10.1021/jp0526905
- Q. Liu, H. Li, Q. Xia, Y. Liu, and K. Xiao, Role of surface charge in determining the biological effects of CdSe/ZnS quantum dots, Int. J. Nanomedicine 10 (2015), pp. 7073–7088. doi:10.2147/IJN.S94543
- X. Wu, S. Xiong, J. Guo, L. Wang, C. Hua, Y. Hou, and P.K. Chu, Ultrathin amorphous alumina nanoparticles with quantum-confined oxygen-vacancy-induced blue photoluminescence as fluorescent biological labels, J. Phys. Chem. C 116 (2012), pp. 2356–2362. doi:10.1021/jp210599z
- J.V. Rinella, J.L. White, and S.L. Hem, Effect of anions on model aluminum-adjuvant-containing vaccines, J. Colloid Interface Sci. 172 (1995), pp. 121–130. doi:10.1006/jcis.1995.1233
- J.N. Tiwary, R.N. Tiwary, and K.S. Kim, Zero-dimensional, one-dimensional, two-dimensional and three-dimensional nanostructured materials for advanced electrochemical energy devices, Prog. Mater. Sci. 57 (2012), pp. 724–803. doi:10.1016/j.pmatsci.2011.08.003
- C.A.S. Batista, R.G. Larson, and N.A. Kotov, Nonadditivity of nanoparticle interactions, Science 350 (2015), pp. 1242477. doi:10.1126/science.1242477
- H.W. Kroto, J.R. Heath, S.C. Obrien, R.F. Curl, and R.E. Smalley, C60: Buckminsterfullerene, Nature 318 (6042) (1985), pp. 162–163. doi:10.1038/318162a0
- S.V.N.T. Kuchibhatla, A.S. Karakoti, D. Bera, and S. Seal, One dimensional nanostructured materials, Prog. Mater. Sci. 52 (2007), pp. 699–913. doi:10.1016/j.pmatsci.2006.08.001
- A. Kolmakov and M. Moskovits, Chemical sensing and catalysis by one-dimensional metal-oxide nanostructures, Annu. Rev. Mater. Res. 34 (2004), pp. 151–180. doi:10.1146/annurev.matsci.34.040203.112141
- D. Exerowa and D. Platicanov, Surface forces and nanoscale phenomena in aqueous films containing noninionic polymeric surfactants, in Nanoscience. Colloidal and Interfaceial Aspects, Chapter 3, V.M. Starov, ed., CRC Press, Taylor & Francis group, Boca Raton, 2010, pp. 51–78.
- V.I. Kovalchuk, E.K. Zholkovskiy, M.P. Bondarenko, and D. Vollhardt, Electrokinetic effects during Langmuir-Blodgett deposition process, in Nanoscience. Colloidal and Interfaceial Aspects, Chapter 7, V.M. Starov, ed., CRC Press, Taylor & Francis group, Boca Raton, 2010, pp. 165–192.
- K.S. Novoselov, D. Jiang, F. Schedin, T.J. Booth, V.V. Khotkevich, S.V. Morozov, and A.K. Geim, Two-dimensional atomic crystals, Proc. Natl. Acad. Sci. USA 102 (30) (2005), pp. 10451–10453. doi:10.1073/pnas.0502848102
- F. Bonaccorso, L. Colombo, G. Yu, M. Stoller, V. Tozzini, A.C. Ferrari, R.S. Ruoff, and V. Pellegrini, Graphene, related two-dimensional crystals, and hybrid systems for energy conversion and storage, Science 347 (2015), pp. 1246501. doi:10.1126/science.1246501
- M. Fox and R. Ispasoiu, Quantum wells, superlattices, and band-gap engineering, in Springer Handbook of Electronic and Photonic Materials, Chapt. 42, S. Kasap and P. Capper, eds., Springer, New York, December, 2006, pp. 1021–1040.
- C.B. Murray, D.J. Norris, and M.G. Bawendi, Synthesis and characterization of nearly monodispersed CdE (E=S, Se, Te) semiconductor nanocrystallites, J. Am. Chem. Soc. 115 (1993), pp. 8706–8715. doi:10.1021/ja00072a025
- Q. Liu, H. Li, Q. Xia, and K. Xiao, Role of surface charge in determining the biological effects of CdSe/ZnS quantum dots, Int. J. Nanomedicine. 10 (2015), pp. 7073–7088.
- K. Kaneko, C. Ishii, M. Ruike, and H. Kuwabara, Origin of superhigh surface area and microcrystalline graphitic structures of activated carbons, Carbon 30 (1992), pp. 1075–1088. doi:10.1016/0008-6223(92)90139-N
- L. Pauling, The structure of some sodium and calcium aluminosilicates, PNAS 16 (1930), pp. 453–459. doi:10.1073/pnas.16.7.453
- L. Pauling, The structure of the chlorites, Pnas 16 (1930), pp. 578–582. doi:10.1073/pnas.16.9.578
- R.J. Hunter, Foundations of Colloid Science, Vol. 1, Clarendon Press, Oxford, 1993.