
 ?Mathematical formulae have been encoded as MathML and are displayed in this HTML version using MathJax in order to improve their display. Uncheck the box to turn MathJax off. This feature requires Javascript. Click on a formula to zoom.
ABSTRACT
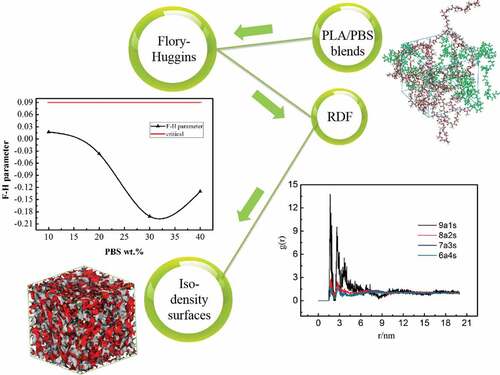
The compatibility of polylactic acid (PLA)/polybutylene succinate (PBS) blends was studied by molecular dynamics and mesoscopic dynamics, which is a controversial issue in experiments. Six simulation models of PLA/PBS with different composition ratios (100/0, 90/10, 80/20, 70/30, 60/40, 0/100) were constructed. The radial distribution function, hydrogen bond, free energy density, order parameter and iso-density surface morphology of the PLA/PBS systems were simulated and analyzed. Due to the formation of hydrogen bonds and van der Waals bonds between different elements of PLA chains and PBS chains, the PLA/PBS blends exhibit good compatibility at all composition ratios.
GRAPHICAL ABSTRACT
1. Introduction
Polylactic acid (PLA) is a biodegradable material, which has been investigated extensively in biomedical field recently. It is considered as one of the most promising alternatives to petro-sourced polymers because of its high modulus, high tensile strength, biodegradability, good biocompatibility, excellent processing performance. And these remarkable properties of PLA have led to its various applications in medical field [Citation1,Citation2]. For instance, drug delivery [Citation3,Citation4], scaffolds [Citation5–Citation8] and other medical devices and implants [Citation9,Citation10]. However, the toughness of PLA at room temperature is very poor, which seriously hinders its application in fields requiring high ductility. Therefore, the modification of PLA with high ductility components is a good way to achieve the balance of flexibility and rigidity [Citation5]. In particular, blending modification is considered to be a highly efficient method [Citation11].
Polybutylene succinate (PBS) is another typical biodegradable polymer with excellent flexibility. The elongation at break can exceed 300% [Citation12]. Therefore, the combination of PLA and PBS is an ideal choice for complementarity. Numerous researchers previously have investigated this. However, they were all experimentally studied.
More seriously, the conclusion of compatibility of PLA/PBS blends is still controversial. Some people argued that they were incompatible [Citation13,Citation14]; some people pointed out that they were compatible [Citation15], while others believed that they were partially compatible [Citation16,Citation17]. Therefore, there is an urgent need to figure out this controversial problem at the molecular level.
Molecular dynamics simulation plays an increasingly important role in predicting and analyzing the properties of materials, because they can give mechanisms that are impossible or difficult to obtain in experiments from the molecular point of view. Moreover, molecular simulation has been considered as a reliable method to investigate the compatibility of polymer blends in recent years. The compatibility of PAM/PVA [Citation18], PEI/PC [Citation19], PLLA/PDLLA/PS/PVPh [Citation20], GAP/DIANP [Citation21], Tacrine/PNBCA/CS [Citation22], IND/PEO/GLU/SUC [Citation23], PVA/PMMA [Citation24], PLL/PVA [Citation25], CS/PVP [Citation26], PET/PLA [Citation21] and PLA/PEG [Citation27] have been studied. Nevertheless, to our knowledge, the compatibility of PLA/PBS at the molecular level has not been reported in the literature. Mesoscopic dynamics is a mesoscale modeling based on Gaussian chain. It can describe the phase separation of blends and display the morphologies of PLA/PBS systems in a more intuitive way.
Here, the compatibility of the PLA/PBS blends was explored by molecular dynamics simulation, and was verified by mesoscopic dynamics simulation. The radial distribution functions, hydrogen bonds, free energy densities, order parameters and iso-density surface morphologies of the simulation systems were analyzed. The relationship between the two components from the molecular to the mesoscopic level was revealed.
2. Simulation methods
2.1 Molecular dynamics
The following series of calculations were operated by Materials Studio 8.0 (Accelrys Inc.) with COMPASS Force Field [Citation28]. This force field has been applied to similar systems to predict polymer behaviors [Citation20]. Six independent amorphous packing models (PBS contents of 10%, 20%, 30%, 40%, 0% and 100%) were established by the Theodorou-Suter method using Amorphous Cell module under periodic boundary conditions [Citation29]. For convenience, sample IDs 9a1s, 8a2s, 7a3s, 6a4s, 10a and 10s were given for each of the six systems. To ensure the accuracy of simulation, three different simulation cells were built for each system, and the final data were extracted from the average values of the three models. The initial construction packing models were generated at T = 298K. The initial density of pure PLA system was 1.206g/cm3 [Citation25], and that of pure PBS system was 1.26g/cm3 [Citation16]. The densities of other systems were calculated according to the composition ratios of PLA and PBS. The details of the simulation cells are displayed in , is the input parameter used to calculate Flory-Huggins parameter (
).
Table 1. Details of the PLA/PBS systems.
For the packing systems, minimizations were performed by Smart Minimizer method to obtain the optimal structures. First, geometry optimization was conducted to lower the energy of the cells using Forcite module. Dynamics was carried out as follows: (i) an NVT ensemble simulation of 100ps at 500K; (ii) an NVT ensemble simulation of 800ps at 500K/1bar. Then the systems were equilibrated again at NPT condition at 298K/1bar for 500ps to obtain the optimal systems and prepare structures for next stage. The final step was an NVT at 298K for 100ps and the last 50ps was extracted for the data collections. It was worth mentioning that the basic principle of the dynamic process was to continue the simulation until the energy or temperature of the system was stable (see Section 3.1 for more details). In addition, the pressure and temperature were maintained through the Andersen barostat and the Berendsen thermostat. The van der Waals and Coulomb interaction forces were calculated by atom-based and Ewald summations, respectively. The cutoff distance was 12.5Å, the time step was 1fs, and trajectories were saved every 500 steps.
2.2 Mesoscopic dynamics
To further validate the compatibility of the PLA/PBS blends, mesoscopic dynamics simulation was performed. The chain length of mesoscopic dynamics () is one of the input parameters of mesoscopic dynamics simulation, which is determined by:
Where is polymer molecular weight,
is the monomer weight,
is the number of repeating units.
is the characteristic ratio, which determines the number of repeating units in a group.
was calculated by the module of Synia, and the values of PLA and PBS were 3.40 and 5.10, respectively.
Another input parameter is , which is correlated with Flory Huggins parameter (
) through:
Where R represents the gas constant and its value is 8.31. T is the simulation temperature. The dimensionless time step, bead diffusion coefficient, grid spacing, bond length and simulation temperature were 0.2, 1.0 × 10⁻⁷ cm−2/s, 1.0nm, 1.1543nm and 298K, respectively. Grid dimension was 32 × 32 × 32 and a frame was output every 1000 steps.
3. Results and discussion
3.1 Compatibility
As mentioned previously, although many experimental studies have been performed on the compatibility of PLA/PBS blends, it is still a controversial issue. Our target is to investigate if they are compatible at the molecular level by molecular dynamics simulation, and then verify the result through mesoscale method.
The Hildebrand solubility parameter , one of the most critical quantities to characterize the degree of attractive interactions for polymers, is determined by:
Where represents the cohesive energy,
represents the molar volume,
represents the density of the cohesive energy.
represents the mix energy of the blend system. The three terms in Equationequation (4)
(4)
(4) represent the
values of PLA, PBS and the blend system, respectively.
and
represent the volume fraction of the two components.
The compatibility of systems was characterized by the Flory-Huggins parameter ():
Where R is the gas constant and its value is 8.31. T is the simulation temperature.
To determine the compatibility of the blend systems, was compared with the critical parameter
, which is determined by:
Where and
are the number of repeating units of PLA and PBS. For our blend systems, the value of
is 0.0903. If
, the blend is incompatible; if
, the blend is partially compatible; if
, the blend is compatible.
The solubility parameter is influenced by the chain length. In order to search the minimum number of repeating units which can sufficiently represent the actual system, the solubility parameters of different chain lengths were simulated and calculated (EquationEquation 3
(3)
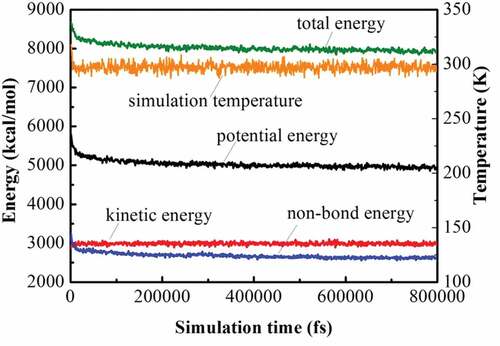
(3) ). shows the curve of PBS solubility parameter change upon the number of repeating units. At the beginning, it decreases significantly with the increase of the chain length. However, when the number of repeating units exceeds 15, the solubility parameter changes little. Hence, considering both the computer calculation resources and the accuracy of the simulations, we chose 15 as the number of PBS representative repeating units. Similarly, the solubility parameter of PLA with different chain lengths were calculated in reference [Citation20], indicating the size of 20 was sufficient. For comparison, the molecular weight of a representative repeat unit of PLA was set to be similar to that of PBS, and thus 36 repeating units were selected for PLA. depicts the structures of PLA and PBS. is the snapshots of blend systems. PLA molecular chains are composed of elements with different colors (C: gray, H: white, O: red), and PBS molecular chains are represented in green. In addition, shows the variation of energy and temperature with simulation time, and slight fluctuations are observed, which verifies the stability and reliability of the system [Citation16].
Figure 1. The curve of PBS solubility parameter versus the number of repeating units.
Figure 2. Structures of (a) PLA monomer, (b) PBS monomer, (c) PLA with 36 repeating units and (d) PBS with 15 repeating units (red: oxygen; white: hydrogen; gray: carbon).
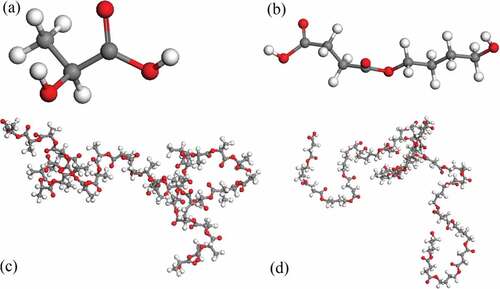
Figure 3. Snapshots of (a) 10a, (b) 9a1s, (c) 8a2s, (d) 7a3s, (e) 6a4s, (f) 10s blends. PLA molecular chains are composed of elements with different colors (C: gray, H: white, O: red), and PBS molecular chains are represented in green.
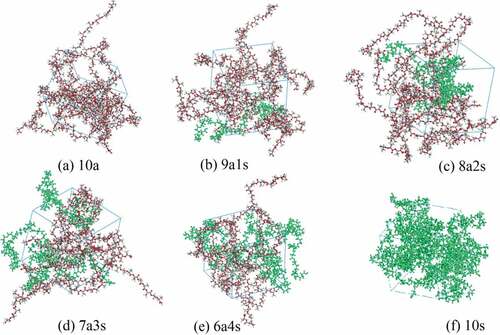
Figure 4. The curve of energy and temperature of the 7a3s blend system versus simulation time.
The parameters of solubility for PLA and PBS are displayed in . As we can see, our simulation results are in reasonable agreement with the literature results [Citation21,Citation30], which confirms the reliability of our simulation systems again. The Flory-Huggins interaction parameter χ for blend systems is derived as a function of composition. As depicted in , the compatibility of the PLA/PBS blends is observed over the entire composition range, because the calculated values of χ are lower than .
Figure 5. The curve of Flory-Huggins parameter versus PBS concentrations.
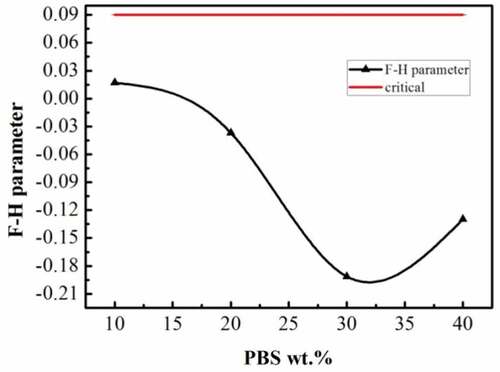
Table 2. Solubility parameters of PLA and PBS.
3.2 Radial distribution function
Radial distribution function (RDF) was analyzed to study the interaction mechanism. RDF represents the probability to find other particles at a certain distance r from the central atom, which can indicate the inter-molecular interactions, it is determined by:
Where is the number of B particles around A (central particle) at distance r,
is the sum of particle B in the system,
is the system volume.
shows the inter-molecular results of the radial distribution function between different elements of PLA chains and PBS chains at 298K. ) illustrates the -O in -C = O of PBS chains and the – H in – OH of PLA chains. For 9a1s system, the first and the highest peak value is 13.77 at 1.67Å, which is in the range of hydrogen bond formation (r < 3.5Å). There are also several lower peaks within 3.5Å. However, no obvious peaks are observed outside 3.5Å, in which the interaction is mainly controlled by Van der Waals bond. And similar results can be obtained from the blend systems of other composition ratios in ). The highest peak values of 8a2s, 7a3s, and 6a4s are 2.82 (at 1.75Å), 2.03 (at 2.77Å) and 1.74 (at 1.79Å), respectively, which decreases with the increase of PBS content. The higher the peak value is, the higher the possibility of forming hydrogen bond is. The hydrogen bonds are responsible for the compatibility of the system [Citation25]. Therefore, the 9a1s system has the best compatibility, which is further confirmed by the curve of the order parameter versus time steps in the mesoscopic dynamics simulation (section 3.3.2). As for ), we can observe that both hydrogen bonds and van der Waals bonds are formed between – H in – OH of PBS chains and -O in -C = O of PLA chains. However, the peak values are significantly lower than those in ). For the g(r) of – H in – OH of PBS chains and -O in – OH of PLA chains ()), there are some distinct peaks in the hydrogen bond control range. The peak values generally decrease with the increase of PBS content. In addition, some broad peaks above 3.5Å were observed, indicating a mixture of non-bond interactions (hydrogen bonds and van der Waals bonds). Hence, there are two mechanisms facilitate the compatibility, forming hydrogen bonds and van der Waals bonds, and the former has a greater contribution.
Figure 6. Radial distribution functions between different elements of PLA chains and PBS chains at 298K. (a) -O (-C = O, PBS chains) and – H (-OH, PLA chains), (b) – H (-OH, PBS chains) and -O (-C = O, PLA chains), and (c) – H (-OH, PBS chains) and -O (-OH, PLA chains).
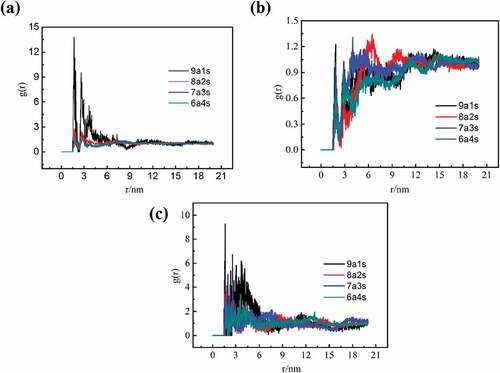
Figure 7. Snapshot of hydrogen bonds (blue dotted bonds) in the cell.
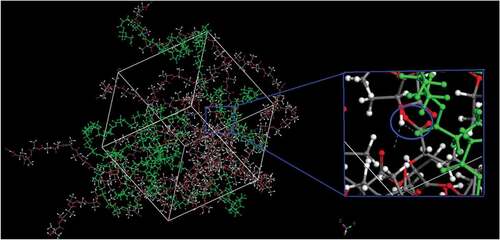
is the snapshot of hydrogen bonds in the cell. The green chains are PBS chains, and others are PLA chains. It shows the hydrogen bond between the -O (-C = O, PBS chains) and – H (-OH, PLA chains) directly, and further supports the results of the radial distribution function.
3.3 Mesoscopic dynamics simulation
3.3.1 Free energy density and order parameter
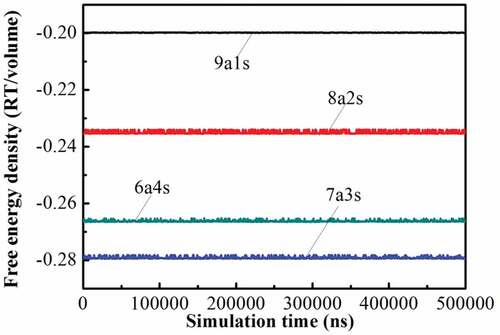
Free energy density is a parameter in mesoscopic dynamics simulation to judge if the system is stable [Citation25]. shows the free energy densities of the blend systems with different composition ratios. With the increase of simulation time, these free energy densities quickly become constant, indicating that the systems are in equilibrium.
Figure 8. Free energy densities of the systems versus simulation time.
Order parameter Pi is another quantity to characterize compatibility, the larger the value, the stronger the phase segregation, which is determined by [Citation31]:
Where is dimensionless density for components,
is the whole density, and
is the regional density.
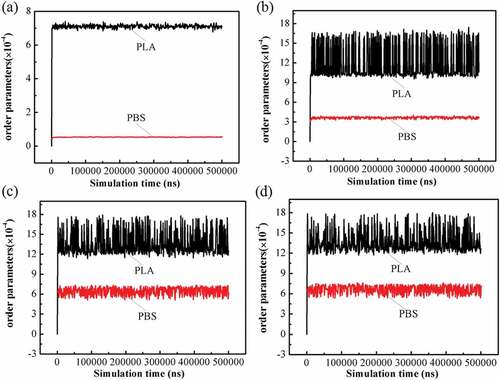
As shown in , the order parameter is given as a function of simulation time. The order parameter values of PLA are larger than that of PBS, which may be due to the different lengths of PLA and PBS chains. A PLA chain contains 36 repetitive units and a PBS chain contains 15 repetitive units. The longer the chain length, the greater the possibility of disorder. In general, all parameter values are extremely low, indicating the blends with different composition ratios are compatible. In ), although PLA parameters seem to fluctuate a little, the ordinate values are actually magnified 10,000 times. All the values are in the order of 10–4, far less than 0.1, which means that they are compatible [Citation24]. For the four blend systems, the order parameters increase sharply at the beginning and fluctuate in a narrow range after reaching the equilibrium state. As illustrated in ), the parameter value of PLA is around 7 × 10⁻⁴ while PBS is less than 1 × 10⁻⁴. However, in )()(), the parameter values of the PLA are close to each other, ranging from 10 × 10–4 to 18 × 10–4. The PBS value in the 8a2s blend is approximately 3 × 10⁻⁴, while the 7a3s and 6a4s blends are both around 6 × 10⁻⁴. shows that in 8a2s, 7a3s and 6a4s systems, the order parameters of PLA and PBS are higher than those of 9a1s system, which indicates that the compatibility of 9a1s system is better than other systems. This is consistent with the result of the radial distribution function. In addition, it was reported that the compatibility of 90/10 PLA/PBS blends was observed by scanning electron microscopy [Citation17].
Figure 9. Order parameter of different composition ratio blends (a) 9a1s; (b) 8a2s; (c) 7a3s; (d) 6a4s in mesoscopic dynamics simulation.
3.3.2 Iso-density surfaces
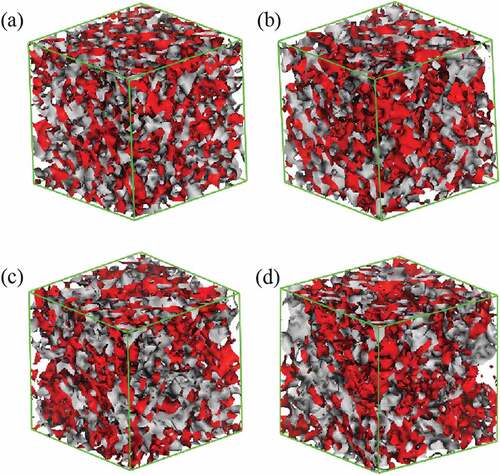
The iso-density surface morphologies of the blend were obtained by 2 × 10⁵-step mesodynamic simulation, as shown in . The system of 9a1s is taken as an example, the iso-density surfaces of various composition blends at 20 frame are shown in (the surface of PLA is red and PBS is gray). Apparently, all the systems are homogeneous, this suggests that the simulation time of mesoscopic dynamics is adequate. In addition, the homogeneous phases demonstrate that all the blends with different component ratios are compatible and this result is in good agreement with that of atomic molecular simulation. However, it seems that the simulation system does not change significantly over time, which may be due to the high speed of the blends reaching equilibrium. The system moves at a very fast speed, so no trace of inhomogeneous phase is caught. Hence, all the morphologies are in equilibrium ( and ).
Figure 10. Time evolution iso-density surfaces of 9a1s (a)1 frame, (b)5 frame, (c)15 frame, (d)25 frame.
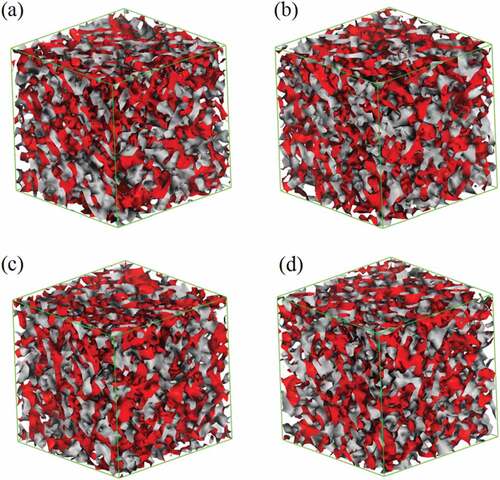
Figure 11. Iso-density surfaces of various composition blends at 20 frame (a) 9a1s; (b) 8a2s; (c) 7a3s; (d) 6a4s.
4. Conclusion
We employed molecular dynamics and mesoscopic dynamics to study the compatibility of the PLA/PBS blends with various composition ratios. The solubility parameter of PLA is in good agreement with the simulation and experimental results in previous studies, verifying the reliability of the systems. The results show that PLA/PBS blend systems are compatible at different composition ratios, the compatibility is attributed to the formation of hydrogen bonds and van der Waals bonds between elements of PLA chains and PBS chains. The hydrogen bond snapshots, the order parameters and the iso-density surfaces further validate the compatibility of PLA/PBS blends. Most noteworthy is that, as far as we know, this is the first study to investigate the compatibility of PLA/PBS blends from a molecular perspective, which is a controversial problem in experiments. We provide explanations of the underlying molecular interaction mechanisms that will help deepen the understanding of the relationship between PLA and PBS and may help design new biopolymers.
Acknowledgments
The authors gratefully acknowledge the financial supports provided by the National Natural Science Foundation of China (11672086). The authors also thank Professor Yuhang Jing, Dr. Bin Yuan and Chao Peng for their kind help.
Disclosure statement
No potential conflict of interest was reported by the authors.
Additional information
Funding
References
- Auras R, Harte B, Selke S. An overview of polylactides as packaging materials. Macromol Biosci. 2004;4:835–864.
- Wong YS, Salvekar AV, Zhuang KD, et al. Bioabsorbable radiopaque water-responsive shape memory embolization plug for temporary vascular occlusion. Biomaterials. 2016;102:98–106.
- S H L, Zhang Z, Feng SS. Nanoparticles of poly(lactide)-tocopheryl polyethylene glycol succinate (PLA-TPGS) copolymers for protein drug delivery. Biomaterials. 2007;28:2041–2050.
- Zhang Z, Huey LS, Feng SS. Folate-decorated poly(lactide-co-glycolide)-vitamin E TPGS nanoparticles for targeted drug delivery. Biomaterials. 2007;28:1889–1899.
- Hurtado A, Moon LDF, Maquet V, et al. Poly (d,l-lactic acid) macroporous guidance scaffolds seeded with Schwann cells genetically modified to secrete a bi-functional neurotrophin implanted in the completely transected adult rat thoracic spinal cord. Biomaterials. 2006;27:430–442.
- Salem AK, Rose FRAJ, Oreffo ROC, et al. Porous polymer and cell composites that self‐assemble in situ. Adv Mater. 2003;15:210–213.
- Antonov EN, Bagratashvili VN, Whitaker MJ, et al. Three-dimensional bioactive and biodegradable scaffolds fabricated by surface-selective laser sintering. Adv Mater. 2004;17:327–330.
- Chen R, Curran SJ, Curran JM, et al. The use of poly(l-lactide) and RGD modified microspheres as cell carriers in a flow intermittency bioreactor for tissue engineering cartilage. Biomaterials. 2006;27:4453–4460.
- Leiggener CS, Curtis R, Muller AA, et al. Influence of copolymer composition of polylactide implants on cranial bone regeneration. Biomaterials. 2006;27:202–207.
- Böstman O, Pihlajamäki H. Clinical biocompatibility of biodegradable orthopaedic implants for internal fixation: a review. Biomaterials. 2000;21:2615–2621.
- Liu H, Zhang J. Research progress in toughening modification of poly(lactic acid). J Polym Sci B Polym Phys. 2011;49:1051–1083.
- Fujimaki T. Processability and properties of aliphatic polyesters, ‘BIONOLLE’, synthesized by polycondensation reaction. Polym Degrad Stabil. 1998;59:209–214.
- Bhatia A, Gupta RK, Bhaftacharya SN, et al. Compatibility of biodegradable poly (lactic acid) (PLA) and poly (butylene succinate) (PBS) blends for packaging application. Korea-Aust Rheol J. 2007;19:125–131.
- Wu D, Yuan L, Laredo E, et al. Interfacial properties, viscoelasticity, and thermal behaviors of poly(butylene succinate)/polylactide blend. Ind Eng Chem Res. 2012;51:2290–2298.
- Park JW, Im SS. Phase behavior and morphology in blends of poly(L-lactic acid) and poly(butylene succinate). J Appl Polym Sci. 2002;86:647–655.
- Deng Y, Thomas NL. Blending poly(butylene succinate) with poly(lactic acid): ductility and phase inversion effects. Eur Polym J. 2015;71:534–546.
- Jompang L, Thumsorn S, J W O, et al. Poly(Lactic Acid) and poly(Butylene Succinate) blend fibers prepared by melt spinning technique. Energy Procedia. 2013;34:493–499.
- Wei Q, Wang Y, Che Y, et al. Molecular mechanisms in compatibility and mechanical properties of polyacrylamide/polyvinyl alcohol blends. J Mech Behav Biomed. 2017;65:565–573.
- Zhang M, Choi P, Sundararaj U. Molecular dynamics and thermal analysis study of anomalous thermodynamic behavior of poly (ether imide)/polycarbonate blends. Polymer. 2003;44:1979–1986.
- Martinez de Arenaza I, Meaurio E, Coto B, et al. Molecular dynamics modelling for the analysis and prediction of miscibility in polylactide/polyvinilphenol blends. Polymer. 2010;51:4431–4438.
- Fu Y, Liao L, Yang L, et al. Molecular dynamics and dissipative particle dynamics simulations for prediction of miscibility in polyethylene terephthalate/polylactide blends. Mol Simulat. 2013;39:415–422.
- Eslami M, Nikkhah SJ, Hashemianzadeh SM, et al. The compatibility of Tacrine molecule with poly(n-butylcyanoacrylate) and Chitosan as efficient carriers for drug delivery: a molecular dynamics study. Eur J Pharm Sci. 2016;82:79–85.
- Gupta J, Nunes C, Vyas S, et al. Prediction of solubility parameters and miscibility of pharmaceutical compounds by molecular dynamics simulations. J Phys Chem B. 2011;115:2014–2023.
- Jawalkar SS, Adoor SG, Sairam M, et al. Molecular modeling on the binary blend compatibility of poly(vinyl alcohol) and poly(methyl methacrylate): an atomistic simulation and thermodynamic approach. J Phys Chem A. 2005;109:15611–15620.
- Jawalkar SS, Aminabhavi TM. Molecular modeling simulations and thermodynamic approaches to investigate compatibility/incompatibility of poly(l-lactide) and poly(vinyl alcohol) blends. Polymer. 2006;47:8061–8071.
- Yin Q, Luo J, Zhou G, et al. A molecular simulation of the compatibility of chitosan and poly(vinyl pyrrolidone). Mol Simulat. 2010;36:186–191.
- Takhulee A, Takahashi Y, Vao-soongnern V. Molecular simulation and experimental studies of the miscibility of polylactic acid/polyethylene glycol blends. J Polym Res. 2016;24:8.
- Sun H. COMPASS: an ab initio force-field optimized for condensed-phase applicationsoverview with details on alkane and benzene compounds. J Phys Chem A. 1998;102:7338–7364.
- Theodorou DN, Suter UW. Detailed molecular structure of a vinyl polymer glass. Macromolecules. 1985;18:1467–1478.
- Tsuji H, Sumida K. Poly(L-lactide): V. Effects of storage in swelling solvents on physical properties and structure of poly(L-lactide). J Appl Polym Sci. 2001;79:1582–1589.
- Spyriouni T, Vergelati C. A molecular modeling study of binary blend compatibility of polyamide 6 and poly(vinyl acetate) with different degrees of hydrolysis: an atomistic and mesoscopic approach. Macromolecules. 2001;34:5306–5316.