
 ?Mathematical formulae have been encoded as MathML and are displayed in this HTML version using MathJax in order to improve their display. Uncheck the box to turn MathJax off. This feature requires Javascript. Click on a formula to zoom.
ABSTRACT
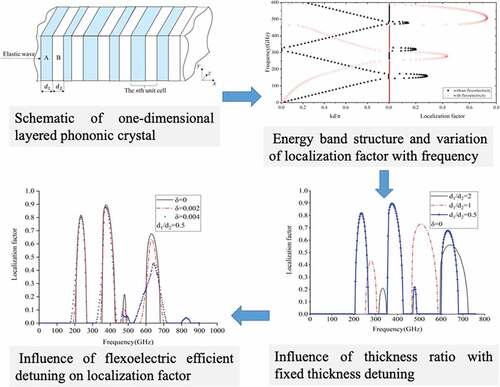
Although forbidden band effect in perfectly periodic phononic crystals (PC) is very attractive, random disordered (i.e. detuning) phenomenon is inevitable in engineering processing, thus exploring the effect of detuning on the wave characteristics of PC becomes a necessity. In this study, fundamental governing equations and boundary conditions are derived from the principle of virtual work. Wave characteristics and localization factor of one-dimensional (1D) detuned nano-PC are investigated based on the transfer matrix method, with flexoelectric effect duly accounted for. Subsequently, with nano-PC taken for illustration, forbidden band properties and localization factor of 1D elastic waves in harmonic and detuned states are systematically characterized. It is demonstrated that localization factor can characterize the energy band structure of 1D PC perfectly. Flexoelectric effect tends to widen the width of forbidden band with increasing detuning, and detuning is linearly related to the bandwidth. The forbidden band is more sensitive to flexoelectric coefficient detuning than thickness detuning. The research results provide useful theoretical guidance for designing high-frequency nanoscaled devices with the function of filtering based on band gap effect of nano-PC.
Graphical abstract
1. Introduction
The flexoelectric effect belongs to electromechanical coupling, but it is not a simple higher-order extension of the piezoelectric effect. The piezoelectric effect acts only in non-centrosymmetric materials, while the flexoelectric effect exists in all dielectric materials. Flexoelectricity is a symmetry independent electromechanical coupling phenomenon that outperforms piezoelectricity at micro and nanoscales, due mainly to its size-dependent behavior arising from gradient terms in its constitutive relations [Citation1].
The flexoelectric effect describes the coupling between strain gradients and electrical polarization. A multitude of investigations has been carried out to understand the phenomenon and explore its underlying physical mechanisms. Ever since a phenomenological framework [Citation2] was proposed to characterize the flexoelectric effect, theoretical research on flexoelectric effect has developed rapidly. For example, the microscopic mechanism of flexoelectric effect was proposed to explain the polarization signals resulting from shock loading a nonpiezoelectric material [Citation3]. A polarization gradient was added to the conventional elastic dielectric energy function to establish a theory to characterize the flexoelectric effect [Citation4]; nonetheless, as the effect of strain gradient was not taken into account, the theory was not perfect and could only partially explain the experiment phenomenon. With the rapid development of flexoelectric theories, the flexoelectric coefficient of cubic ion crystal has been continuously calculated [Citation5]. Indenbom et al. [Citation6] put forward the Landau theory of flexoelectric effect, dividing formally the flexoelectric effect and the nonlocal piezoelectric effect [Citation7]. More recently, Maranganti et al. [Citation8] developed a mathematical framework containing strain gradient and polarization coupling, proposed Green’s function solution of the governing equation, and solved the inclusion problem, while Shen et al. [Citation9,Citation10] established the dielectric variational principle by considering flexoelectric effect, surface effect, and electrostatic force and derived the corresponding governing equations and boundary conditions: the proposed theory can not only solve complex static electromechanical coupling problems in nanodielectrics but also analyze dynamic problems such as elastic wave propagation when kinetic energy is introduced into the dielectric variational principle. In general, a large number of studies have been carried out on the structures related to piezoelectric materials, including nonlinearity and nanosize [Citation11]. However, the research on flexoelectricity is just beginning.
Wave propagation in phononic crystals (PC) has become another hot topic, for the emergence of band gap characteristics provides new ideas for energy control, leading to many important discoveries. The essence of studying PC is to investigate the propagation of elastic waves in periodic materials or structures. In fact, systematic studies on the propagation characteristics of waves in periodic materials [Citation12] have been carried out long ago, but it was not until 1995 that the existence of elastic wave band gaps was firstly determined from the perspective of experiments [Citation13]. Before 2000, the study of PC was limited to Bragg scattering principle, which requires that the lattice constant and band gap frequency should be in the same order of magnitude [Citation14,Citation15]. Afterward, a new PC structure with local resonant property was creatively proposed [Citation16]. The lattice constant of this crystal is 2 orders of magnitude smaller than the wavelength corresponding to the band gap, which marks another major breakthrough in the study of PC. Currently, PC with increasingly smaller sizes is used to design complete acoustic band gap at high frequencies, thus providing a vibration-free environment for high-precision mechanical systems [Citation15]. In addition, the propagation and resonance of horizontal shear waves in layered PC with strip cracks were studied [Citation17], and the results reveal wave resonance and localization in band gap. Experiment measurements [Citation18] were also made on the complete surface acoustic band gap of a two-dimensional piezoelectric PC. It was found that the frequency range of complete band gap was exactly the same as that predicted by theory. Nanomaterials with various dimensionalities (e.g. nanowires, nanofilms, two-dimensional materials, and three-dimensional nanostructures) have shown great potential in recent development of flexible electronics [Citation19] and PC. However, most of existing studies were carried out by assuming perfect periodic PC at macroscopic scale, without no consideration of nanoscale as well as the detuning effect.
In general, the study of PC at nanoscale with flexoelectric effect considered is relatively lacking. Liu et al. [Citation20] studied the dispersion relation of one-dimensional (1D) PC considering flexoelectric effect by using the transfer matrix method, while Yang et al. [Citation21–23] developed theoretical models to analyze elastic waves in nanolayer PC, love waves in piezoelectric nanocomposites, and Lamb waves in infinite nanoplates. Further, Eliseev et al. [Citation24] proved that shear horizontal waves can propagate near the smooth surface of nonpiezoelectric crystals by considering the flexoelectric effect, whereas Hu et al. [Citation25] explored the propagation characteristics of bulk wave in elastic media when flexoelectric effect, micro-inertia effect, and strain gradient elasticity were considered simultaneously. In addition, the study of wave propagation in complex conditions and structures also has a lot of reference value. The wave propagation of functionally graded ceramic-metal plates [Citation26], sandwich plate [Citation27], and sandwich structure with a soft core and multi-hybrid nano-composite face sheets [Citation28] have been studied in depth. However, as these theoretical studies are all based on the premise that the PC has perfect periodic nanostructure, the effect of detuning on wave propagation in nano-PC with flexoelectric effect considered remains elusive. In practice, the detuning phenomenon is inevitable during the processing of periodic structures. Moreover, the band structure of PC can be adjusted by deliberately introducing the detuning, which in turn controls the propagation behavior of elastic waves. It is therefore particularly important to study the wave propagation properties of detuned flexoelectric nano-PC so that theoretical guidance for practical processing can be obtained.
This paper focused on studying theoretically the propagation properties of elastic waves in harmonic and detuned nano-PC with idealized 1D layered structures. The flexoelectric theory is employed to establish the governing equation of wave propagation, with the effects of strain gradient and polarization gradient accounted for. The transfer matrix method and the Bloch theory are subsequently used to calculate the localization factor in the detuning state, which is then used to characterize the band structure and localization phenomenon of the detuned 1D PC. The influence of layer thickness detuning and flexoelectric coefficient detuning on energy band structure is quantified, and the underlying physical mechanisms are explored.
2. Problem statement
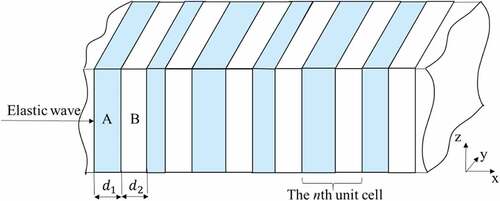
To study the wave characteristics of flexoelectric PC in detuning state, an idealized layered PC is selected for theoretical analysis, as shown in . The 1D PC consisted of alternating sublayers A and B that are made of different materials, with layer thicknesses and
, respectively. Its unit cell has thence a thickness of
, i.e. the periodic thickness of the PC. In the present study, the thickness
of sublayer A is not fixed but varied for random detuning.
Figure 1. Schematic of 1D layered PC.
To introduce the effect of flexoelectricity, a constructive and effective approach is extending the linear piezoelectric theory. For non-centrosymmetric dielectrics, the bulk internal energy density function relating to polarization , polarization gradient
, small strain
, and strain gradient
can be written as [Citation10]:
Here, strain , (
) are the material property tensors,
represents the second-order dielectric tensor,
is a high order dielectric constant, characterizing the coupling between the electric polarization gradients,
is the fourth-order elastic tensor,
is the third-order piezoelectric tensor, and
was introduced by Mindlin [Citation29] in his theory of polarization gradient to link the gradients of polarization to strains, while the tensor
is related to strain gradient polarization coupling, its components commonly referred to as the flexoelectric coefficients [Citation20,Citation30].
To highlight the flexoelectric effect and neglect the influence of piezoelectric effect, it is assumed herein that all the subjects of the current study belong to central symmetric dielectrics, i.e. (i.e. the third-order piezoelectric tensor
is null in dielectrics with inversion symmetry). The bulk internal energy density function can thence be written as [Citation10]:
Under the assumption of infinitesimal deformation, the constitutive equation can be expressed as:
where is the stress tensor in classical elasticity,
is the higher-order stress (couple stress) tensor,
is the effective local electric field, and
is the higher-order local electric field. Note that
and
.
To incorporate the micro-inertia effect into mathematical model, the following expression for the kinetic energy density is considered as [Citation31,Citation32]:
where is the mass density,
is defined as the micro-inertia characteristic length (the scaling parameter for dynamics), and the dot over the vector component
refers to time derivative.
Governing equations and boundary conditions are derived from the virtual work principle, which has the following form:
where is the variational notation,
is the volume occupied by the dielectric material.
Applying the virtual work principle leads to the following governing Equationequations [20](20)
(20) :
where represents the dielectric constant in vacuum,
represents the external force, and
is the potential of Maxwell self-field defined as:
Since appears in the force balance relation, it can be understood as a “physical stress” [Citation8,Citation33], namely:
Upon substituting the constitutive Equationequations (3)–(3)
(3) (Equation6
(6)
(6) ) into the governing Equationequations (9)–
(9)
(9) (Equation11
(11)
(11) ). For 1D PC, the elastic field and electric fields vary only in the
-direction when a longitudinal wave is incident vertically, so that the inhomogeneous equations considering flexoelectric effect can be obtained as:
Since both tensor and tensor
always appear in pairs, we define
(i.e.
) instead of (
) for conciseness [Citation8]. Neglect the influence of external force, so that EquationEqs. (14)–
(14)
(14) (Equation16
(16)
(16) ) can be reduced to inhomogeneous equations, as:
(17)
Under the condition of open circuit that , EquationEq. (19)
(19)
(19) is satisfied. Then, the governing equations are
Where .
Assume that the vertical incident longitudinal wave is steady-state harmonic, i.e. its displacement and potential vary with time harmonically. The solution to the above system of Equationequations (20)(20)
(20) Equationand (21)
(21)
(21) can thence be expressed as:
where . To facilitate the calculation, the dimensionless coordinate,
, is introduced, where
represents the average thickness of the first sublayer. The wave Equationequations (20)
(20)
(20) Equationand (21)
(21)
(21) can thence be rewritten as:
Detailed derivation process of EquationEqs. (24)(24)
(24) and (Equation25
(25)
(25) ) is presented in the Appendix.
Eventually, the solution can be deduced by substituting EquationEqs. (22)(22)
(22) Equationand (23)
(23)
(23) into EquationEqs. (24)
(24)
(24) Equationand (25
(25)
(25) ), as:
Here, ,
,
, and
are undetermined coefficients,
and
represent the first and second sublayer, respectively, and
and
are given by:
3. Transfer matrix method
The transfer matrix method is efficient in dealing with dynamic problems of 1D structure. In the present study, the transfer matrix between adjacent cells in the 1D PC can be derived from the continuity of mechanical and electrical boundary conditions. Specifically, in accordance with the definition in Ref [Citation8,Citation20], the physical stress and electric tensors
can be expressed, respectively, as:
For the 1D case of , according to the derivation of the transfer matrix in Ref [Citation34], the state vector is given by:
It follows that the matrix equations at the left and right sides of the first sublayer in the unit cell are:
where the subscripts and
represent the left and right sides of the sublayer, respectively. Similarly, the matrix equations at the left and right sides of the second sublayer in the
unit cell are:
Continuity at the interface between adjacent sublayers dictates that:
(37)
From EquationEqs. (32)(32)
(32) –(37), the relationship between the left and right sides of the
unit cell is obtained as:
It follows thence that the continuity condition between the right side of the unit cell and the left side of the
unit cell is:
(39)
The relationship between the and
unit cells is further derived as:
Therefore, is the transfer matrix between two connected unit cells in the PC. Due to the transferability of the structure,
remains unchanged for any
when detuning is not considered and hence can be expressed as T. In other words, T can be viewed as the transfer matrix of the periodic PC, which is a function of sublayer thickness and frequency.
The problem of elastic wave propagation in a periodic system such as the one depicted in can be simplified to an eigenvalue problem by using the Bloch theory, as [Citation35]:
where is a
unit matrix,
is the Bloch wave number, and
is the thickness of the unit cell. By calculating the frequency
corresponding to all wavenumbers
in the irreducible Brillouin zone, the dispersion curve of the 1D flexoelectric PC can be obtained.
4. Prediction of localization factor
Localization factor is an important concept introduced to describe vibration localization in near-periodic structures [Citation36]. It describes the average exponential decay of fluctuation amplitude when an elastic wave propagates in a detuning periodic structure and can be used to characterize the influence of localization phenomenon on structural vibration and strength.
To calculate the localization factor, two approaches are commonly adopted: one is the Lyapunov method [Citation37] and the other is the matrix eigenvalue method [Citation38]. By contrast, the calculation with the method of matrix eigenvalue is fairly intuitive, while the calculation process of the Lyapunov method is more complex and cumbersome. For simplicity, the matrix eigenvalue method is employed in the present study.
With 1D detuned PC is assumed, the random variables can be chosen in a range of options, such as sublayer thickness detuning, elastic modulus detuning, density detuning, flexoelectric coefficient detuning, and so on. For the convenience of analysis, the random variable of the unit cell is noted as:
where q represents the number of random variables. According to the derivation of the transfer matrix above, the relationship between the and the
state vectors can be written as:
where is the transfer matrix, which is related to the random variable
. For a randomly detuned PC, the localization factor is an important characterization parameter that can be calculated from the eigenvalues of the transfer matrix, as:
where is the
eigenvalue of the transfer matrix
of the
unit cell. There exist multiple eigenvalues of the transfer matrix. By definition, the minimum positive
is selected as the localization factor [Citation39]. Since
is the random variable in a unit cell, it varies from one unit cell to another. If finite numbers of unit cells
are selected, the calculated localization factor is also random and determined by the value of
. When
, the localization factor converges to a certain value. Therefore, a large number of unit cells are often needed to ensure the convergence of the localization factor. The present calculation shows that when
is greater than 5000, the localization factor converges, and the localization factor corresponding to each frequency remains a fixed value. With random parameter given for each cell sample, an approximate localization factor can be obtained, namely:
5. Results and discussion
Although the flexoelectric effect can exist in crystals with arbitrary symmetry, it is more attractive in crystals that exhibit centrosymmetry in the absence of piezoelectric properties. In other words, the force-electric coupling phenomenon can be solely attributed to the flexoelectric effect in centrosymmetric crystals. Therefore, in this section, two typical centrosymmetric dielectric materials, (cubic phase) and
, are selected for subsequent calculations in order to illustrate the influence of flexoelectricity on the structure of energy band. Specific material and geometrical features [Citation20,Citation40] are summarized in .
Table 1. Material and geometry properties of 1D PC.
It is worth noting that the value of micro-inertia characteristic length is set to the lattice constant according to the literature [Citation41]. The lattice constant of
in the cubic phase and
is 0.39 nm.
When considering the first sublayer thickness detuning, it is assumed that obeys a uniform distribution with mean
and detuning degree (coefficient of variation)
. The range for the values of
can be shown as:
Further, let represent a random variable that is subjected to a standard uniform distribution, i.e.
. Then,
can be compactly expressed as:
To facilitate the calculation, the thickness of the two sublayers in the unit cell can be nondimensionalized by . With random detuning considered, let
and
represent essentially the dimensionless widths of sublayers A and B.
means that only the detuning of sublayer A is discussed, and the width of sublayer B remains fixed. It is obvious that the detuned PC will turn into a classical harmonic PC if
. In the following, the influence of flexoelectric effect and parameters detuning (such as thickness, flexoelectric coefficient) on band gap and localization factors are analyzed and discussed.
5.1 Harmonic PC with and without flexoelectric effect
First, to explore the influence of flexoelectric effect, shows the energy band structure of bilayer PC and the corresponding localization factor, with the thickness of both sublayers taken as 0.8 nm. Specifically, as shown in , the red and black scatter points represent the energy band results with flexoelectricity and without flexoelectricity, respectively. The red line represents the energy band result with flexoelectricity and micro-inertia effect. The detailed formulas of the transfer matrix are summarized in the Appendix. It is seen from that the band gap starts and ends at 0 or π, which belongs to a typical Bragg-type band gap. In the presence of flexoelectricity, the band gap curve is no longer straight, representing a significant dispersion phenomenon of wave. Besides, it is interesting to note that, with flexoelectricity effect considered, the band gap becomes higher and broader. In other words, flexoelectricity increases the center frequency and width of the first band gap compared to the classical elastic results. By the way, note that the slope of the dispersion curve corresponds to the phonon group velocity, which affects the heat transport characteristics of nanoscale materials. Therefore, the present results show that flexoelectricity leads to larger phonon group velocity and hence larger thermal conductivity [Citation42]. Besides, the micro-inertial effect has little effect on the energy band structure of our PC model that already considers flexoelectricity, so we follow the approach in the literature [Citation20,Citation21] and ignore the micro-inertial effect in the following discussions.
Figure 2. Energy band structure and variation of localization factor with frequency ( nm).
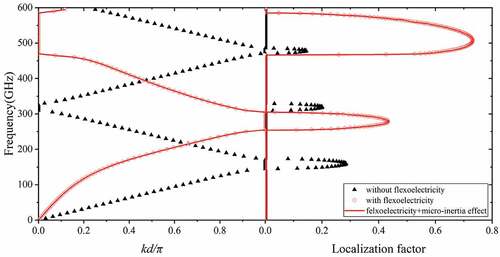
As shown in , it is clear that the frequency range of the band gap coincides with that of the nonzero localization factor. In fact, the localization factor is another effective parameter that can well characterize the energy band structure in 1D harmonic PC [Citation39]. According to the definition of localization factor, when it is nonzero, the propagation of an elastic wave is attenuated and the attenuation coefficient is . Instead, when the localization factor is zero, the elastic wave can pass smoothly through the multilayer medium, which corresponds to the passband in the energy band structure. Besides, in the presence of flexoelectric effect, the localization factor is remarkably larger than that in the purely elastic state, as shown in , which means that flexoelectric effect can increase the attenuation rate of elastic waves.
In conclusion, flexoelectric effect influences significantly the band gaps of nanoscale PC, and it is necessary to consider the influence of flexoelectricity. Localization factor is an effective parameter to characterize the band structure of 1D harmonic PC.
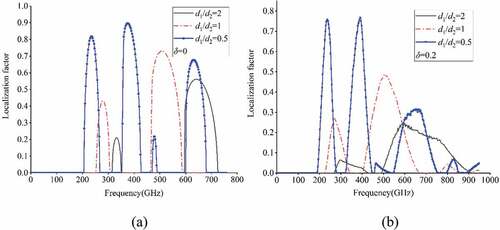
5.2 Influence of thickness detuning with fixed thickness ratios
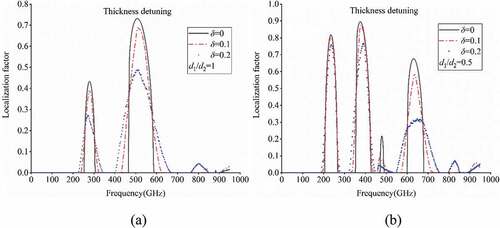
The primary aim of the present study is to study wave localization in a detuning PC using the localization factor when flexoelectric effect is considered, since flexoelectric effect cannot be ignored as discussed above. For this purpose, the material thickness ratio of 1D PC is reduced from 1 to 0.5 to study the influence of different detuning degrees (i.e. 0.1 and 0.2), as shown in . For reference, the corresponding variation curve of localization factor of a harmonic PC (i.e.
) is also presented. At first glance, it is seen that the peak of localization factor decreases significantly as the detuning degree is increased. Besides, it is interesting to note that, as the detuning degree
is increased, the band gap of the PC exhibits a widening trend, i.e. the detuning degree can widen the band gap. As for different thickness ratios, the influence law of detuning degree is similar. In the next section, the influence of thickness ratio will be discussed in detail.
Figure 3. Variation curve of localization factor with thickness detuning: (a) thickness ratio ; (b) thickness ratio
.
In addition to localization factor and energy band, we further analyze the relationship between bandwidth and detuning degree. As shown in , it is found that the first and second bandwidths show a clear increasing trend with the increase of detuning. Specifically, the bandwidth of the first band gap is increased from 51.5 GHz to 136.5 GHz, and the bandwidth of the second band gap is increased from 119.5 GHz to 306.5 GHz. It is interesting to note that the trend exhibits a positive linear correlation, i.e. there is a clear regularity in the increase of forbidden bandwidth with the change of detuning degree, which is important for designing instruments with specific bandwidths. According to the above rules, one can change the degree of detuning to modulate a PC with forbidden band to meet specific needs. By the way, the results of also show that the bandwidth of the second band gap is significantly larger than that of the first band gap.
Figure 4. Variation of bandwidth with detuning degree for PC with
.
Physically, detuning implies a disorder in the structural parameters (dimensions or materials, etc.) of the original perfectly periodic PC. The disorder leads to partial reflections of the wave at each bay, which can occur even at the passband frequencies of the corresponding periodic system [Citation43]. Such multiple reflections lead, on the one hand, to a failure of the wave to travel smoothly downstream, thus showing an increase in forbidden band bandwidth with increasing detuning in the bandwidth diagram. On the other hand, the multiple reflections lead to a phenomenon where the energy is actually concentrated in a certain part of the structure, which is also commonly referred to as localization [Citation44]. In other words, the increase of the forbidden band width and the localization of energy are two macroscopic phenomena caused by detuning, and the mechanism behind them is actually the same.
5.3 Influence of thickness ratio with fixed thickness detuning
In this section, the thickness ratio of 1D PC is varied from 0.5 via 1 to 2 when the thickness detuning is either fixed at 0 or 0.2. As shown in , when the thickness detuning is fixed, decreasing the thickness ratio enables the beginning and end of the forbidden band to shift toward lower frequencies. This means that, with the thickness detuning fixed, 1D PC with relatively low-frequency forbidden band can be obtained by decreasing its thickness ratio. Besides, it is interesting to note that as the thickness ratio is decreased, the localization factor in the forbidden band zone tends to increase, and the localization phenomenon becomes more pronounced.
Figure 5. Variation curve of localization factor with thickness ratio: (a) thickness detuning degree ; (b) thickness detuning degree
.
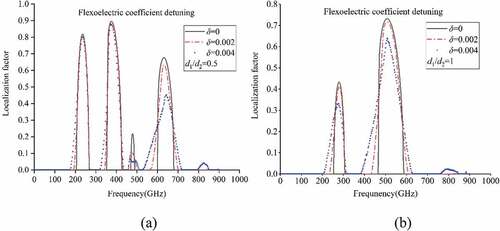
5.4 Influence of flexoelectric coefficient detuning with fixed thickness ratio
The influence of flexoelectric efficient detuning is discussed when fixing the thickness ratio at 0.5, 1, and 2. Specifically, three detuning degrees (i.e. 0, 0.002, and 0.004) are selected, with the case of harmonic PC taken as reference. As shown in , the localization factor decreases with increasing detuning of the flexoelectric coefficient. Upon comparing with , it is seen that the effect of flexoelectric coefficient detuning on localization factor is similar to that of thickness-induced detuning within the entire frequency range considered. From a specific value of detuning, a very slight (about 0.001) fluctuation of the flexoelectric coefficient can lead to the localization phenomenon, implying that the sensitivity of flexoelectric effect to localization is much higher than that of the thickness parameter. This once again demonstrates that flexoelectric effect is important for dynamic analysis and cannot be ignored in nanoscale structures.
Figure 6. Influence of flexoelectric coefficient detuning on localization factor versus frequency curve with the thickness ratio fixed at (a) and (b)
.
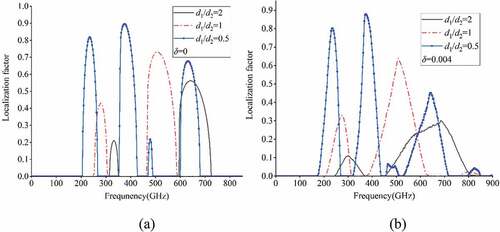
5.5 Influence of thickness ratio with fixed flexoelectric coefficient detuning
Finally, the influence of thickness ratio on localization is studied by fixing the flexoelectric coefficient detuning at either 0 or 0.004. Three thickness ratios (i.e. 0.5, 1, and 2) are selected, and the results are displayed in . Generally, when the detuning degree is fixed, the localization phenomenon due to flexoelectric efficient detuning is similar to that due to thickness detuning shown in . In particular, decreasing the thickness ratio shifts the beginning and end of the forbidden band to lower frequencies. In other words, for 1D PC with given flexoelectric detuning, one can obtain PC with relatively low-frequency forbidden band by decreasing the thickness ratio. Besides, it is noted that as the thickness ratio is decreased, the localization factor in the forbidden band is also increased and the localization phenomenon will be more obvious.
Figure 7. Effect of thickness ratio on localization factor versus frequency curve with flexoelectric efficient detuning degree fixed at (a) and (b)
.
6. Conclusions
The variation of energy band structure of 1D harmonic and detuned PC has been analytically investigated, with flexoelectric effect accounted for. Generally, the calculated results show that detuning under flexoelectric effect affects significantly the band structure of the PC. First, the localization factor indeed reflects the energy attenuation rate and can effectively represent the band structure, including both the pass band and the forbidden band. Second, increasingly either the thickness detuning or flexoelectric coefficient detuning leads to linearly widened band gap, and the second band gap width increases faster than the first band gap. In addition, the sensitivity of flexoelectric coefficient detuning is much higher than that of thickness detuning. The present results provide a theoretical basis for designing high-frequency nanoscaled devices with the function of filtering based on band gap effect in PC.
Acknowledgments
This work is supported by the National Natural Science Foundation of China (11502110, 11972185, and 12002156), the Open Fund of the State Key Laboratory for Strength and Vibration of Mechanical Structures, Xi’an Jiaotong University (No. SV2018-KF-01, No. SV2018-KF-22), and the Open Project of Space Structure and Mechanism Technology Laboratory of China Aerospace Science and Technology Group Co., Ltd.
Disclosure statement
No potential conflict of interest was reported by the author(s).
Additional information
Funding
References
- Sharma S, Kumar R, Vaish R. Universal converse flexoelectricity in dielectric materials via varying electric field direction. Int J Smart Nano Mater. 2021;12(1):107–128.
- Kogan SM. Piezoelectric effect during inhomogeneous deformation and acoustic scattering of carriers in crystals. Soviet Physics-Solid State. 1964;5(10):2069–2070.
- Harris P. Mechanism for the shock polarization of dielectrics. J Appl Phys. 1965;36(3):739–741.
- Mindlin RD, Gazis DC. Polarization gradient in elastic dielectrics. Int J Solids Struct. 1968;4(6):637–642.
- Askar A, Lee PCY, Cakmak AS. Lattice-dynamics approach to the theory of elastic dielectrics with polarization gradient. Phys Rev B. 1970;1(8):3525–3537.
- Indenbom VL, Loginov EB, Osipov MA. The flexoelectric effect and the structure of crystals. Soviet Physics-Crystallography. 1981;26(6):656–658.
- Bursian EV, Trunov NN. Nonlocal piezoelectric effect. Soviet Physics-Solid State. 1974;16(4):760–762.
- Maranganti R, Sharma ND, Sharma P. Electromechanical coupling in nonpiezoelectric materials due to nanoscale nonlocal size effects: green’s function solutions and embedded inclusions. Phys Rev B. 2006;74(1):14110.
- Hu SL, Shen SP. Electric field gradient theory with surface effect for nano-dielectrics. CMC-Computers, Materials & Continua. 2009;13(1):63–87.
- Shen SP, Hu SL. A theory of flexoelectricity with surface effect for elastic dielectrics. J Mech Phys Solids. 2010;58(5):665–677.
- Al-Furjan MSH, Safarpour H, Habibi M, et al. A comprehensive computational approach for nonlinear thermal instability of the electrically FG-GPLRC disk based on GDQ method. Eng. Comput.-Germany. 2022;38(1):801–818
- Brillouin L. Wave propagation in periodic structures: electric filters and crystal lattices. Nature. 1946;158(4026):926.
- Martinez-Sale R, Sancho J, Sánchez J, et al. Sound-attenuation by sculpture. Nature. 1995;6554(378):241.
- Sigalas MM, Economou EN. Elastic and acoustic wave band structure. J Sound Vib. 1992;158(2):377–382.
- Kushwaha M, Halevi P, Dobrzynski L, et al. Acoustic band structure of periodic elastic composites. Phys Rev Lett. 1993;71(13):2022–2025.
- Liu ZY, Zhang XX, Mao YW. Locally resonant sonic materials. Science. 2000;289(5485):1734–1736.
- Golub MV, Zhang CZ, Wang YS. SH-wave propagation and resonance phenomena in a periodically layered composite structure with a crack. J Sound Vib. 2011;330(13):3141–3154.
- Benchabane S, Khelif A, Rauch JY, et al. Evidence for complete surface wave band gap in a piezoelectric phononic crystal. Phys Rev E. 2006;73(6):65601.
- Hong T, Shen T, Yang J, et al. Sugar transfer of nanomaterials and flexible electrodes. Int J Smart Nano Mater. 2020;11(1):1–10.
- Liu CC, Hu SL, Shen SP. Effect of Flexoelectricity on Band Structures of One-Dimensional Phononic Crystals. J Appl Mech. 2014;81(5):51007.
- Yang WJ, Hu TT, Liang X. On band structures of layered phononic crystals with flexoelectricity. Arch Appl Mech. 2018;88(1):629–644
- Yang WJ, Liang X, Shen SP. Love waves in layered flexoelectric structures. Philos Mag. 2017;97(33):3186–3209.
- Yang WJ, Deng Q, Liang X. Lamb wave propagation with flexoelectricity and strain gradient elasticity considered. Smart Mater Struct. 2018;27(8):85003.
- Eliseev EA, Morozovska AN, Glinchuk MD, et al. Lost surface waves in nonpiezoelectric solids. Phys Rev B. 2017;96(4):45411.
- Hu TT, Yang WJ, Liang X, et al. Wave propagation in flexoelectric microstructured solids. J Elasticity. 2018;130(2):197–210
- Tahir SI, Tounsi A, Chikh A, et al. An integral four-variable hyperbolic HSDT for the wave propagation investigation of a ceramic-metal FGM plate with various porosity distributions resting on a viscoelastic foundation. Wave Random Complex. 2021:1–24. 10.1080/17455030.2021.1942310.
- Tahir SI, Chikh A, Tounsi A, et al. Wave propagation analysis of a ceramic-metal functionally graded sandwich plate with different porosity distributions in a hygro-thermal environment. Compos Struct. 2021;269:114030.
- Al-Furjan MSH, Habibi M, Jung DW, et al. A computational framework for propagated waves in a sandwich doubly curved nanocomposite panel. Eng Comput. 2022; 38: 1679–1696.
- Mindlin RD. Polarization gradient in elastic dielectrics. Int J Solids Struct. 1968;4(6):637–642.
- Sharma ND, Landis CM, Sharma P. Piezoelectric thin-film superlattices without using piezoelectric materials. J Appl Phys. 2010;108(2):24304.
- Hrytsyna O, Sladek J, Sladek V. The effect of micro-inertia and flexoelectricity on love wave propagation in layered piezoelectric structures. Nanomaterials. 2021;11(9):2270.
- Sladek J, Sladek V, Repka M, et al. Flexoelectric effect in dielectrics under a dynamic load. Compos Struct. 2021;260:113528.
- Sharma ND, Landis C, Sharma P. Erratum: piezoelectric thin-film super-lattices without using piezoelectric materials. J Appl Phys. 2012;111(5):59901.
- Camley RE, Djafari-Rouhani B, Dobrzynski L. Transverse elastic waves in periodically layered infinite and semi-infinite media. Physical Review B. 1983;27(12):7318–7329.
- Chen AL, Wang YS. Size-effect on band structures of nanoscale phononic crystals. Phys E Low Dimens Syst Nanostruct. 2011;44(1):317–321.
- Castanier MP, Pierre C. Predicting localization via lyapunov exponent statistics. J Sound Vib. 1997;203(1):151–157.
- Li FM, Wang YS. Study on wave localization in disordered periodic layered piezoelectric composite structures. Int J Solids Struct. 2005;42(24–25):6457–6474.
- Li FM, Wang YS, Chen AL. Wave localization in randomly disordered periodic piezoelectric rods. Acta Mech Solida Sin. 2006;19(1):50–57
- Li FM, Xu MQ, Wang YS. Frequency-dependent localization length of SH-wave in randomly disordered piezoelectric phononic crystals. Solid State Commun. 2007;141(5):296–301.
- Yang W, Hu T, Liang X, et al. On band structures of layered phononic crystals with flexoelectricity. Arch Appl Mech. 2018;88(5):629–644.
- Yang W, Liang X, Deng Q, et al. Rayleigh wave propagation in a homogeneous centrosymmetric flexoelectric half-space. Ultrasonics. 2020;103:106105.
- Tamura S, Tanaka Y, Maris HJ. Phonon group velocity and thermal conduction in surlattices. Physical Review B. 1999;60(4):2627–2630
- Castanier MP, Pierre C. Lyapunov exponents and localization phenomena in multi-coupled nearly periodic systems. J Sound Vib. 1995;183(3):493–515.
- Anderson PW. Absence of Diffusion in Certain Random Lattices. Phys Rev. 1958;109(5):1492–1505.
Appendix
Derivation of Equations (23) and (24)
The simplified inhomogeneous equations are:
The solution of the above equations can be expressed as:
where . Substituting the assumed solution into the inhomogeneous equations leads to:
To facilitate the calculation, the dimensionless coordinate, , is introduced. where
represents the average thickness of the first sublayer. Therefore, the two equations above can be further simplified as:
Appendix
Calculation of transfer matrix with flexoelectric effect neglected
With the higher order terms and force-electric coupling caused by flexoelectric effect and micro-inertia effect neglected, the governing equation is simplified as:
The displacement can be expressed as:
where , while the stress is given by:
In the classical elastic case, the state vector is , where
, and
and
represent the sublayers A and B of 1D PC. The transfer matrix is then obtained as
.
Appendix
Expression of state vector with flexoelectric effect accounted for
The state vectors are:
where and
represent the sublayers A and B of 1D PC, respectively.