Abstract
Remote sensing has emerged as a useful tool for monitoring spatial and temporal distribution of sediment fluxes in the water bodies. The large quantity of sediment transported by the river waters create a number of water resources and environmental problems and could shorten the useful life of many downstream reservoirs and dams. The objective of the present article is to quantify the distribution of suspended sediment by means of Advanced Land Observing Satellite/Advanced Visible and Near Infrared Radiometer type 2 (ALOS/AVNIR-2) and Systeme Pour l'Observation de la Terre (SPOT) satellite data. Multispectral remotely sensed algorithm was developed to investigate the distribution of suspended sediment in the Indus River, Pakistan, and Tarbela dam reservoir. Reflectance of ALOS/AVNIR-2 band 3 and band 4 and SPOT-2 satellite band 2 and band 3 was found to be the best predictor of suspended sediment concentration in the surface waters. To deal with the lack of in situ data, remotely sensed data are coupled with optical modeling and the desired parameter is derived by model inversion technique. The developed methodology is an effective and efficient tool for monitoring erosion, deposition areas, and sediment distribution in large rivers.
1. Introduction
It is universal truth that meager resources compel for their better utilization and preservation. Soil and water resource protection is crucial for productive and sustainable economies. The processes of erosion, sediment delivery, and sediment transport are key components and measures of the functioning of the earth system. Erosion and sediment redistribution processes are the primary drivers of landscape development and play an important role in soil development (Walling Citation2009). Distribution of the suspended sediment concentration (SSC) in the rivers is the key issue for analyzing the intensity of erosion in upstream watershed and its adverse effect on the downstream areas. Sediment load of a river provides an important measure of its morphodynamics, the hydrology of its drainage basin, and the erosion and sediment delivery processes operating within that basin. High concentrations of suspended sediment in water are a critical element in the economic feasibility of dam projects. The loss of storage capacity in the US reservoirs cost $100 million annually in dredging and related mitigation efforts (Julien Citation1995). The most often cited estimates of the global suspended sediment discharge to the ocean range between 15 × 109 and 20 × 109 t year−1, where the best estimate may be about 20 × 109 t year−1 (Walling and Webb Citation1996), of which over 25% is considered to be trapped by dam reservoirs (Vorosmarty et al. Citation1997).
South Asia is one of the regions in the world where soil erosion by water and wind is a severe problem (Singh et al. Citation1992). Runoff water from watersheds provides most of the flow available to Pakistan's irrigation system. A substantial amount of sediment is usually picked up from the soil as these waters move to lower elevations under the force of gravity. While their sediments built the soils of the Indus Basin, they are now often a problem because they fill the reservoirs. Identification of these sources and quantifying their effect is a major task for environmental technologist and water resources planners (Bhargava and Mariam Citation1991). This necessitates a comprehensive study of sediment fluxes, the quantity of total sediment deposited in reservoirs, and the quantitative relation of sediment to the flow of water and impact of climatic change on sediment yield and river discharge. In order to cope with demands for new information to underpin the development of sediment control and management strategies, there is dire need to explore new sources of data to complement traditional data collection techniques. Arguments for the application of remotely sensed data for water resources and environmental monitoring are compelling. The application of remote sensing in water resources research and management mainly consists of one of the three categories: mapping of watersheds and features, indirect hydrological parameter estimation, and direct estimation of hydrological variables (Melesse et al. Citation2007).
Numerous researchers have investigated the application of remotely sensed data for retrieval of SSC in water bodies such as Ritchie and Cooper (Citation1998), Dekker et al. (Citation2001a), Islam et al. (Citation2001), Doxaran et al. (Citation2002, Citation2005), Ouillon et al. (Citation2004), Binding et al. (Citation2005), Han et al. (Citation2006), Ma and Dai (Citation2005), Zhou et al. (Citation2006), and Wang et al. (Citation2010). The optimal wavelength to determine these relations depends on the sediment texture and concentration (Curran and Novo Citation1988). Most of the previous research work is focused on coastal Case-II waters, rivers, and reservoirs and estuarine environments. Dekker et al. (Citation2001b) reported that Landsat-TM5 bands 2 and 3 and Systeme Pour l'Observation de la Terre–High-Resolution Visible (SPOT-HRV) bands 1 and 2 are most suited for estimating total suspended matter in the Frisian lake system within SSC range 0–50 mg/l. Doxaran et al. (Citation2002) studied the spectral signature of highly turbid waters and established relationship between suspended particulate matter and SPOT-HRV band ratio model: R rs(XS3)/R rs(XS1) and R rs(XS3)/R rs(XS2). Doxaran et al. (Citation2005) documents the correlation between the R rs(850 nm)/R rs(550 nm) ratio and total suspended matter concentration in estuarine waters. Han et al. (Citation2006) described the retrieval of SSC in the Yangtze River estuary from the Chinese Moderate Resolution Imaging Spectroradiometer data and found that the most sensitive bands of the suspended sediment are 550 and 670 nm in visible light band. Islam et al. (Citation2001) examined the seasonal and spatial variation of suspended sediment in the Ganges and Brahmaputra rivers in Bangladesh for two different discharge periods and estimated the distribution of SSC in the range of 0–1200 mg/l by means of Landsat-TM band 3 and AVHRR band 1 data. Wang et al. (Citation2009) analyzed Landsat ETM+ to estimate the SSC along the upper and middle Yangtze River and mentioned that the ETM+ band 4 (near-infrared, NIR) is the best indicator of SSC. Moreover, Wang et al. (Citation2010) indicated that the reflectance difference between band 2 and band 5 of Terra MODIS satellite data showed a significant logarithmic relationship with SSC at lower Yangtze River. Earth observation from space offers unique opportunities to obtain information regionally and globally. Remotely sensed images provide regional coverage with the potential for monthly to daily coverage. The prime objective of present research is to monitor the spatial and temporal distribution of suspended sediments in the Indus River by means of remotely sensed data and to explore new techniques to cope with lack of ground truth data.
2. Study area
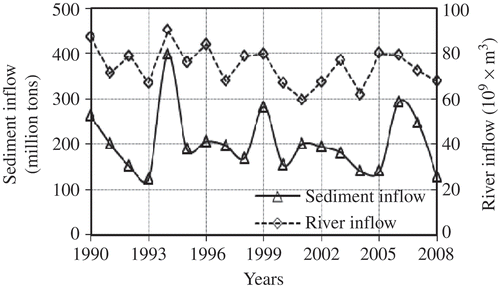
The Tarbela Dam is the largest earth and rockfill dam of the world across the Indus River, Pakistan. The total length of the river is about 2900 km. The catchment area of the river is 969,000 km2 with an annual runoff of 175 billion m3 and annual sediment load of 470 million tons. At the average discharge, the suspended sediment consists of about 40% sand, 46% silt, and 14% clay. Above Tarbela Dam, the catchment area is 169,650 km2 with annual sediment load of 287 tons. Although the catchment area above Tarbela Dam accounts for only 17.5% of the total catchment area of the Indus, the annual sediment load above Tarbela accounts for 66% of the total sediment load of the river. Annual sediment load computed from hydrograph survey is depicted in .
Figure 1. Annual sediment load computed from hydrograph survey.
The predicted average annual erosion rate of 3.2 mm a−1 for the upper Indus River basin is significantly higher than the overall global average erosion rate of 0.38 mm a−1 as estimated by Yang et al. (Citation2003). The main source of sediment is from the glacial landscape and erosion from steep-sided barren slopes. Archer (Citation2003) characterized the upper Indus River by three contrasting hydrological regimes based on the mechanisms generating runoff during the summer season: (1) melt of glaciers and permanent snow in high-elevation drainage basins, where summer runoff is predominantly controlled by the temperature; (2) melt of seasonal snow, controlled by preceding winter and spring precipitation; and (3) winter and monsoon rainfall, controlled by precipitation in the current season. The sediment data of the selected world rivers are tabulated in . The distribution and composition of sediments in relation to the magnitude of the flow and along the Indus River is not really known, resulting in various socioeconomic and environmental problems. The climatic change and extreme events also have diverse impact on soil erosion and sediment movements in the study area. The availability of long-term in situ data is essential for accurate assessment of sediment load. There is dire need to adopt methodology for effective and efficient monitoring of suspended sediments along the river reach on seasonal bases and during the floods.
Table 1. Sediment data of the selected world rivers (WAPDA Citation1991)
3. Material and methods
3.1. Lab experiment
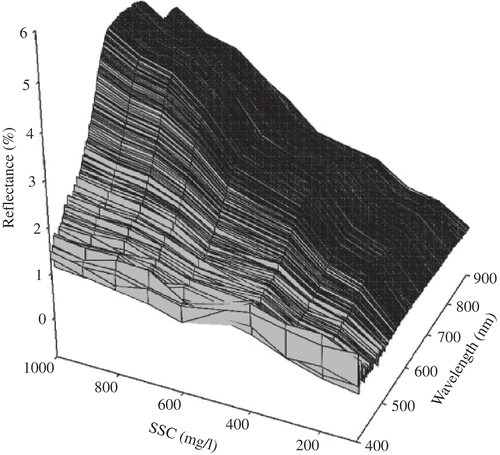
Experiments were performed in the laboratory to elucidate the effect of different concentrations of suspended sediments on reflectance signals. The soil samples were collected from the research study area. The spectral reflectance of water with varying concentrations of collected soil sample was investigated in detail. The experiments were performed in the laboratory under controlled conditions and the depth of water column was kept constant at 40 cm. The spectral reflectance of water with varying concentrations of suspended sediments (0–1000 mg/l) was estimated by means of a hyperspectral Field SpecPro FR Spectroradiometer (Analytical Devices, Inc., Boulder, CO, USA) as illustrated in . It was observed that the reflectance increases with the increase in SSC and the peak reflectance shifts toward longer wavelength. The systematic trend in reflectance pattern was observed through the entire range of spectrum. To investigate the field application of collected hyperspectral reflectance, the collected hyperspectral signatures were simulated to Advanced Land Observing Satellite/Advanced Visible and Near Infrared Radiometer type 2 (ALOS/AVNIR-2) bandwidths as shown in . The simulated AVNIR-2 band 3 and band 4 were found to be well correlated with SSC. The regression model was developed between the simulated AVNIR-2 data and SSC (). The developed reflectance model (B 4+B 3)/(B 3/B 4) derived from a series of laboratory experiments is found to be the best predictor of SSC. The subscripts 4 and 3 represent band 4 and band 3 of ALOS optical sensor AVNIR-2.
Figure 3. Simulated ALOS/AVNIR-2 reflectance of varying SSC (0–1000 mg/l).
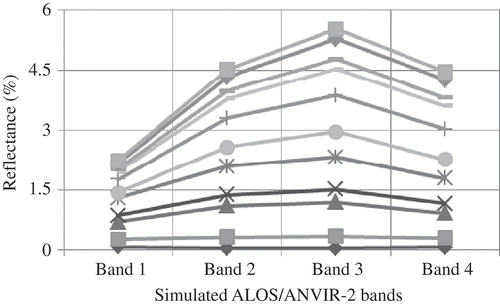
Figure 4. Relationship between SSC and the developed reflectance model.
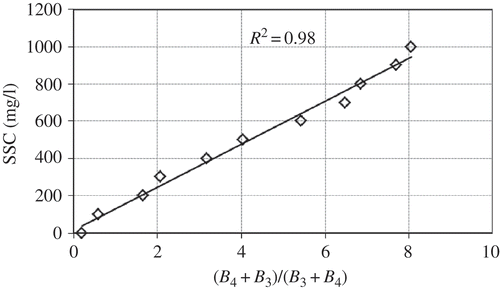
Figure 2. Spectral reflectance of water with varying concentrations of collected soil samples.
3.2. Multispectral remotely sensed data
Satellite and airborne optical sensors can provide the high spatial and temporal resolution data that are considered as a potential tool for monitoring and modeling inland and coastal waters. The satellite data can provide repetitive and synoptic coverage. In a larger river like Indus River, the in situ measurements of suspended sediments can provide data only at discrete points. Also, the logistics and expense of traditional data collection methods can rarely produce the synoptic coverage, resolution, and temporal detail necessary to delineate the water bodies. The ALOS/AVNIR-2 and SPOT images of the research study area were processed and analyzed in the present study. ENVI 4.3, a digital image-processing software package, was used to process the satellite data. The images were first geometrically rectified to Universal Transverse Mercator projection (Zone 16; Datum: WGS84). The geometrically and radiometrically corrected images were used for further analysis. The SSC data of the Indus River at the monitoring station, 67 km upstream of the dam, on the day of satellite overpass was obtained from Water and Power Development Authority, Pakistan.
3.2.1. Advanced Land Observing Satellite
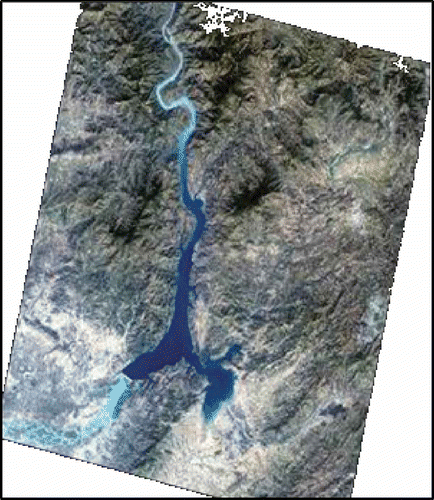
ALOS has two optical sensors called Panchromatic Remote-Sensing Instrument for Stereo Mapping for digital elevation mapping and AVNIR-2 for precise land coverage observation. AVNIR-2 is a visible and near-infrared radiometer for monitoring regional environment (land, coastal zones, and water bodies). The wavelengths covered by the AVNIR-2 include band 1 (0.42–0.50 μm), band 2 (0.52–0.60 μm), band 3 (0.61–0.69 μm), and band 4 (0.76–0.89 μm). The ALOS images acquired on 6 October 2006 () were processed to monitor the suspended sediment distribution in the Indus River. These images encompass the Indus River, Tarbela Dam, and surrounding area along the river. For each band, the image digital numbers (DN) were converted to top of atmosphere (TOA) spectral radiance (L) by using the following equation:
Figure 5. ALOS/AVNIR-2 image of Tarbela Dam and Indus River, Pakistan. Acquisition date: 6 October 2006.
3.2.2. Systeme Pour l'Observation de la Terre satellite
The SPOT satellite system provides capability of applying high-resolution multispectral imagery to a range of land-use and land-cover analyses. The SPOT-2 satellite is equipped with two HRV linear array (pushbroom) sensors capable of operating in a panchromatic mode with 10 m resolution, or a three-band multispectral (XS) mode with 20 m resolution. The SPOT image acquired on 10 May 2005 was processed and analyzed for the suspended sediment estimation. The DNs were converted into the radiance units by using the following equation:
3.3. Optical model inversion techniques
The field application of remotely sensed data demands for ancillary field data. However, the data availability is inevitably a key constrain in the research study area and the SSC at only one sampling point 67 km upstream of the dam is known. To deal with lack of in situ data, remotely sensed data (ALOS/AVNIR-2 and SPOT) are coupled with optical modeling and the desired parameter is derived by model inversion techniques. Dekker et al. (2001) suggested that optical modeling is preferred above (semi-) empirical algorithms that have been the standard for many years in operational applications of remote sensing (and still are for ocean types of water). The relationship between reflectance R, inherent optical properties (IOPs) of the medium, absorption coefficient a(λ), and backscattering coefficient b b(λ) is expressed as described by Morel and Louis (Citation1977):
The value of factor Q (ratio of upwelling irradiance to upwelling radiance) is ∼3.4 (Gordon et al. Citation1975). For many studies, Q is often arbitrarily chosen as a spectral constant. However, Carder et al. (Citation1991) found that Q is not spectrally constant for the 1990 stations, and there was a trend for Q to increase with wavelength (an inverse trend compared with b bs). The value of 3.14 is used for analysis.
The absorption coefficient a(λ) and backscattering coefficient b b(λ) is written as follows:
Mobley (Citation1994) has mentioned different values for color dissolved organic matters in coastal and estuarine waters. The average value of 0.3 m−1 for the river is adopted and kept constant along the river reach as mentioned; a y(λo) = 0.3 m−1, λ o = 400 nm and S = 0.014 m−1. Absorption by sediment is modeled as (Buiteveld Citation1995)
4. Result and discussion
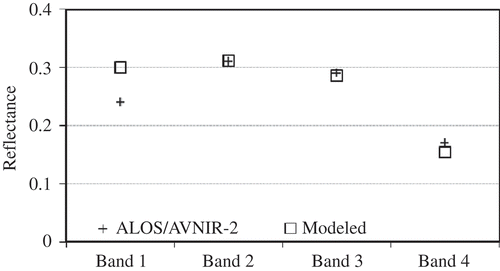
Remotely sensed data offer a unique perspective and are imperative for management and monitoring of earth resources from local to regional to global scale. Satellite-based remote sensing has been used to retrieve SSC data because it has wide spatial coverage and high temporal repeatability and provides an option for relatively low-cost assessment of SSC in surface waters. To evaluate the developed model and methodology, with the in situ SSC of 255 mg/l (sand 20%, silt 55%, and clay 15%) at the day of satellite overpass, the modeled spectra were developed and simulated into ALOS/AVNIR-2 bandwidths. The simulated modeled reflectance data and ALOS/AVNIR-2 reflectance data at the same sampling point were compared as demonstrated in . It was observed that the difference between the two reflectance values (modeled and ALOS/AVNIR-2) was minimal in the green, red, and NIR domain and overall showed good agreement. The difference in blue region (band 1) was significant and may minimize by considering absorption and scattering by chlorophyll-a present in the water. It leads to the conclusion that the proposed approach is applicable for estimation of suspended sediments in turbid water bodies.
Figure 6. Spectral comparison between modeled and ALOS/AVNIR reflectance data.
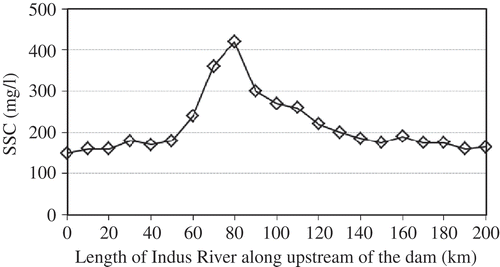
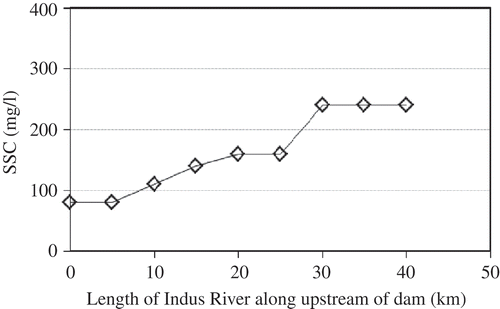
The reflectance pattern of ALOS/AVNIR-2 satellite data at each band along the Indus River upstream of the dam is drawn as . Han (Citation1997) mentioned that spectral reflectance increased with increasing SSC within the range of 0–500 mg/l for wavelengths between 400 and 900 nm. The similar fashion was observed and the reflectances vary along the river and for each band. The SSC along the river reach was estimated by using the model inversion technique and minimizing the difference between modeled and ALOS/AVNIR-2 image reflectance data. To quantify the SSC at other points, the input SSC were assumed or estimated by lab-based model and modeled reflectance spectra were generated. The developed spectrums were simulated to the bandwidths of AVNIR-2 sensors. By varying the value of input SSC, the difference between the modeled and ALOS/AVNIR-2 reflectance value was minimized. The output value with minimum difference in the red and NIR domain is the SSC at the point and the resultant spectra correspond to the spectral shape and magnitude of that point. By adopting the same approach, the SSC along the river at every 10 km was retrieved as demonstrated in . It is evident from the graphical presentation that the SSC varies along the river and the peak was observed at about 70 km upstream of the dam. In the range from 60 to 90 km upstream of the dam, the amount of suspended sediments is significant and tends to decrease toward dam body. The velocity of the river inflow containing sediments decreases upon entering Tarbela reservoir, which reduces the sediment-carrying capacity of the river water. The coarse sediment tends to deposit in the upper reaches of the reservoir, while the finer particles travel downstream toward the dam. It was found that heavy sediment load is settling upstream of the dam in the range from 60 to 90 km.
Figure 7. Reflectance pattern of ALOS/AVNIR-2 satellite data at every 10 km along the Indus River upstream of the dam.
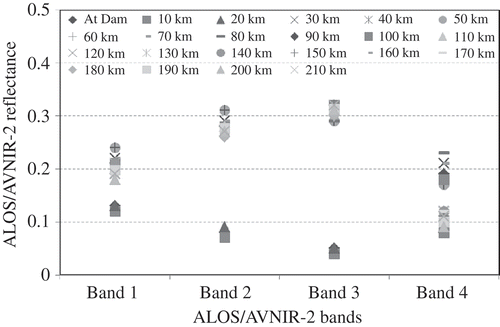
Figure 8. SSC distribution along the Indus River upstream of the dam derived from ALOS/AVNIR-2 satellite image by model inversion technique.
The SPOT 1, 2, 3 HRV sensor has two wavebands in the visible portion of the electromagnetic spectrum, XS1 (500–590 nm) and XS2 (610–680 nm), and one waveband in the NIR portion of the electromagnetic spectrum, XS3 (790–890 nm). In the case of SPOT-HRV satellite data, the average reflectance values of SPOT band XS2 and XS3 were 10% and 7%, respectively. The concentration was found to be low because of dry season. This scenario closely matches with the seasonal pattern of SSC in the river. The SSC along the river reach was estimated by using nonlinear curve-fitting technique. The SSC along the river reach is illustrated in . The graphical demonstration of suspended sediment distribution reveals that heavy sediment load is settling upstream of the dam, thus reducing the storage capacity of the dam. The periodic examination of the sediment deposits and distribution in the upstream and downstream of the dam is vital to enhance the mitigation efforts for reduction of sediments.
Figure 9. SSC along the river reach upstream of the dam derived from SPOT satellite image by model inversion technique.
4.1. SSC model development
Sterckx et al. (Citation2007) applied NIR bands of the Airborne Hyperspectral Scanner sensor to estimate SSC in the range of 0–400 mg/l. Harrington et al. (Citation1992) described that Landsat MSS band 3 (NIR) was suitable for 0–500 mg/l, and MSS band 4 (NIR) was suitable for higher SSC. Wang et al. (Citation2010) pointed out that NIR bands are appropriate for higher SSC waters, whereas visible bands are appropriate for lower SSC waters. A strong linear and nonlinear correlation exists between remote sensed reflectance and SSC. Single band and band ratio algorithms have been proposed by researchers for assessment of SSC (Topliss et al. Citation1990, Doxaran et al. Citation2009). Doxaran et al. (Citation2002) reported that use of reflectance ratios could reduce skylight reflection and the influence of particle grain size and refractive index variations. In this research study, the combination of ALOS/AVNIR-2 bands 3 and 4 was selected to demonstrate the relationship between reflectance and SSC because SSC is strongly correlated with red and NIR domain. The developed ALOS/AVNIR-2 reflectance model (B 4+B 3)/(B 3/B 4) is considered to be the best predictor of SSC. The term (B 4+B 3) represents the spectrum features of low and high concentrations of the suspended sediments and provides a solution for the estimation of different sizes of sediments within the water bodies. However, the influence of chlorophyll-a concentration on red domain (band 3) is well documented in the literature (Gitelson et al. Citation2007). The term of (B 3/B 4) reduces the chlorophyll interference to the low SSC. The reflectance [(B 4+B 3)/(B 3/B 4)] pattern of ALOS/AVNIR-2 satellite image along the Indus River upstream of the dam is shown in . The relationship between developed model and SSC (R 2 = 0.78, n = 21) is demonstrated in . It is concluded that the ratio of AVNIR-2 band 3 and band 4 by applying two-band model approach is the best predictor of SSC in the research study area:
Figure 11. Relationship between SSC (mg/l) and the developed two-band ALOS/AVNIR-2 reflectance model.
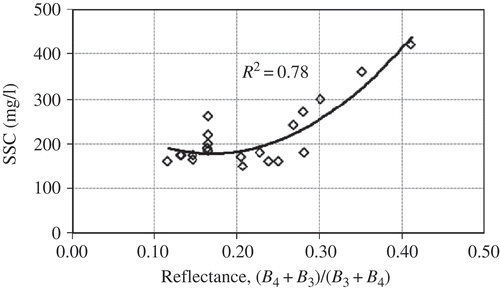
Figure 10. ALOS/AVNIR-2 reflectance [(B 4+B 3)/(B 3/B 4)] pattern along the Indus River upstream of the dam.
![Figure 10. ALOS/AVNIR-2 reflectance [(B 4+B 3)/(B 3/B 4)] pattern along the Indus River upstream of the dam.](/cms/asset/6049f9df-96c0-4ee9-a9b3-3bd91ea1e560/tagi_a_576267_o_f0010g.gif)
The SPOT visible band (XS2 and XS3) reflectances were highly correlated with SSC. The reflectance pattern of developed SPOT model (B 3+B 2)/(B 2/B 3) along the Indus River upstream of the dam is demonstrated in . The reflectance pattern represents the distribution of suspended sediments along the river reach. In order to quantify the suspended sediment and evaluate the feasibility of SPOT data for estimation of suspended sediment, the two-band regression model was developed (R 2 = 0.96, n = 9) as graphed in . Regression model for estimation of suspended sediment developed by means of SPOT data is as follows:
Figure 13. Relationship between SSC and the developed SPOT (two-band) reflectance model.
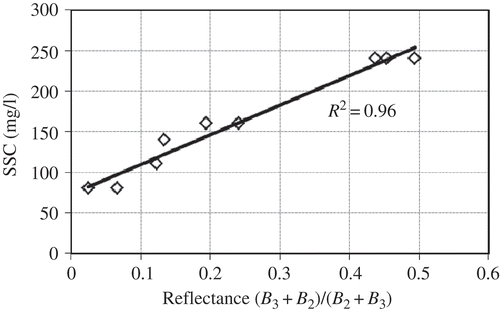
Figure 12. SPOT-2 reflectance [(B 3+B 2)/(B 2/B 3)] pattern along the Indus River upstream of the dam.
![Figure 12. SPOT-2 reflectance [(B 3+B 2)/(B 2/B 3)] pattern along the Indus River upstream of the dam.](/cms/asset/99215d00-2808-4c30-b09e-cb1b003c252d/tagi_a_576267_o_f0012g.gif)
5. Conclusion
Remote sensing has many actual and potential applications for water resources and environmental monitoring and management. The limitations in spatial, temporal, and spectral resolution of many optical sensors on satellites limit the wide application of satellite data to monitor and model the water-quality parameters. Model inversion technique is useful to estimate the unknown water-quality parameters in water bodies. Coupling of bio-optical modeling with remotely sensed data enhances the efficiency and reliability of the models and makes remote sensing as stand-alone tool. By adopting the proposed methodology, the satellites archives may become a valuable resource for water resources engineers and researchers to remotely monitor the water bodies in the absence of ground truth data. The inversion technique is feasible to cope with lack of ground truth data problem. The ratio of ALOS/AVNIR-2 band 4 and band 3 (two-band model) and SPOT band 2 and band 3 was found to be the best predictor of SSC. In this research work, the concerned water-quality parameter was suspended sediments. If the concentration of one water-quality parameter is known, the concentration of other parameters at the same sampling point may be estimated by model inversion technique. The optical models and parameters were adopted from the literature review and need further validation in the research study area. Much work is needed to overcome the limitations of current techniques and to develop physically based models to improve the accuracy of optical models for assessment of SSC.
Acknowledgements
The authors acknowledge the logistic support provided by Japan Aerospace Exploration Agency (JAXA), Japan, and Kochi University of Technology, Kochi, Japan.
References
- Archer , D. 2003 . Contrasting hydrological regimes in the upper Indus basin . Journal of Hydrology , 274 ( 1–4 ) : 198 – 210 .
- Bhargava , D.S. and Mariam , D.W. 1991 . Effects of suspended particle size and concentration on reflectance measurement . Photogrammetric Engineering and Remote Sensing , 57 : 519 – 529 .
- Binding , C.E. 2005 . Estimating suspended sediment concentrations from ocean color measurements in moderately turbid waters: the impact of variable particle scattering properties . Remote Sensing of Environment , 94 : 373 – 383 .
- Bricaud , A. 1981 . Absorption of dissolved organic matter of the sea (yellow substance) in the UV and visible domains . Limnology and Oceanography , 26 ( 1 ) : 43 – 53 .
- Buiteveld , H. 1995 . A model for calculation of diffuse light attenuation (PAR) and secchi depth . Netherlands Journal of Aquatic Ecology , 29 ( 1 ) : 55 – 65 .
- Carder , K.L. 1991 . Reflectance model for quantifying chlorophyll a in the presence of productivity degradation products . Journal of Geophysical Research , 96 ( C11 ) : 20599 – 20611 .
- Curran , P.J. and Novo , E.M.M. 1988 . The relationship between suspended sediment concentration and remotely sensed spectral radiance: a review . Journal of Coastal Research , 4 : 351 – 368 .
- Dekker , A.G. 2001a . “ Chapter 11: Imaging spectrometry of water ” . In Imaging spectrometry: basic principles and prospective applications: remote sensing and digital image processing , Edited by: Van der Meer , F. and de Jong , S. Vol. IV , 307 – 359 . Boston : Kluwer Academic Publishers .
- Dekker , A.G. , Vos , R.J. and Peters , S.W.M. 2001b . Comparison of remote sensing data, model results and in situ data for total suspended matter (TSM) in the southern Frisian lakes . The Science of the Total Environment , 268 : 197 – 214 .
- Doxaran , D. 2002 . Spectral signature of highly turbid waters: application with SPOT data to quantify suspended particulate matter concentrations . Remote Sensing of Environment , 81 : 149 – 161 .
- Doxaran , D. 2005 . Use of reflectance band ratios to estimate suspended and dissolved matter concentrations in estuarine waters . International Journal of Remote Sensing , 26 ( 8 ) : 1763 – 1769 .
- Doxaran , D. 2009 . Dynamics of the turbidity maximum zone in a macrotidal estuary (the Gironde, France): obrservations from field and MODIS satellite data . Estuarine, Coastal and shelf Science , 81 ( 3 ) : 321 – 332 .
- Forget , P. 1999 . Inversion of reflectance spectra of non-chlorophyllous turbid coastal waters . Remote Sensing of Environment , 68 : 264 – 272 .
- Gitelson , A. 2007 . Remote chlorophyll-a retrieval in turbid, productive estuaries: Chesapeake Bay case study . Remote Sensing of Environment , 109 : 464 – 472 .
- Gordon , H.R. , Brown , O.B. and Jacobs , M.M. 1975 . Computed relationships between the inherent and apparent optical properties of a flat homogeneous ocean . Applied Optics , 14 : 417 – 427 .
- Hadjimitsis , D.G. 2004 . An assessment of the effectiveness of atmospheric correction algorithms through remote sensing of some reservoirs . International Journal of Remote Sensing , 20 : 3651 – 3674 .
- Han , L. 1997 . Spectral reflectance with varying suspended sediment concentrations in pure and algal-laden waters . Photogrammetric Engineering Remote Sensing , 63 ( 6 ) : 701 – 705 .
- Han , Z. 2006 . Suspended sediment concentrations in the Yangtze River estuary retrieved from the CMODIS data . International Journal of Remote Sensing , 27 ( 19 ) : 4329 – 4336 .
- Harrington , J.A. , Schiebe , F.R. and Nix , J.F. 1992 . Remote sensing of Lake Chicot, Arkansas: monitoring suspended sediments, turbidity, and secchi depth with Landsat MSS data . Remote Sensing of Environment , 39 : 15 – 27 .
- Islam , M.R. , Yamaguchi , Y. and Ogawa , K. 2001 . Suspended sediment in the Ganges and Brahmaputra rivers in Bangladesh: observation from TM and AVHRR data . Hydrological Processes , 15 : 493 – 509 .
- Julien , R.Y. 1995 . Erosion and sedimentation , 279 New York : Cambridge University Press .
- Ma , R. and Dai , J. 2005 . Investigation of chlorophyll-a and total suspended matter concentrations using Landsat ETM and field spectral measurement in Taihu Lake, China . International Journal of Remote Sensing , 26 ( 13 ) : 2779 – 2787 .
- Melesse , A.M. 2007 . Remote sensing sensors and applications in environmental resources mapping and modeling . Sensors Journal , 7 : 3209 – 3241 .
- Mobley , C.D. 1994 . Light and water: radiative transfer in natural waters , San Diego, CA : Academic Press .
- Morel , A. and Louis , P. 1977 . Analysis of variation in ocean color . Limnology and Oceanography , 22 ( 4 ) : 709 – 722 .
- Ouillon , S. , Douillet , P. and Andrefouet , S. 2004 . Coupling satellite data with in situ measurements and numerical modeling to study fine suspended-sediment transport: a study for the lagoon of New Caledonia . Coral Reefs , 23 : 109 – 122 .
- Ritchie , J.C. and Cooper , C.M. 1998 . Comparison of measured suspended sediment concentration with suspended sediment concentrations estimated from Landsat MSS data . International Journal of Remote Sensing , 9 ( 3 ) : 379 – 387 .
- Singh , G. 1992 . Soil erosion rates in India . Journal of Soil Water Conservation , 47 : 93 – 95 .
- Smith , R.C. and Baker , K. 1981 . Optical properties of the clearest natural waters . Applied Optics , 20 ( 2 ) : 177 – 184 .
- Sterckx , S. 2007 . Retrieval of suspended sediment from advanced hyperspectral sensor data in the Scheldt estuary at different stages in the tidal cycle . Marine Geodesy , 30 ( 1–2 ) : 97 – 108 .
- Thuillier , G. 2003 . “ The solar spectral irradiance from 200 to 2400 nm as measured by the SOLSPEC spectrometer from the Atlas and Eureca missions ” . In Solar Physics , Vol. 214 , 1 – 22 . The Netherlands : Kluwer Academic Publishers .
- Topliss , B.J. , Amos , C.L. and Hill , P.R. 1990 . Algorithms for remote sensing of high concentration, inorganic suspended sediment . International Journal of Remote Sensing , 11 : 947 – 966 .
- Tyler , A.N. 2006 . Remote sensing of the water quality of shallow lakes: a mixture modeling approach to quantifying phytoplankton in water characterized by high-suspended sediment . International Journal of Remote Sensing , 27 ( 8 ) : 1521 – 1537 .
- Vermote , E.F. 1994 . Second simulation of the satellite signal in the solar spectrum (6S) , 134 Maryland : Greenbelt . 6S User Guide Version 6.0, NASA-GSFC
- Vermote , E.F. 1997 . Second simulation of the satellite signal in the solar spectrum: an overview . IEEE Transactions on Geoscience and Remote Sensing , 35 ( 3 ) : 675 – 686 .
- Vorosmarty , C.J. The potential impact of neo-Cartorization on sediment transport by the global network of rivers . Proceedings of the Fifth IAHS scientific assembly at Rabat, Morocco . April–May 1997 . Edited by: Walling , D.E. and Probst , J.-L. Wallingford : International Association of Hydrological Sciences .
- Walling , D.E. 2009 . The impact of global change on erosion and sediment transport by rivers: current progress and future challenges , Paris : UNESCO . The United Nations World Water Assessment Programme, UNESCO-IHP Scientific Paper
- Walling , D.E. and Webb , B.W. 1996 . “ Erosion and sediment yield: global overview ” . In In proceedings of the Exeter Symposium , 3 – 19 . Canada : IAHS . IAHS Publication No. 236
- Wang , J.J. 2009 . Retrieval of suspended sediment concentrations in large turbid rivers using Landsat ETM+: an example from the Yangtze River, China . Earth Surface Processes and Landforms , 34 : 1082 – 1092 .
- Wang , J.J. 2010 . Estimation of suspended sediment concentrations using Terra MODIS: an example from the Lower Yangtze River, China . Science of the Total Environment , 408 : 1131 – 1138 .
- Water and Power Development Authority (WAPDA) . 1991 . Tarbela second periodic inspection Vol. 2 , 20 – 12 . Pakistan Sec: 20.5 (b)
- Yang , D. 2003 . Global potential soil erosion with reference to land use and climate changes . Hydrological Processes , 17 : 2913 – 2928 .
- Zhou , W. 2006 . Mapping the concentrations of total suspended matter in Lake Taihu, China, using Landsat-5 TM data . International Journal of Remote Sensing , 27 ( 6 ) : 1177 – 1191 .