Abstract
The demand for daily commuting that is safe, efficient, and cost-effective has given rise to the increasing use of multimodal public transport system. Single-mode and single-criterion route choice based on travel time or cost has been extensively studied. However, little has so far been reported on an integrated real-time model for multimodal and multicriteria route choice. The multiple criteria model described here is based on travel time, cost, and safety and allows for route choice across different transport modes. This model is implemented by integrating geographic information systems (GIS) with a microscopic traffic simulation system. The multimodal transport network is converted to a single-layer GIS network and the switching delays between different modes of transport are assigned to the related links. Subsequently, the link-based generalized cost from different factors is derived. Real-time traffic conditions obtained by means of simulating traffic conditions are then fed to GIS to find the time-dependent optimal route using a dynamic least generalized cost algorithm developed in this study. As different criteria influence the generalized cost for route selection differently, analytical hierarchy process is adopted for determining the weights of each factor. A prototype fulfilling the aforementioned aspects has been developed and the route choice model is demonstrated on multimodal transportation networks in the central region of Singapore.
1.Introduction
These days, an estimated 3.8 million Singaporeans make 7 million daily passenger trips, with 63% of these trips being made using public transport. By 2030, with an expected population of 4.1 million, the projected number of daily trips will reach 10 million, out of which 75% are estimated to be made using public transport. Therefore, continuous efforts are being made to improve and expand the public transport system and service.
By promoting individual modes to a multimodal system approach, the Intermodal Surface Transportation Efficiency Act of 1991 and the Transportation Equity Act for the 21st Century initiate a shift in conventional transportation policy, and efficiency, safety, and flexibility can then be improved (NCIT Citation1994). Multimodalism allows each mode to be used for any specific segment of a trip, and hence guarantees the lowering of overall transportation costs, congestion reduction, and lowering the burden on overstressed infrastructure components. While multimodal transport has been widely adopted, multimodal networks and algorithms have not received sufficient attention (Yu Citation2000, Ziliaskopoulos and Wardell Citation2000, Li et al. Citation2003). Multimodal networks are characterized by dynamically changing states and multiple modes of transportation operating simultaneously on these conditions. To identify the optimum paths, the construction of a traveler information system should allow for the existing multiple modes of transportation such as travels by taxis, buses, and trains. With multiple transportation modes, the system should also incorporate transfers between different modes, for example, the train-to-bus transfer and the car-to-train transfer. Subsequently, multiple objective functions are incorporated into the system to offer a variety of criteria for route guidance, for example, selecting a route with minimum number of mode transfers, shortest travel time, and minimum cost of travel. At any given moment of time, each of these criteria may have varying significance to a commuter, and hence the system should allow the commuters to choose the desired options.
Two advanced techniques, geographic information systems (GIS) and microscopic traffic simulation systems (MTSS), can be judiciously integrated to solve these complex problems pertaining to multimodal transportation. The integration of various application models into GIS has enabled users to go beyond the data inventory and management stage and conduct sophisticated modeling, analysis, and visualization for spatial decision-making (Lewis Citation1990, Nyerges Citation1992, Goodchild Citation2005). However, most GIS tools are based on a static view of the network, and this incompatibility with real-time computing facilities renders GIS inadequate to cope with network dynamics (Thill Citation2000, Miller and Shaw Citation2001), while the advent of MTSS can show promise in overcoming such problems (Li et al. Citation2003). Owing to its ability to capture the full dynamics of time-dependent traffic phenomena and its capacity to deal with behavioral models of the reactions of drivers exposed to intelligent transportation systems (ITSs), microscopic traffic simulation has become a popular tool for examining the feasibility and assessing the impact of an ITS project (Chowdhury and Sadek Citation2003). Hence, there is clearly a need for integrating GIS and MTSS into a system that can manage and control the multimodal transportation models, with the resultant system incorporating the complementary strengths of both. Apparently, little has so far been reported in this regard.
In this article, multimodal, multicriteria dynamic route choice (MMDRC) model and its implementation are demonstrated using GIS and MTSS. The GIS is designed using MapObjects, and PARAMICS is employed to create the simulation models. The traffic simulation system is adopted to simulate the traffic condition in real time and generate link travel time. GIS is used to combine the multimodal transportation networks. To provide commuters with a multicriteria routing environment, analytical hierarchy process (AHP) (Saaty Citation1980, ) is employed to determine the weights of each criterion in calculating a generalized link cost. A dynamic least-cost path-finding algorithm and a switching delay model are also formulated and applied to our case. On the basis of the multimodal Singapore transportation network data, an integrated prototype fulfilling these criteria is developed for model implementation.
The following section provides an overview of the integration of GIS and transportation models, which is followed by an outline of the architecture of the MMDRC model. Subsequently, the multimodal network modeling including the switching delay formulation is described. The multicriteria route selection method is then introduced after the description of the dynamic routing algorithm. The proposed methods are finally demonstrated through a case study in the central region of Singapore.
2. Multimodal networks in Singapore
2.1. Multimodal transport
The public transport system in Singapore consists of different modes of transport, primarily the mass railway transit (MRT), bus, and car. Each mode is described with their schedules and fares (). Such information is stored as attribute tables in the GIS network database for further route choice.
2.1.1. Bus
Two major bus operators serve the commuters in Singapore: Singapore Bus Services and Trans-Island Bus Services Ltd. Altogether, these two operators have a combined island-wide service of over 3000 bus stops and 300 bus lines. In general, each service line is identified by a name (e.g., Bus 97, Bus 133), a source station, and a destination station.
For any given service line, an arrival schedule for each stop along the route is provided. This includes the first arrival time and the frequency of arrival for a given service line. For instance, one bus of a certain line is expected to pass every 6–12 min. In general, the frequency may vary during the day, usually higher during peak hours and lower during off-peak hours. To enable fare computation, we need to model the fare structure for various service lines. In Singapore, the fare structures of both bus operators are the same. The fare for each trip is calculated on the basis of the concept of fare stages along the bus route and is not determined by the total number of stops traveled. The fare stage of a given bus line starts from 1 at the source station and increases along the route. shows the schedule and fare of bus lines 97 and 133 (Mighty Mind Citation2003). Based on the fixed schedule, we can anticipate travel time, fare, and transfer times when routing by bus.
Table 1. Schedule and fare stage of bus lines 97 and 133
2.1.2. Mass railway transit
Singapore MRT (SMRT), the main operator of public transport in Singapore, covers almost the entire island with over 80 km of rail, serving 63 stations and 4 MRT lines. According to the SMRT Annual Report by Land Transport Authority of Singapore, on average, 94% of trains arrive/depart within 2 min of schedule (SMRT Citation2005). Detailed service schedules and fares can be obtained from the SMRT website. The fare for MRT travel depends only on the source and destination stations and not on the route taken. Hence, the fare charge calculation is simply a lookup table. shows the detailed information of travel time and fare charged by MRT.
Table 2. The SMRT schedule and fare lookup table
2.1.3. Car
In general, cars are expensive in Singapore when compared with other countries, as the use of private cars is not encouraged in Singapore. Nevertheless, taxi-riding is relatively cheap and is a popular mode of transport.
2.2. Multimodal transportation network
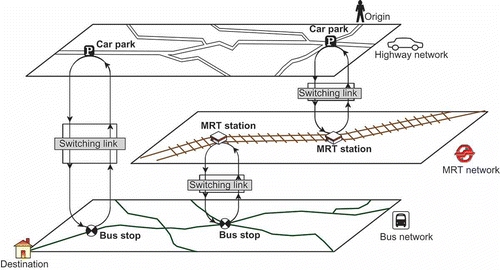
To visualize the concept of the multimodal transportation system, each modal network (e.g., bus and MRT) can be constructed as a horizontal plane. Multimodal terminals that can be accessed by both modes can be assumed to lie between the planes, vertical access links connecting them. The vertical access links represent switching delays during the transfer from one mode to another, including the parking time of cars, commuter waiting time, as well as the MRT-to-bus transfer (i.e., the travel from the MRT station to a nearby bus stop) and the car-to-MRT transfer (i.e., the travel time from parking place to the MRT station).
Traveling on a multimodal network implies that a traveler starts at a specific time, from a specific origin to specified destinations. Presumably, a commuter can dynamically select and change proper transportation modes throughout the trip. During off hours, one might drive to a parking lot close to the destination node and then walk to the ultimate destination, while during rush hours driving to a park-and-ride facility, taking a bus or a train to a transit stop close to the destination, and walking from there to the ultimate destination might be a better option.
3. GIS coupled with traffic simulation engine
Microscopic traffic simulators are simulation tools that realistically emulate the flow of individual vehicles through a road network. Most of the currently existing microscopic traffic simulators are based on the family of car-following, lane changing, and gap acceptance models to model the vehicle's behavior. All these are proven tools for aiding transportation feasibility studies. Besides their ability to capture the full dynamics of time-dependent traffic phenomena, they are capable of using behavioral models that can account for drivers’ reactions when exposed to ITSs.
Currently, there are three distinct ways of integrating GIS with external modeling software (Lewis Citation1990, Nyerges Citation1992, Goodchild Citation2005), including traffic simulation tools. They are the transportation model embedding GIS (Type 1), the transportation model connected to GIS (Type 2), and the transportation model embedded within GIS (Type 3).
Type 1 and Type 3 represent a comprehensive relationship between transportation and GIS models. Many advanced information technologies have to be employed to realize Type 1 and Type 3 as GIS and transportation data tend to be inherently complex. These technologies include built-in macro languages (e.g., Avenue in Arc-View GIS and GISDK in TransCAD), object-oriented GIS function libraries and ActiveX controls (e.g., MapObjects, NetEngine, GISDK, and MapX), and object-oriented development environments (e.g., Visual Basic, Visual C++, and Delphi). Most GIS vendors have been attempting and still continue to tackle these problems.
The simplest yet effective of the three ways is to incorporate GIS and transportation with a common interface as in Type 2. This type of integration can exploit the capability of GIS for database management and spatial analysis to the full extent. Simultaneously, transportation software packages can access GIS data and conduct both model computation and simulation. The result can then be displayed in the GIS environment. Therefore, in this study Type 2 is adopted.
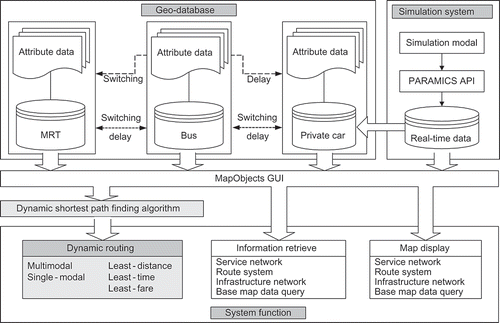
A prototype system that combines a GIS module and a simulation module has been designed in this study. As shown in , this system includes three modules: a GIS, a simulation tool, and a dynamic routing module. The dynamic routing module resides in the GIS and can access the traffic simulation data. This module consists of a dynamic routing algorithm, which will be introduced later. The interactions between different modules will be covered in the next section.
4. Multimodal network modeling
4.1. Representation of multimodal network
A critical aspect to multimodal network modeling lies in the representation of switching links to express switching delays between different modes of networks. The switching links in this study represent the waiting times at stations, the fares charged, the walking trips from the alighting point to the destinations, and so on.
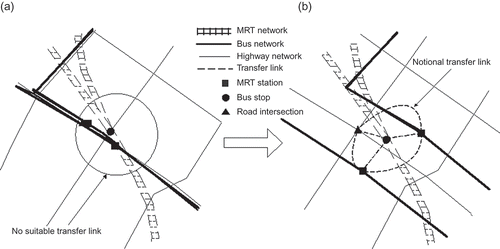
a shows the original network clipped from the entire Singapore network. Three modes of networks (i.e., car, bus, and MRT) are shown using different line types. However, the multimodal network cannot be well represented as many links overlap with two or three modes. The car park point, bus stops, and MRT stations share the same nodes, and no transfer links exist to represent the switching delays between different modes. Consequently, an improved network representation for multimodal transport has been proposed (b). First, the original network is segregated into three layers according to different traffic attributes, representing car, bus, and MRT, respectively. Links are connected by intersections in the car layer and by transit stations in the bus and MRT layers. Second, a transfer layer is created to represent the link between two layers. Bus stops, MRT stations, park-and-ride facilities are selected as transfer nodes, on which the construction of transfer links is based. Transfer links are actually virtual links in real networks, and the information related to the links such as link start and end, link length, travel time, and so on is stored in the attribute table.
Figure 3. Representation of the modified multimodal network (modified from Sheffi Citation1985): (a) original road network; (b) improved model for multimodal representation. MRT, mass railway transit.
4.2. Dynamic switching delay model
Although previous studies have proposed several algorithms for multimodal trips, these studies have not laid a concrete formulation of the switching delays, and such studies focus primarily on static formulations. On the other hand, switching delays are heavily dependent on the local transportation situations and should account for time dependency (Ziliaskopoulos and Wardell Citation2000). The transportation scenario in Singapore considered in our study includes the significant elements of switching delays, such as the parking time at car park, the waiting time at bus stops and MRT stations, the walking time between transportation facilities, and the age of travelers (Menson Citation2000). The age element was calibrated by Chee (Citation2003) to fit the local context of Singapore. The switching delay is formulated as follows:
where SD
ij
is the switching delay between transfer nodes i to j; WD
ij
is the walking distance between transfer nodes i to j, with 74 m/min being the average walking speed. Age is an indicator (Age = 1 when 15 ≤ Age ≤ 55; Age = 1.3 otherwise); is the average waiting time at MRT stations i or j;
is the average waiting time at bus stops i or j; and PT
ij
is the car parking time at the transfer nodes i or j.
Each public vehicle is assumed to start out at the same regular time frequency T and passengers arrive at the stop with an equal chance during T, and the waiting time for a coming vehicle can then be determined as , where p(t) is the probability distribution of a passenger arriving at the stop at time t and f(t) is the waiting time for the next vehicle at time t. Passengers arrive at the stop with an equal chance during the time frequency T, then
, and the waiting time for passengers arriving at time t is f(t) = T–t. Hence the resultant waiting time at transit stations is half of the line frequency (Dial et al. Citation1979). Based on the switching delay formulation, every transfer node's delay time can be calculated.
The calculation of switching delay (SD) in a dynamic environment could be very complicated. For the sake of simplicity, the walking time, age indicator, and parking time were assumed to be constants in this study. The frequencies of the MRT and bus services were for typically selected weekdays and Sundays which were referred from SMRT and Singapore Bus Services. shows the simplified SD calculation.
Table 3. Calculation of the switching delay
4.3. Obtaining real-time traffic information through traffic simulation
Exploiting the computational power and flexibility of the state-of-the-art simulation systems, a computer-based traffic simulation system, PARAMICS, is employed to present the dynamic traffic information. As shown in , the simulation module supplies real-time traffic information to the dynamic routing module.
PARAMICS is a suite of high-performance software tools for modeling the movement and behavior of vehicles in urban and highway networks. The accurate simulation of drivers and vehicles enables PARAMICS to build a complete picture of the complex traffic conditions, and thus achieve a most realistic representation of vehicle flow (Cameron and Duncan Citation1996). PARAMICS provides a customizable application programming interface (API) to meet diverse needs.
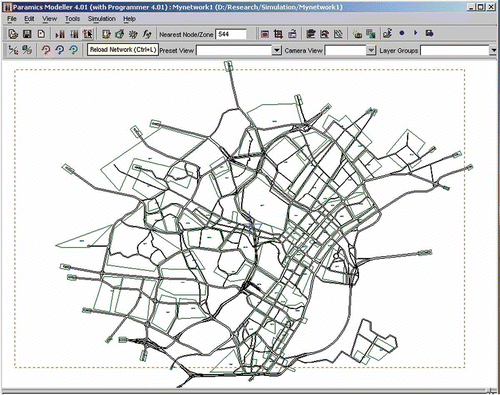
shows the Central Business District (CBD) of Singapore, the study area network, as encoded in PARAMICS. It includes 894 nodes (inclusive of 113 signalized intersections), 2558 directional links, and 100 traffic zones. The details of the geometry and physical layout of the roads are obtained via field surveys. Information such as the number of lanes, turning restrictions, post speed limit, and so on, are collected during such field surveys. The data of signal timing and phasing, origin–destination (OD) statistics, and information on the demarcation of zones in the CBD are provided by related transportation authorities. The traffic composition includes cars (about 78%), light goods vehicles (about 12%), and ordinary vehicles (about 10%). Seven bus services are set in this network for public transportation. Three groups of OD demands are designed for the implementation, considering both peak and nonpeak hours. Dynamic feedback assignment method is used during the simulation so that the simulated environment can approach the reality maximally. A 24–hour period is set as the simulation time. During the 24-hour simulation, the travel time of specified links can be recorded through the APIs at a simulation time interval of 10 min, and it is finally transferred for dynamic routing.
indicates the output data of PARAMICS. The output format can be managed by API programming. The link speed and travel time units used are meter per second and second, respectively. The traffic data during the simulation runs are recorded by the APIs. Subsequent to data procurement, the link IDs in the simulation module are matched with the GIS module.
Table 4. Output data of PARAMICS
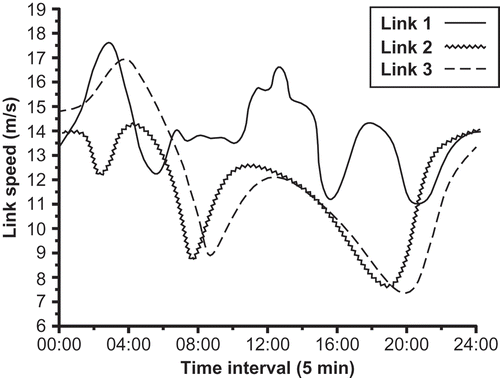
shows the typical changes of travel speed with time. Link 1 is located outside CBD; hence the link speed is contrary distributing with Link 2 and Link 3. The speeds of Link 2 and Link 3 are located in the center of CBD; the distribution of link speed accords with the real situation of Singapore. That is, the rush hour periods are from 7:30 to 9:30 and 17:00 to 20:30.
4.4. Dynamic path finding
In this study, a dynamic routing algorithm has been proposed to accomplish the model's routing function. Although previous studies have intensively investigated the shortest path algorithm, their static path finding has limited its application to static transit networks for planning (Chabini Citation1999). This can be attributed to the inherent complexity in this problem such as the time-dependent network, multimodal transportation, and time constraints. As shown above, the integration of a multilayer network into a monolayer network and the formulation of switching delays facilitate the path finding under multimodal transportation.
The proposed dynamic routing algorithm has been realized by combining the single-source, label-setting method of Dijkstra's algorithm (Dijkstra Citation1959) with the concept of the space–time network. The proposed algorithm maintains the basic elements of the label-setting method, while the labeled linklist is defined as Li : (l 1, l 2, …, ln ). Upon introducing the time factor, a space–time network can be established. A set of link cost–time networks is associated with each time stage in such a way that the link list Li is reformed as Lij (l 11, l 12, …, lij ). Then the q discrete time stages can be treated as q discrete routing according to Dijkstra's algorithm. The mathematical representation of the proposed algorithm is presented below.
-
procedure ( R (N,L,T), v)
-
{
-
var: double integer;
-
for each u in N do {C(v,u,td )=; C(v,v,td )=0; path (v,u):= null}
-
input t 0, update the [L] at time series t 0,
-
frontierSet:= [v]; exploredSet:=
;
-
while not_empty (frontierSet) do
-
{ Select w from (w.adjacencyList) with minimum C(v,w,ti ) at time ti ;
-
for each < u, C(w,u,ti )> in w.adjacencyList at time t0.
-
{if C(v,u,ti )< C(v,w,ti )+C(w,u,ti )
-
and then re-fetch w, otherwise
-
{C(v,u,ti ) = C(v,w,ti )+C(w,u,ti );
-
path (v,u,ti ):=path (v,w,ti )+(w,u,ti );
-
if u ∉ frontierSet exploredSet then
-
frontierSet:= frontierSet+[u];}
-
if C(v,w,ti )<
then,
-
frontierSet:= frontierSet-[w]; exploredSet:= exploredSet+[w];
-
if C(v,w,ti )>
, then update L at time (int [C(v,w,t)/
]+1)
-
and return to select w}
-
if (u=w) then terminate}
in which R is the time–space network; N is the set of nodes; L is the set of links; T is the set of discrete time series; ti
is the time series starting from t
0 to tn
; the input v in the procedure is the source node; u is the specified node as destination; w is the selected node w during the routing process; td
is the specified departure time; is the time interval; and C(v,w,ti
) is the travel time on link (v,w) at time ti
.
The main procedures are enumerated as follows:
-
Step 1: Initialize the network R (N,L,T); the cost C(v,v,td ) is set to zero. All other costs are set to infinity: C(v,u,td )=infinity. The path (u,v,td ) is set to null. td is the specified departure time. The frontierSet is set to be equal to the source node v. The exploredSet is initialized to the empty set.
-
Step 2: If the frontierSet is empty, go to step 4; otherwise, the following computations are carried out. A node w is selected from the frontierSet, which has the shortest path from the source node v. In the first iteration, the source node is selected because the cost C(v,v,td ) is 0 while all other costs are at infinity. The selected node w is removed from the frontierSet and added to the exploredSet. The adjacent list of w is retrieved from the secondary storage if it is not already in the main memory buffer.
For each element <u, C(w,u,ti )> in the adjacent list satisfying the condition, calculate the following:
For all time intervals , do the following:
-
C(v,u,ti )> C(v,w,ti )+C(w,u,ti )
-
(i.e., there exists a shortest path from v to u via w), the accumulative cost of the path is updated. Then the cost of the path from the source node v to u is updated as
-
C(v,u,ti ) = C(v,w,ti )+C(w,u,ti ) and
-
path (v,u,ti ):=path (v,w,ti )+(w,u,ti ).
-
u is added to the frontierSet, if it is not in the frontierSet or the exploredSet.
-
Step 3: Go to step 2.
-
Step 4: Terminate the algorithm.
The performance of the proposed algorithm is governed by some constraints. First, the network is a first-in-first-out network, implying that every link in the network satisfies the first-in-first-out property: if for each pair t
0, t
1 of times with ,
. Second, the flow of the computation is forward only. As a result, after a node i is selected at time (t), at the next time interval (
), the algorithm is only allowed to search paths originating from node i to forward nodes. In point of fact, this is a reasonable constraint indeed. It is impossible for a person to return the passed link even if the travel time of the link is less in the next time interval.
4.5. Multicriteria route choice based on generalized link cost
In real life, all critical factors are considered carefully before a decision can be made. Generally, single routing criterion cannot satisfy a commuter in his/her decision-making, and hence a generalized cost method is adopted to resolve this problem. The general cost is derived from the different combinations of significant factors in routing decision-making. Commuters are allowed to combine any of the factors in these permutations.
In this study, three factors, namely time, fare, and safety, have been identified. The values of these three factors have different units and lie within different ranges. Therefore, the values of each link on these three factors are scored and normalized to a unified range [0, 1], a larger value (e.g., more travel time) representing a less preferable choice. Weights must be assigned to each factor to integrate the scores of the above criteria into a meaningful cost function. Logically, the factors demanding greater emphasis require a higher weight. In terms of the score and weight, the generalized cost of a link can be calculated as
where GC j is the generalized cost of link j, wi is the weight of factor i, and sij is the score of link j on the ith factor. The sum of wi is 1, and the generalized cost of a route in our case can be aggregated from the involved links.
Various factors including human factors, meteorological conditions, environmental factors, and the mechanical failure of vehicles could contribute toward safety. Additionally, the location and functional class of the roadway can lead to a driver error. Consequently, it is not easy to find a generalized measurement to quantify safety. Safety can in a way be considered as the probability of vehicle crash involvement, and a method proposed by Transportation Research Board was employed and calibrated based on the local condition of Singapore (Chee Citation2003). This method considers measuring safety by the roads’ geometrical properties, thus giving a more general formulation toward safety for each transportation link.
Consequently, the final safety rank can be estimated as a semi-log regression model, and the coefficients are derived as follows:
where dependent variable is the natural log of number of crashes (fatal, injury) per million vehicle miles traveled. Independent variables are PSR, the present serviceability rating; TOPCURV, the number of degrees of arc subtended by a 100-foot length for the sharpest curve on the segment; PASSRES, a dummy variable coded 1 if a passing restriction exists anywhere on the road segment and 0 if no passing restriction exists; ADTLANE, average daily traffic in thousands per lane; RIGHTSH, width of the right shoulder in feet; LANES, a dummy variable coded 1 if the road segment has four traffic lanes and coded 0 if it has two lanes; and TOPGRAD, the change in elevation, as a percentage of the horizontal distance traversed for the greatest slope in the segment.
Using the above equation, the crash rates possibilities of each transportation link can be measured and thus be used for analysis.
The weight of each factor is determined using the AHP. AHP works principally on priorities given to alternatives and the criteria used to judge these alternatives. Priorities are derived in terms of their importance in achieving the goal, based on pair-wise comparison matrix (M
ij
). The matrix is a i × i square matrix, with every element representing the relational importance of factor i to factor j. Thus, , and the diagonal entries are given a fixed value of 1 as it is the comparison of any factor to itself. This also indicates that the weights are obtained subjectively. In this study, we set n as 3 since three factors, that is, Travel Time, Fare, and Safety, are considered. shows the ranking measurements and processes of AHP. Based on the dynamic routing algorithm discussed in the preceding section, if the above generalized link cost is used as the travel time-based link cost, then a route with the least generalized cost under multicriteria mode can be obtained.
Table 5. Calculation of general cost
5. A case study
The aforementioned approach was tested using a section of the Singaporean network covering the whole CBD. The approximate area was 7.1 × 5.9 km2 with high density of roads and heavy traffic, and it included 12 MRT stations and more than 50 bus lines (SLA Citation2005). In this area, there also existed many alternative transfer facilities serving as connectors to other transportation modes, such as car, bus, and MRT. Three scenarios were devised to illustrate the MMDRC model.
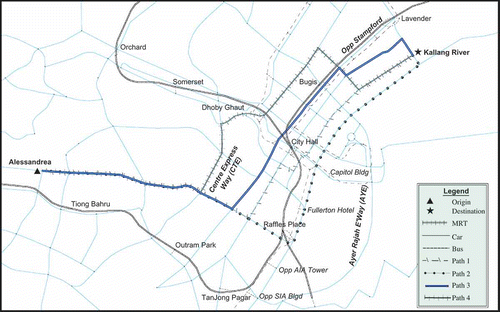
Scenario 1 – Route choices in terms of distance and different start times
This scenario considered the route choice between the same OD, but with different criteria (e.g., least distance with different departure times) and the traveler in this case was assumed to be a car user. The selected ODs were the Alessandrea and Kallang River. and illustrate the results. Path 1 is the route with the least distance. The travel time of path 1 was calculated at the average speed of 52 km/h. Paths 2–4 indicate the dynamic routing was generated by least travel time, but with different departure times. Comparing these four paths, it is apparent that the travel distance of paths 2–4 was longer than that of path 1. However, path 1 took less time because dynamic routing took real-time traffic information into account. This routing method was especially reliable in path 2 when the Centre Express Way was chosen.
Table 6. Scenario 1 – Route choices in terms of distance and different start times
Scenario 2 – Route choices by different mode combinations
Scenario 2 examined the route choice combining different modes. As shown in and , the selected ODs were AIA Tower and Stamford Primary School. Three routes were found with the same departure time (7:00) and OD, but with different mode combinations. Paths 1 and 2 illustrate the common combinations: MRT and bus, and bus and bus. Upon comparing the results it was found that path 1 was much faster than path 2 and that the fare of path 1 was slightly higher than that of path 2. It indicates that taking the MRT is the most effective method without compromising the economy of travel very much. Path 3 illustrates a special combination which employed three modes (i.e., car, MRT, and bus). A parent was assumed to depart to office from opposite AIA Tower to City Hall and that the parent could take the child only till City Hall rather than to the child's school (Stamford Primary School). Path 3 offered a strategy for the child to use public transport after he left his parents’ car at City Hall. In other words, after alighting from the car, the child transferred to the MRT and alighted at Bugis station and transferred to Bus 133, which took him to the bus stop Stamford Primary School. This is an excellent illustration of how a multimodal routing strategy was conducted.
Table 7. Scenario 2 – Route choices in terms of different mode combinations
Figure 7. Scenario 2 – Route choices in terms of a combination of different modes. MRT, mass railway transit.
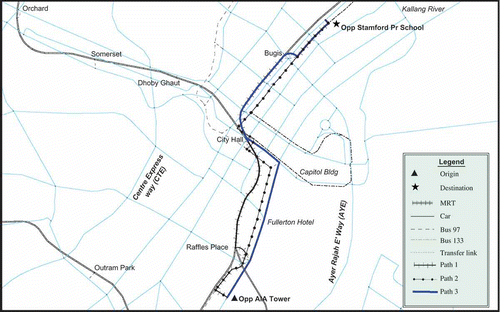
The results of Scenario 2 show that between the same OD and departure time, taking the bus is usually the most economic choice, yet the total travel time may increase drastically. Generally, combining the MRT and bus travel is the most economical and time-saving alternative. Path 3 is a special case that would hardly ever occur, yet it can still be seen that combining the three traffic modes is not the best choice, at least in this case. Actually, switching between three different modes within the urban area will waste time due to switching and result in greater travel costs.
Scenario 3 – Route choices in terms of different general costs
The last scenario focused on the multicriteria route choice with different sets of weights, as the pair-wise comparison matrix in the AHP was defined subjectively by different users. This indicates that individual commuters may have varying preferences. As shown in and , the selected ODs were Orchard MRT Station and Suntec City Mall. The selection of path 1 was based on the generalized cost as calculated in . As the combination of MRT and bus was very common, the result can be assumed to be logically grounded. Path 2 privileged the travel time factor, thus rendering the car mode as the only optimal choice (i.e., users taking a taxi). Path 3 privileged the least fare and consequently, only the MRT was selected as the optimal mode. The apparent choice for the rest of the route was to walk, as the walk from the City Hall MRT to the destination took less than 10 min.
Table 8. Scenario 3 – Route choices obtained in terms of different general costs
Figure 8. Scenario 3 – Route choices obtained in terms of different general costs. MRT, mass railway transit.
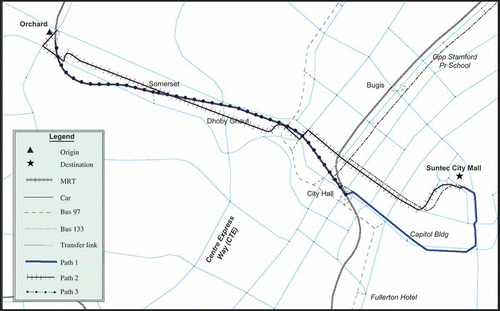
It can also be seen that the generalized costs calculated resulted in a compromised route choice. The travel time and cost of path 1 were between the least-time and least-cost routing of paths 2 and 3. As a result, the route choice obtained by calculating the generalized costs can generally satisfy the traveler's requirements. Compared with the results of Scenario 2, it can be seen that in the urban traffic environment of Singapore, combining MRT and bus travel is the optimal choice.
6. Conclusion
This article presented a novel approach to route selection involving multiple criteria across multimodal transportation networks. This approach was implemented using a GIS environment integrated with a traffic simulation system. The traffic simulation system mimicked the behavior of different modes of transport, thus enabling the procurement of traffic information in real time. Based on the dynamic traffic conditions, a dynamic routing algorithm was devised and applied successfully in a case study. With the aid of the AHP, the multicriteria routing can be realized. As can be seen from the results, the proposed approach aids travelers in making a more comprehensive and preferable route choice.
The prototype developed exhibits immense potential in providing the public with real-time route guidance. This could very well lead to a personalized travel planner that can assist travelers in planning an itinerary for multiple visits based on individual preference. The benefits of such a model and the system will be further explored.
Acknowledgement
The financial support from the Hong Kong Research Grant Council (RGC) through grant number GRF CUHK 444107 is gratefully acknowledged.
References
- Cameron , G. and Duncan , G. 1996 . PARAMICS – parallel microscopic simulation of road traffic . The Journal of Supercomputing , 10 ( 1 ) : 25 – 33 .
- Chabini , I. 1999 . Discrete dynamic shortest path problems in transportation applications: complexity and algorithm with optimal run time . Transportation Research Record , 1654 : 170 – 174 .
- Chee , H.H. 2003 . Multi-objective route selection for tourists , Singapore : Department of Engineering, National University of Singapore . Bachelor thesis
- Chowdhury , M.A. and Sadek , A. 2003 . Fundamentals of intelligent transportation systems planning , Boston, MA : Artech House .
- Dial , R.B. , Rutherford , G.S. and Quillian , L. 1979 . Transit network analysis , Springfield, VA : INET, DOT, UMTA .
- Dijkstra , E.W. 1959 . A note on two problems in connection with graphs , 269 – 271 . Amsterdam, The Netherlands : Numeriche Mathematik .
- Goodchild , M.F. 2005 . “ GIS and modeling overview (Chapter 1) ” . In GIS, spatial analysis, and modeling , Edited by: Maguire , D.J. , Batty , M. and Goodchild , M.F. 1 – 17 . Redlands, CA : ESRI Press .
- Lewis , S. 1990 . Use of geographical information systems in transportation modeling . ITE Journal , 60 : 34 – 38 .
- Li , Y.T. , Huang , B. and Lee , D.H. July 2003 2003 . An integrated GIS and traffic simulation system for multi-modal route choice , July 2003 , 1 – 4 . Taiwan : ITS Asia/Pacific Forum . [CD-ROM]
- Menson , C. 2000 . Level of service for pedestrians . ITE Journal , 70 ( 9 ) : 26 – 30 .
- Mighty , Mind . 2003 . Singapore bus guide , Singapore : Mighty Minds Publishing .
- Miller , H.J. and Shaw , S.L. 2001 . Geographic information systems for transportation: principles and applications , New York : Oxford University Press .
- National Commission on Intermodal Transportation (NCIT) . 1994 . Towards a national intermodal transportation system. Final report to Congress , Washington, DC : US Department of Transportation .
- Nyerges , T. 1992 . Coupling GIS and spatial analytic models . Proceedings of 5th international spatial data handling conference . August 1992 1–7 1992 , Charleston, SC. pp. 534 – 543 . International Geographical Union .
- Saaty , T.S. 1980 . The analytic hierarchy process , New York : McGraw-Hill .
- Saaty , T.S. 1994 . Highlights and critical points in the theory and application of the analytic hierarchy process . European Journal of Operational Research , 74 : 426 – 447 .
- Sheffi , Y. 1985 . Urban transportation networks: equilibrium analysis with mathematical programming methods , Englewood Cliffs, NJ : Prentice-Hall .
- Singapore Land Authority (SLA) . 2005 . Singapore street directory , 21st , Singapore : SingTel Yellow Pages .
- Singapore Mass Rapid Transit Corporation Ltd. (SMRT), 2005. Service performance [online] http://www.smrtcorp.com/smrt/index_message.htm (http://www.smrtcorp.com/smrt/index_message.htm) (Accessed: 20 June 2005 ).
- Thill , J.-C. 2000 . Geographic information systems for transportation in perspective . Transportation Research Part C , 8 : 3 – 12 .
- Yu , H.B. 2000 . Data organization for routing on the multi-modal public transportation system: a GIS-T prototype of Hong Kong , Hong Kong : Department of Geography and Resource Management, The Chinese University of Hong Kong . Thesis (M Phil)
- Ziliaskopoulos , A. and Wardell , W. 2000 . An intermodal optimum path algorithm for multimodal networks with dynamic arc travel times and switching delays . European Journal of Operational Research , 125 : 486 – 502 .
