Abstract
The author analyzed previous development and current state of the art of cartography on the background of latest scientific results coming with improvement of virtual geographic environments. Cartography has been influenced by development of information and communication technologies and geographical thinking. The strongest and most visible contemporary streams in cartography and geographic information systems are the existence and use of Web 2.0, which supports Web-based services for many people all around the world and fast development of crowd-sourcing allowing collection of voluntary information. The author deals with the current position of cartography which is influenced by progressively new environment, especially realization of idea of spatial information infrastructures through projects such as Global Monitoring for Environment and Security, Infrastructure for Spatial Information in Europe or Shared Environmental Information System, and others. New achievements of ubiquitous cartography, especially adaptive and context mapping are overviewed as well. The article also highlights virtual environments and explains immersive, perception, and interaction aspects. Basics of neo-geography and volunteer geographic information are also described. The core of this article includes analyses, ideas, and considerations of cartographical challenges in virtual geographic environment era. The author delimits the so-called inner and outer development of cartography. The former deals with selective aspects of contemporary cartography development, such as user interface and cartographic generalization streams. The latter deals with development of three-dimensional maps and models in cartography, new and still hypothetical investigations of recognition, and possible use of cognitive styles in cartography. The last part of the article is devoted to the role of cartography in realization of the concepts of spatially enabled society and digital earth.
1. Introduction
Cartography is an age-old activity, with the first drawings dating back to 24,000 bc (south Moravia, Czech Republic) or 12,000 bc (the Ukraine). Although there is some doubt over the accuracy of these European assertions, there is more agreement over the Chinese, cadastral map from 2000 bc and Catal Huyuk city in Anatolia, Turkey, dating back to 7200 bc.
Cartography was originally an instinctive science, which today has entered a new, revolutionary period in its development. In the modern approach, mapping is understood as the ability to create a knowledge frame of an environment in space. Although it is in principle cognitive, cartography has traditionally transmitted knowledge mostly with the use of paper products that expressed geospatial ideas and allowed storage and transfer of spatial information. With the passage of time, maps have been used for research and analyses of increasingly complex spatial problems in scientific work and in society. Paper maps have many positive features, and over the centuries they have been able to derive benefit from technological development. However, until recently, all paper maps lacked the dynamic and interactive flexibility of their cognitive alternatives (Wood Citation2003, Konecny and Ormeling Citation2005). After an evolution lasting for many centuries, cartography has reached the status of a discipline that helps to understand the geography of the world. The development of cognitive mapping based on the perception of the environment and the perception mediated by cartographic products, or in other words the creation of maps and the use of maps, have evolved separately for centuries.
Computer technology began to influence cartography from the mid-twentieth century. Today, geographic information systems (GIS) support a wide range of spatial projects; however, creation of maps remains the independent and dominant conception. GIS have not replaced cartography; they have equipped it with exceptionally successful technologies providing a higher level of perfection and efficiency. GIS started the process of geoinformatization of cartography (Konecny Citation2008). Most geographic (spatial) information is geo-referenced. Cartographic visualization plays an important role in the user's orientation. Visualization is not an isolated element of the information transfer process; it depends on the status of source databases, decision-supporting models, and behavior and the needs of the user.
Public and private organizations gradually shift their focus from collection of data to their utilization in varied applications. Use of existing data, verification of their timeliness and integrity, analysis of their quality, interpretation, representation, and implementation of user access are currently the key requirements placed on the scientific community by the administration bodies that maintain these databases.
Today, cartography is influenced by the latest technological advances, in which GIS are strongly linked with spatial information infrastructures (SDIs) and various information and communication technologies (ICT) to provide services to millions of users.
Characterizing contemporary state of the art of GIS, Dangermond (Citation2009, p. i) notes that much of this revolution has been driven by miniaturization and exponentially increasing speed of computer hardware, specifically memory, which has led to a massive proliferation of machines, from handheld devices to various kinds of supercomputer. But dissemination is also driven by the convergence of computers and communications where computer hardware, software, and data are increasingly accessible from remote locations and where the network is all that is important in accessing these resources. In this, mapping and GIS play an increasingly important role. The development of systems at many different levels, from research and professional use to routine queries by non-expert users who require map data, represent a burgeoning of map-based technologies that are beginning to empower many groups that hitherto have not been exposed to geographic information.
The strongest and most visible contemporary streams in cartography and GIS are the existence and use of Web 2.0 supporting Web-based services for many people all around the world and fast developing crowd-sourcing allowing collection of voluntary information.
2. Contemporary cartography
The International Cartographic Association (ICA) is the global authoritative organization for cartographers. The ICA has a strategic plan, which recognized five operating environments of cartography: science and technology, education, professional practice, society (social and organizational), and art. Cartographers aim at being able to apply scientific knowledge for society's everyday needs, for use in the realization of the ideas of sustainable development, risk situations, economic development, and many other situations.
Cartography is increasing efforts to be visible and – in specific cartographical aspects – the leading part of the global GI community; to be prepared to deliver data and information emanating from different sources, especially from National Spatial Data Infrastructures or global spatial data projects, by cartographical means to users with different skills and experience; to be part of many g-processes and e-processes that are so visible and well-articulated in the contemporary world. Among other very important roles, the ICA also sees itself taking part in solving a wide spectrum of activities linked with the United Nations Millennium Development Goals and helping to provide solutions for global, regional, and local problems such as poverty, sustainable development, early warning, disaster management, disaster reduction, security and safety, and other related topics. Cartography uses conventional and modern digital methods and many technologies coming from ICT and new media, such as Google. Contemporary cartography is developing and improving cartographical and geographical thinking, which is so important for analyzing the needs of the contemporary world and finding optimal solutions for the decision-making process (Konecny Citation2008).
2.1. Cartography and geoinformatics in the SDIs, SESs, and DE world
The characteristics of cartography and the GI community are changing according to advancing technology and the development of new ideas, including geographical thinking. For example, new techniques such as Google, Web Maps, GI portals, and others have influenced the development of cartography in recent years. Cartography also deals with qualitatively new conditions related to the existence of spatial information infrastructures (SDIs) and helps to realize and complete new social concepts such as Spatially Enabled Societies (SESs) or Digital Earth (DE).
Today, we are able to provide enormous volumes of geospatial information, on the basis of which we can take better-informed decisions for the use of natural resources, for environmental protection, or for managing disasters and their after-effects. However, we are only able to use them if they fit our concepts, if we understand them properly, and if they have been tailored to our needs. It is not enough to build the technical infrastructure without teaching the population how to use the maps, be they in analog or digital form. We have to provide the concepts with which the population is able to deal with geospatial information, and we have to provide maps from which the population is able to derive the information they need: information that is up-to-date and tailor-made for problem-solving (Konecny and Ormeling Citation2005).
Currently, the potential of cartography to offer new information, knowledge, and sometimes also wisdom is increasing. But still we see undervaluation of GI and mapping possibilities, especially during disasters. The recent Fukushima nuclear power plant tragedy, Hurricane Katrina, the Wenchuan earthquake, and the Indian Ocean tsunami in 2004 are evidence of the lack of spatial information that could improve the decision-making process and the lack of development in basic approaches of how GI and cartographical models can help in such situations. In the United States, Europe, and other places, governments deal with the idea of the emergency management cycle. However, we can find only a few publications dealing in detail with role of GI and cartography in crisis management situations (NRC Citation2007, Mulickova and Kubicek Citation2011).
Another example is cartography-based research of medical problems and discovery of new knowledge about prevalence and mortality, new relations, and models working with certain probabilities, which allow not only improvement of treatment methods for different types of diseases such as cancer but also help in planning and allocation of corresponding funding to prevent the spread of various diseases. Transformation of the earth into a ‘global village‘ brings advantages and disadvantages. One of the disadvantages is the risk of a pandemic outbreak of a contagious disease in a world where global travel has become a possibility for millions and the time spent in traveling from one continent to another can be as little as a few hours. In this situation, it is very difficult to stop the spread of any epidemic. In a pandemic situation, decisions must be taken and acted upon in a short time. Accessible and accurate data are required for accurate decision-making (Stampach et al. Citation2010a). GIS and spatial analysis play important roles in the management of crises such as pandemic situations. They allow, for example, the modeling of the likely spread of a disease or the localization of emergency infrastructures. Cartography and maps can be used for the monitoring, prediction, and analysis of a situation in space as well as in time.
Not only pandemic outbreaks but also lifestyle-related diseases, such as some cancers and type 2 diabetes, are threats to our modern society, economy, and well-being (Geryk et al. Citation2008, Konecny et al. Citation2008, Geryk et al. Citation2010, Stampach et al. Citation2010b).
Cartographical visualization is a possible method for presentation of health statistics. A good map is more interesting and visually pleasing to the user than a table with numbers. Cartography can also be used for monitoring and analyzing a situation – in space as well as in time. During the past 20 years, maps have been created mostly by computers and cartographic software. At the present time, more and more medical information is published over the Internet and visualized in a different cartographic manner.
2.2. Ubiquitous cartography
The idea of ubiquitous mapping was developed by Takashi Morita (Citation2004). There is an evident shift in the requests from base map to thematic map, to shape or develop new elements of cartographic language, especially for mobile tools; moreover, improvements in principles, rules, and methods of visual communication are ongoing. The development of digital cartography is strongly influenced by ICT and vice versa; digital cartography is enhancing efforts to play a more important role in the information/knowledge society environment. There is an evident integration of map makers and map users and new fields of cartography enhancing the shift from analog maps to ubiquitous mapping. To solve a problem one has to define it, make strategic planning how to solve it and how to derive a solution. The research agenda for this (Morita Citation2004, Konecny and Hrebicek 2007) contains the following points:
| • | Generation of personalized maps according to the objective and spatial context. | ||||
| • | Mapping system development considering participation, collaboration, and partnership of users. | ||||
| • | Cross-cultural comparative studies to clarify similarities and differences between ubiquitous mapping implementations. | ||||
| • | Consider information security and privacy. | ||||
Morita also adds that ubiquitous mapping aims to realize technical solutions for map creation and use to predict the effect on society, and ubiquitous mapping accelerates, facilitates, and stimulates the universal nature of map creation and use through the application of advanced information technologies.
GI technologies allow real-time dynamic change of symbolic and map content. Contrary to analog map where production time leads to universality and maximum information saturation, today we can produce maps for unique users and situations with the proper amount information (Hrebicek and Konecny Citation2007).
Our research team participates in the development of adaptive and context cartography principles supporting ubiquitous cartography. The principles of adaptive cartography as formulated by Konecny and Stanek (Citation2010) are as follows: technological advances related to computer science have dramatically changed the cartographic procedures. New methods of geographic data acquisition and graphic design speed up the creation of maps and allow the generation of huge amounts of alternative representations. New electronic media for map publishing enhance interactivity of users and change the traditional, one-directional map information transmission. Traditional cartography has focused on providing maximum information to a broad community of map readers. These changes have led to the adoption of a progressively wider approach to digital data and hence to the individualization of cartography, that is, maps that are more focused on individual users and needs.
‘Map individualization‘ is the essential characteristic of adaptive cartography. In 2003, for the first time, the term, ‘adaptive map‘ appeared in connection with mobile maps (Reichenbacher Citation2003, Sarjakoski and Nivala Citation2003). The term, ‘Adaptive Cartography’ is used to describe a set of approaches aiming to create specifically focused variants of cartographically correct representations from the same geodata source (this source can constitute a hub for heterogeneous data resources). A specifically designed map representation is determined by the map's context. The term, ‘context’ refers to a set of parameters describing the purpose of geodata usage, environment (e.g., decision-making conditions), and user characteristics and needs, for example, the user's skills and ability to use geodata, maps, and charts, etc.
Adaptive cartography is useful in many cartographic fields, but has an especially important role in the areas of ubiquitous cartography and pervasive (sensor) mapping (Morita Citation2004, Hrebicek and Konecny Citation2007). The most important aspects of adaptive cartography are ()
| • | Task orientation – Its arrangement and presentation of map content to a level of detail and symbolization that reflects needs for the representation of geoinformation ready for user decision in whatever tasks he or she may have, so that any definitions of context begin with definitions of tasks. Figure 1. Examples of changes in visualization according to change of context (Staněk et al. Citation2007). 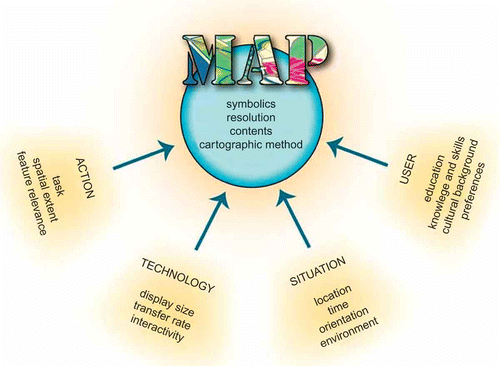 | ||||
| • | User orientation – Any cartographic method applied and symbols adopted should reflect the user skills and customs. | ||||
| • | Portrayal environment awareness – The symbolization and the level of detail should be appropriate to the hardware/software displays of maps and the surrounding conditions in which each map is being used. | ||||
| • | Portrayal homogeneity – The heterogeneous data resources are uniformly represented. This allows quick browsing for geoinformation and easy visual comparison of geodata. Necessary prerequisites for such portrayal are ontological description, ontological thesauri, and deterministic automated cartographic generalization (see also Hrebicek and Konecny Citation2007). | ||||
3. Virtual environments
Development in the fields of virtual realities (VRs) generally and virtual geographic environments (VGEs) in particular is a new and very important challenge resulting from the above-described trends. In particular, the concept of VGEs formulated in the new book by Hui Lin and Michael Batty (Citation2009a) describes the most current and progressive influence for development of all fields dealing with geographic information, including cartography and GIS. They include the strong potential methodological and technological capacity of new media, which can be used for future integration in the fields of cartography and GIS.
Lin and Batty (Citation2009a, p. iii) state that, ‘Virtual Geographic Environments build on the development of GIS and geographic information science in ways that focus on how users are able to embed themselves within such systems. VGEs thus constitute environments in which the user interacts with the geographical or spatial system of interest through immersion in its spatial representation, the methods used to model it, and the processes used to utilize such environments in problem-solving. Virtual Reality (VR) Technologies, computer-aided design (CAD), games, animations, movies, indeed the whole plethora of multimedia with geo-coded data and geo-process models, can be enlisted to enrich and extend such environments.’
The key word ‘immersion’ is defined by J. Nechvatal (1999) as the state of consciousness where an immersant's awareness of physical self is diminished or lost by being surrounded in an engrossing total environment, often artificial. This mental state is frequently accompanied with spatial excess, intense focus, a distorted sense of time, and effortless action. The term is widely used for describing immersive VR, installation art, and video games, but it is not clear if people are using the same word consistently. The term is also cited as a frequently used buzzword, in which case its meaning is intentionally vague, but carries the connotation of being particularly engrossing.
Staffan Björk and Jussi Holopainen (Citation2004) in Patterns in Game Design divide immersion into similar categories, and call them sensory-motoric immersion, cognitive immersion, and emotional immersion. In addition to these, they add a new category of spatial immersion. Spatial immersion occurs when a player feels the simulated world is perceptually convincing. The player feels that he or she is really ‘there’ and that a simulated world looks and feels ‘real.’
3.1. Immersive digital environments
An immersive digital environment is an artificial, interactive, computer-created scene, or ‘world’ within which users can immerse themselves. Immersive digital environments could be thought of as synonymous with VR, but without the implication that actual ‘reality’ is being simulated. An immersive digital environment could be a model of reality, but it could be also a complete fantasy user interface or abstraction, as long as the user of the environment is immersed within it. The definition of immersion is wide and variable, but here it is assumed to mean simply that the users feel like they are part of the simulated ‘universe.’ The success with which an immersive digital environment can actually immerse the user is dependent on many factors, including believable three-dimensional computer graphics, surround sound, interactive user-input, and other factors such as simplicity, functionality, and potential for enjoyment. New technologies that claim to bring realistic environmental effects to the players’ environment such as wind, seat vibration, and ambient lighting are currently under development.
3.2. Another important term is perception
To create a sense of full immersion, the five senses (sight, sound, touch, smell, and taste) must perceive the digital environment to be physically real. Immersive technology can perceptually fool the senses through panoramic three-dimensional displays (visual), surround-sound acoustics (auditory), haptics and force feedback (tactile), smell replication (olfactory), and taste replication (gustation).
3.3. Interaction
Once the senses reach a sufficient belief that the digital environment is real, the user must then be able to interact with the environment in a natural, intuitive manner. Various immersive technologies, such as gestural controls, motion tracking, and computer vision, respond to the user's actions and movements. Brain control interfaces respond to the user's brainwave activity.
The sensation of total immersion in VR can be described as implied complete presence within an insinuated space of a virtual surroundings where everything within that sphere relates necessarily to the proposed ‘reality’ of that world's cyberspace and where the immersant is seemingly altogether disconnected from exterior physical space.
With the movement of GIS technologies to the Web and design of Web-based services as well as grid and cloud computing applications organized around highly decentralized and seamless interactions between remote servers and various clients, the notion of the geographic environment has become important in terms of the way users might interact with the system and with each other becoming central to the use of VR technologies of various kinds.
3.4. Neo-geography and volunteer geographic information
With the new technologies and new research approaches influenced by changes in behavior of societies, two new terms appeared: neo-geography and volunteer geographic information (VGI), which also gave new impulses and potential to cartography.
According to Papadimitriou (Citation2010) ‘Neo-geography provides the link between the science of geography and digital art. The carriers of these links are geospatial technologies (global navigation satellite systems such as the global positioning systems, GIS, and satellite imagery) along with ubiquitous information and communication technologies (such as mobile telephony and the Internet). Neo-geography constitutes a vibrant new field of interaction between geography, geospatial technologies and digital art, capable of gradually transforming the everyday experience of exploration and perception of the geographical space into an art form of its own, to the extent that we may need a neo-geographical education, “particularly for adult learners.” ’
Goodchild (Citation2009, p. 18) describes VGI as ‘The terms, “crowdsourcing” and “collective intelligence” draw attention to the notion that the collective contribution of a number of individuals may be more reliable than those of any one individual. The term VGI refers specifically to geographic information and to the contrast between the actions of amateurs and those of authoritative agencies.’ The term asserted that geographic information draws attention to the fact that such information is not subject to the normal checks and quality control mechanisms of those agencies, while neo-geography emphasizes the contrast between the grass-roots phenomenon and the current state of the academic discipline of geography.
4. Cartographical challenges in VGE era
Cartography is and remains a form of literacy (similar to writing), helping us to understand spatial context of phenomena in the real world through visual messages. The cartographical symbol system, like the linguistic system of Esperanto, very often does not need translation and this makes cartography understandable for many people coming from different nations. It is a substantial part of natural and social sciences with a role similar to statistics, logic, and even more closely to scientific visualization. Cartography as a science (used for many centuries but defined as a science in 1921 by Max Eckert) created its own methodology of elaboration of data, information, and mainly knowledge about space. Classical cartography was, in some way, a recursive science following thousands of years of cartographic production based on flat representation of spatial relationships.
4.1. Inner development of cartography
VGE comes with many impulses for the development of cartography in connection to GI science and represents the newest challenge for cartography. Cartography urgently needs to design a new theory of development here due to the necessity to enhance traditional or create new approaches allowing cartographers to use latest technologies and formulate the role of cartography in such an environment. As mentioned in Friedmannova and Stanek (Citation2010), ‘Cartography has a long tradition of visual representation of spatial knowledge. There are verified mechanisms how to deal with graphic variables of symbols, how to generalize symbol arrangement etc. Nevertheless, there is always a necessity to confirm cognitive mechanisms in the new environment due the fact, that not everything can be transferred. New environments have abilities which make them attractive and usable, the enforcement of the look and handling mechanisms of traditional maps has usually detrimental consequences.’
There are many important areas such as user interface, graphic variables, generalization, data integration, context formalization, influence of cognitive sciences, and ethics of VGI, etc. The next section will comment on several of these and on cartographic visualization and projects.
4.1.1. User interface
VGEs are built on the foundations of GIS and in geographic information science considerable attention is paid to the users in terms of the manner in which they interact with the software (Lin and Batty Citation2009b, p. 1). User interaction is thus a key component of such systems. They can range from systems designed for professional and scientific use, where spatial analytic functions are dominant, all the way to systems which aim to popularize and disseminate information about geographical events in different scales.
The degree to which users are immersed in such systems defines major differences between VGEs. The aforementioned authors divided contemporary VGEs into four key areas (p. 2): virtual cities and virtual landscapes; user interfaces and immersion; games and virtual works; Web 2.0 technologies, DE and neo-geography. The second and the fourth circles of problems, in particular, are remarkably influential in contemporary development in cartography.
Lin and Batty (Citation2009b, p. 2) define VGE as an environment that is explicitly geographical but into which users are more deeply embedded in terms of the experiences they require than those which have hitherto characterized the uses of GIS. Spatial modeling, geovisualization, and human vision are fundamental components of VGEs (Meng Citation2009, p. 135). In current VGEs, geovisualization typically performs a twofold task:
| • | To create a display surface onto which a symbolized subset of digital geographic concepts are projected, and | ||||
| • | To provide an interface for the user's access to secondary information that is either embedded in or related to the graphic symbols. | ||||
In the former case, the communication of geoinformation starts with eye contact, that is, by seeing. The comprehension of what has been visually attended relies on an agreed visual literacy between the designer and the user. Developing such a visual literacy has been a constant research focus of cartographic semiotics. In the latter case, however, geoinformation is essentially communicated and comprehended by means of user interactions that require seeing and doing at the same time.
Meng (Citation2005, 2009) also highlighted that continuously evolving multimedia technologies and the steadily increasing computing performance during recent decades have led to a dramatic expansion of design freedom of geovisualization. Not only has the number of elementary graphic variables defined by Bertin (Citation1967, Citation2011) more than tripled, but many design patterns dedicated to satisfying constraints concerned with areas such as server–client architecture, storage capacity, rendering speed, display size, and user's memory load have been implemented.
In addition, the fact that a limited display surface can only accommodate a limited number of recognizable graphic symbols has forced the designer to adopt the ‘Swiss Army Knife’ principle to hide much information beneath the display surface of individual graphic symbols. Apart from ethical concerns, without a smart information-hiding strategy, global platforms such a Google Maps or Microsoft Live Search Maps, which allow the geotagging of micro-blogging services and photo-sharing services like Flicker, may become too cluttered to be useful. However, information-hiding techniques need to be coupled with information-revealing techniques.
Meng (Citation2009) develops ideas to the concept of affordance and reflex depth and their forms in VGEs. His approach is creating a new fundamental approach in cartography connected with GI science and VGEs.
Another important and dynamically developing field of cartography is cartographic generalization.
4.1.2. Cartographic generalization
Zhilin Li (Citation2007a) provided an outlook for the near future of map generalization development. First, digital map generalization will play a central role in digital cartography. In most countries, topographic maps at various scales have been produced. Currently, the most critical problem faced by national mapping agencies is the frequent updating of their map products. An attractive solution is to update maps at smaller scales by deriving information from frequently updated larger-scale maps through automated generalization. Ideally, only one detailed database should be frequently updated and maps at other scales are only updated on demand using that database. In this way, digital map generalization will become increasingly important in cartography.
Second, research on digital map generalization will be shifted from feature level to class and map levels. With the establishment of algorithmic foundation (Li Citation2007b), the geometric transformations for different types of generalization operations can be achieved. These algorithms will be called whenever there is a need and an algorithm may be used for generalization of different types (classes) of features. At the next development stage, these algorithms will be used for the generalization of a class of features, for example, relief, hydrographical features, settlements, and transportation network. At the map level, the effect of generalization on map representation in terms of spatial information has to be clarified. Although some efforts have been made to study such a transformation of information, the problem remains unsolved due to the lack of comprehensive quantitative definitions of spatial information on a digital map.
Third, semi-automated systems for digital map generalization will be widely available in a few years. However, such a system may mainly provide the essential functions for geometric transformations and editing. More intelligent systems will be developed only after the generalization at class level is well studied.
Fourth, digital map generalization will become increasingly important in multi-scale modeling and representation, with widespread use of GIS that integrates multi-scale and multi-source data. Indeed, as early as the 1980s, multi-scale representation was recognized as a fundamental issue in spatial data handling. In 1983, a small group of leading scientists in the United States was convened by NASA to define critical research areas in spatial data handling, and multi-scale representation was identified as one of them. Since then, this topic has become part of the international research agenda in spatial information sciences. Zooming (as in a camera) function, which can be by means of generalization, has been regarded as one of the two most exciting functions in GIS (with the other being overlay). As a result, a number of research projects on this topic have been initiated internationally.
In VGEs, as in two-dimensional cartography, similar (but not identical) generalization operators are involved. The role of simplification is emphasized due to three-dimensional object handling (transmission to device rendering issues) and also due to better orientation of the user in the view area. This simplification involves simplification of three-dimensional object shape, omission of unimportant three-dimensional objects, aggregation of close similar objects, and typification (individual or group one). A less important role is played by the operator of displacement that is much more dissimilar than the aforementioned simplification method, which can be seen as the extension of two-dimensional operators.
Research in this field is quite recent (non-cartographic aspects of three-dimensional simplifications are quite well developed in computer graphics). Most work is focused on generalization of buildings. Forberg (Citation2004) adapts the morphology and curvature space operators of the scale space approach to work on three-dimensional building models. Thiemann and Sester (Citation2004) do a segmentation of the building's boundary surface with the purpose of generating a hierarchical generalization tree. An aggregation approach is proposed by Anders (Citation2005). In Kada (Citation2008), simplification algorithms based on the decomposition of space along the major planes of the building are proposed.
4.2. ‘Outer’ influence of cartography
VGE of course offers another way of sharing and using geographic information in comparison with maps. A map elaborates knowledge about objects, areas, and environments, including that ones coming from virtual environments generally and VGE particularly. One of the dominant VGE abilities is to visualize everything in three-dimensional photo-realistic environment. Bandrova (Citation1997) comments on problems arising from the necessity to create three-dimensional symbols for three-dimensional maps, as well as the requirements for their design. She found the usage of different levels of detail for symbol designing as one of the most important tasks in the creation of such kinds of maps. Her definition of a three-dimensional map is ‘Computer mathematical defined three-dimensional virtual representation of the surface of the Earth or other planet; representation of the objects and phenomena in nature and society. The represented objects and phenomena are classified, designed, and visualized according to concrete aim.’
In 2010, Bandrova described three-dimensional models as giving the possibility to understand and receive knowledge of the real world. An easy, communicative access to users and visualization and manipulation with such maps give the professional cartographers more possibilities to represent spatial information. On the other hand, nonprofessionals and all users not only receive more attractive cartographic products but have in their hands opportunities to manage, add, and extract information (Bandrova and Bonchev Citation2010). It may seem that this approach will solve all problems related to cartographic flat graphical encoding but that is not the case. For example, when we are watching the development of a flood, we see a more realistic process in VGE than we can imagine with the assistance of maps. But to understand context and get a general view, and to also obtain quantitative information about extent of flood, height of water, its pollution level and consistency, and which places will be flooded and when, we still need information to be processed through maps.
Maps are about spatial context. For example, in the case of navigation maps, the user is offered not only one solution but a space of solutions where they can consider which one is appropriate for the given situation. VGEs still need cooperation with them to be able to offer people not only ‘three-dimensional attractions‘ but also models of recognition, understanding, and development of the events we are searching. To add that knowledge to virtual environments, we need maps; in other words, it is a challenge to develop map functions for the virtual world and enrich both worlds (maps and virtual) together. All these worlds and comments prove the point that different users need multidimensional (n-dimensional) maps, multilayer databases, and cartographical visualization and decision-making for different purposes.
Currently, the categorical imperative is in (often immediate) request for understanding of space not with the assistance of paper maps but with electronic tools and devices in VGE. It is necessary to investigate people's behavior and design new skills of space understanding. Cognition of the space is higher and corresponds with improved supportive technological possibilities of space imaginations. Cartography here can be a source for knowledge management practices.
One of the basic questions is how to transfer gained information in the virtual world into contextual spatial knowledge. It is impossible to realize by mechanical transfer of technologies (symbology, classification, etc.) from cartography to VGE. Cartographic science should rather deal with research of cognition in virtual environments and be able to implement new knowledge into the maps, which will be in the position of effective tools for scientific investigation and research. On the other hand, it will also be necessary to transfer functions of cartography, especially the ability to convey spatial knowledge into virtual worlds.
VGE not only offers new media for spatial knowledge transfer but also new ways to handle traditional ones. In the case of cartography, we can principally designate wikimapping and map service mashups. Cartographic science needs to accept the reality of wikimapping and participate in its development. These processes have to begin in schools and in children's education. Modern pupils are familiar with computer games and can imagine space from this point of view, but to improve the skills of combination of knowledge from maps with VGE will be welcomed. Famous Czech scholar, John Amos Comenius (1592–1670), founder of modern pedagogy, who was called ‘the teacher of nations,’ created the doctrine of ‘school by play,’ which now has value in the world that he could probably not have imagined. What is substantial from the point of development of the cartographic education is not to be focused on map use but on map design from the earliest age. That means significant redefinition of this education. Until now, map design education is focused on college students, but primary and secondary schools need a completely different approach. And here, the use of VGE is not only a challenge but also a huge help that may ultimately lead to widespread cartographic literacy into the new societies development concepts (such as SES and DE, etc.). Simulation within VGE will better illustrate principles of cartographic language and, conversely, cartographic knowledge can lead to higher effectiveness in usage of VGE.
But challenges are not limited to the development of new theory and education. In spite of being understood mainly as a science for spatial visualization, cartography also deals with standards and metadata services, modeling, spatial data mining, quality of data, and many other research items. It is also evident that, with the arrival of VGE, users will use cartography less for processing of knowledge about space but more deeply develop methods of elaboration of research results through cartographical visualization in connection with realization of key contemporary projects like Global Monitoring for Environment and Security, Infrastructure for Spatial Information in Europe (INSPIRE), the Group on Earth Observations (GEO), Global Earth Observation System of Systems (GEOSS), and others.
Cartography and VGE both need to continue in the development of ubiquitous mapping, especially in the supportive, contextual, and adaptive areas, which will help cartographers also in VGE to understand the real needs of various users with different cultural and educational backgrounds, skills and abilities, environments and conditions.
4.3. Cognitive styles in cartography
The aforementioned approaches are about creation of maps in the contemporary area of ICT development and the potential provided by the VGEs. However, there is another important area, which is the ability and skills of users or customers to work with maps in the broader sense of the word. A group of Czech cartographers and psychologists improved existing theories of adaptive mapping and started to investigate the so-called cognitive style. The idea of the former is based on the works of Konecny (Citation2008), Friedmannova and Stanek (Citation2010), Konecny and Stanek (Citation2010), Stachoň et al. (Citation2010), and others (see Section 2.2).
The second idea was for the first time described in the paper of M. Konečný et al. (Citationin press), Usability of Selected Base Maps for Crises Management – Users Perspectives. The concept of symbolic representation is a core concept within cognitive science dealing with modes of information representation and processing (Isaksen and Kaufmann Citation1992). The concept of cognitive styles refers to distinction between how different people process information and which form of information presentation they prefer. The measurement of cognitive styles is rooted in the study of perception and personality (Isaksen and Puccio Citation2008).
We can generally hypothesize that if the method of map visualization corresponds with the cognitive style of the specific user, he or she will achieve better results in the map reading. The usefulness of this concept in the cartographic field resides in the possibility of adapting the map visualization to a group of users with defined and known cognitive styles.
The concept of cognitive style is at present still not unambiguously defined and there are many approaches that explore this problem domain from different points of view and different researchers have used a variety of labels for the styles they have investigated.
Riding and Cheema (Citation1991) surveyed approximately 30 different cognitive styles and concluded that most of them measured 2 broad style dimensions: a verbal–imagery dimension (which indicates a preference for representing information using pictures or words) and a wholistic–analytic dimension (which indicates a preference for information to be structured to get the big picture or the detail) ().
Figure 2. Two main dimensions of cognitive style (adapted from Riding and Sadler-Smith Citation1997; Konecny et al. 2011).
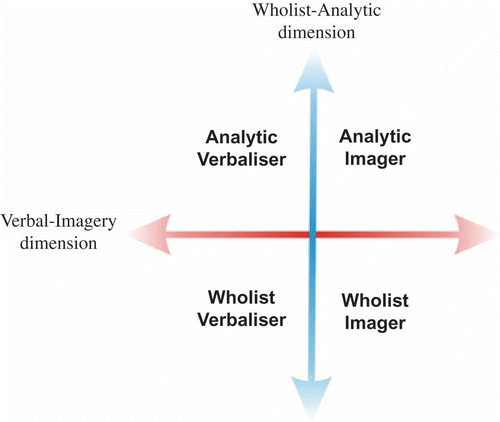
4.3.1. The wholistic–analytic dimensions
‘Wholists’, as the term suggests, tend to see the whole of a situation, have an overall perspective, and appreciate the total context. By contrast, analytics will see the situation as a collection of parts and will often focus on one or two of these at a time, to the exclusion of the others (Rezaei and Katz Citation2004). While the wholist–analytic dimension is concerned with the mode of organization and information arrangement, the verbal–imagery dimension reflects more an individual's habitual mode of representation in memory during thinking. Verbalizers ‘consider’ the information they read, see, or listen to, in words or verbal associations. Imagers, on the other hand, when they read, listen to, or consider information, experience ‘fluent spontaneous and frequent pictorial mental pictures’ (Riding and Sadler-Smith Citation1997).
4.3.2. The verbal-object imagery-spatial imagery dimensions
Blazhenkova and Kozhevnikov (Citation2009) argued that their current study challenges traditional approaches to visual–verbal cognitive style as a unitary bipolar dimension, and instead suggests a new three-dimensional cognitive style model developed on the basis of modern cognitive science theories that distinguish between object imagery, spatial imagery, and verbal dimensions. Object imagers prefer to construct vivid, concrete, and detailed images of individual objects (e.g., visual artists) and spatial imagers prefer to use imagery to schematically represent spatial relations among objects and to perform complex spatial transformations. They developed the Object-Spatial Imagery Questionnaire, which is a self-report questionnaire designed to distinguish between two different types of imagers.
It could be supposed that the transmission of geographic information coded in the visual form will be more effective when the cartographic method of visualization will be in correspondence with the cognitive style of the user. Some kinds of cartographic visualization methods could be characterized more as pictorial, while the others are more schematic. Blazhenkova and Kozhevnikov (Citation2009) offered a tool for measurement of these concepts. We are able to distinguish the preferences of users in the visual information processing with the help of Object-Spatial Imagery Questionnaire.
Integral to the design of cartographic products should be the evaluation of their quality for users. We need to observe how users are dealing with them and study interindividual differences in their operations, which could be caused by different personalities and/or cognitive styles. By comparing and interpreting relative simple data visualized by alternative cartographic methods, we can detect basic differences. Stachoň et al. (Citation2010) used experiments to compare three types of images. Their test consisted of three variants, each using a different cartographic method. Variant A used a choropleth map, variant B used a dot map, and variant C used simple bars. The test shows not only significant differences in reaction times in various tasks but also important differences in mental representation of interpreted events. In other words, identical data visualized by various cartographic methods lead to fundamental, different imaginations about appearance of certain events and therefore to different interpretations of the situation. Such results of the experiments with relatively elementary data create expectations of greater differences in the case of complex tasks based on elaboration of complicated data. Cognitive style expresses itself not only in map reading but also in the manner of orientation in the environment. A field experiment shows remarkably stronger tendencies to ‘object imagers,’ that is, usage of the information from close surroundings in comparison to ‘spatial imagers.’
Differences in perception exist also between inhabitants of various cultural regions. Differences in such perception are evident on the level of most elementary perception processes and it is possible to detect them in monitoring of sensitivity for fallacies. Segall et al. (Citation1966) have studied influence of long-term experience with some different kinds of physical environment (such as dense jungles as opposed to flat land) on visual perception. They found that, for example, Europeans and Americans are more susceptible to Müller–Lyer and the Sander parallelogram illusions. Nisbett et al. (Citation2001) point that not only environment but also culture has fundamental influence on manner of understanding of the world but also perception itself. They point out that there are profound differences in conceptions of the world and also differences in the way of thinking, which we can find when we compare Eastern and Western cultures. The Western way of thinking is described as analytic, whereas the way of thinking of the East Asian nations is considered as more holistic. Other authors, for example, Kitayama et al. (Citation2003) realize cross-cultural studies in which these presumptions are tested by experiments of visual perception. The possibilities to create universal ontology of geographic space or rather the limitations of variability of different cultures as well as individuals are investigated from cartographic and psychological perspectives (Stachoň and Šašinka Citationin press).
5. Geodata projects and new trends: spatially enabled society and digital earth: the role of cartography
One of the most important aspects of contemporary development in cartography and related disciplines is the existence of SDIs and newly oriented and organized geodata projects, such as Global Monitoring for Environment and Security, Infrastructure for Spatial Information in Europe, or Shared Environmental Information System using European examples or GEO and GEOSS on a global scale. Their existence and development create a historically new situation in which data and information are administered by governmental offices over Europe, their quality is guaranteed, standards and metadata created, data specifications elaborated, and access organized in a less expensive way than before. The realization of the above steps is creating a new quality base of geodata in the entire continent with ambitious for future global cooperation.
In the theoretical and practical development, it is important to transfer from the first to the second generation of SDIs. The process is accelerated by the aforementioned processes and by creating a premise for realization of concepts such as SES or DE (Rajabifard et al. Citation2006, Citation2010, Williamson et al. Citation2006, Citation2007).
Successful development of SDIs created a principle base for practical building of new concepts of our societies with higher participation of geographic information, such as SESs or DE.
5.1. Spatially enabled societies
Societies can be regarded as spatially enabled when location and spatial information are regarded as common goods made available to the citizenry and business to encourage creativity and product development (Williamson et al. Citation2006). Rajabifard et al. (Citation2009) describe characteristics of the SESs and list important elements. In such societies, the user is expected to know which datasets are required and to specifically request these and combine them. van der Molen (Citation2007) describes the meaning of SES as two-fold, namely: 1. When the public administration, the private sector, and citizens (the actors in ‘governance’) decide on issues where the spatial component is one of the determinants for those decisions, they need access to spatial information that is relevant and might contribute in a meaningful way to the process of making that decision. 2. Decisions seldom need only one source of information; on the contrary, they tend to require information from many sources. Integration and sparing transforms data and information into meaningful information and services. This cannot be pursued without digital environment.
5.2. Digital earth
The idea of DE was first formulated by US Vice President Al Gore, in a speech written for presentation at the California Science Museum, Los Angeles, in January 1998. Al Gore defined DE as: ‘A multi-resolution, three-dimensional representation of the planet, into which we can embed vast quantities of geo-referenced data.’
DE is a digital format of the earth, and a virtual representation of the earth. It is formed by a system composed of earth observation technology, global positioning system, geographical information system technology, high-performance computing technology, network technology, and VR. Today, DE is an integration of space technology, information technology, and earth science. DE connects public individual ‘mental earth,’ and is directly expressed by virtual representation of the object's information on the earth and its evolution process, and conducts analysis and prediction of the present and future earth scenes. Real earth, mental earth, and DE have interactive connections and will be a basic mode of mankind to understand and explore the earth.
In all the aforementioned approaches, maps, among other tools, are essential to realize the mentioned concepts and to open their potential to the people. The people do not expect pieces of data and information, they expect their elaboration and outputs, which they will be able to understand and work with, either with the help of maps or through VGE, or in the best case with a combination of both.
6. Conclusions
In the previous sections, the author described the contemporary role and development of cartography and its new fields (ubiquitous, adaptive, context cartographies) in the contemporary level of development of science and ICT. Special attention was paid to formulation of the role of cartography in VGE, which is dynamically developed by several teams worldwide. With the continued development of new technologies, cartographers will become a very important part of the process, one which they have been a part of for many years.
Related Research Data
References
- Anders , K.-H. Level of detail generation of 3D building groups by aggregation and typification . Proceedings of the XXII international cartographic conference. A Coruña Local Organizing Committee Produced by Global Congresos and V. Lemp,. CD ISBN 0-958-46093-0 . July 11–16 2005 , A Coruna, Spain.
- Bandrova , T. 1997 . “ Creation of Three-dimensional symbol system ” . In International symposium “modern technologies in cadastre , Edited by: Milev , G. 132 – 138 . Sofia, Bulgaria : Union of Surveyors and Land Managers . in Bulgarian
- Bandrova , T. Bulgarian cartography: from paper to virtual reality . 3rd international conference on cartography and GIS, CD proceedings . Nessebar, Bulgaria. pp. 1314 – 0604 . ISSN .
- Bandrova , T. and Bonchev , S. 3D maps for internet application . 3rd ISDE digital earth summit, CD proceedings . June 12–14 , Nessebar, Bulgaria. ISBN: 978–954–724–039–1
- Bertin , J. 1967 . Sémiologie Graphique: Les Diagrammes, Les Réseaux, Les Cartes , Paris, , France : Gauthier-Villars .
- Bertin , J. 2011 . Semiology of Graphics. Diagrams, Networks, Maps. ESRI Press . ISBN: 9781589482616 , : 436
- Björk , S. and Holopainen , J. 2004 . Patterns in game design , 206 Florence, KY : Charles River Media . ISBN 1584503548
- Blazhenkova , O. and Kozhevnikov , M. 2009 . The new object–spatial–verbal cognitive style model: theory and measurement . Applied Cognitive Psychology , 23 : 638 – 663 .
- Dangermond , J. 2009 . “ The future of GIS and the web. Foreword ” . In Virtual geographic environments , Edited by: Hui , L. and Batty , M. i – ii . Beijing, , China : Science Press, 350 p .
- Forberg , A. 2004 . “ Generalization of 3D building data based on a scale-space approach. Edited by O. Altan ” . In The International archives of the photogrammetry , Vol. XXXV , Istanbul, , Turkey : Remote Sensing and Spatial Information Sciences . Part B
- Friedmannová , L. and Staněk , K. Cartographically augmented reality . The 3rd ISDE digital earth summit – digital earth in the service of society: sharing information, building knowledge – proceedings . Nessebar, Bulgaria. pp. 9 ISDE . 1. vyd. ISBN 978-954-724–039–1
- Geryk , E. 2010 . Cancer multiplicities in the Czech population . Časopis lékařů českých, Prague: Česká lékařská společnost JEP , 149 ( 4 ) ISSN 0008–7335
- Geryk , E. , Dite , P. and Konecny , M. 2008 . “ Epidemiology of gastrointestinal cancers ” . In Gastrosymposium Tallinn 2008 , Estonia : University of Tallinn, 2008 . od s. 12–12, 1s. ISBN 80-902266-9-8.
- Goodchild , M.F. 2009 . “ Virtual Geographic environments as collective constructions ” . In Virtual geographic environments , Edited by: Hui , L. and Batty , M. 15 – 24 . Beijing, , China : Science Press, 350 .
- Hřebíček , J. and Konečný , M. 2007 . “ Introduction to ubiquitous cartography and dynamic geovisualization with implications for disaster/crises management ” . In The geospatial web: How geo-browsers, social software and the web 2.0 are shaping the network society , Edited by: Scharl , A. and Tochtermann , K. London : Springer-Verlag .
- Isaksen, S.G. and Kaufmann, G., 1992. Mode of symbolic representation and cognitive style. Imagination, Cognition, and Personality, 1 (3), 271–277. http://cpsb.com/resources/downloads/public/Symbolic_Representation.pdf (http://cpsb.com/resources/downloads/public/Symbolic_Representation.pdf) (Accessed: 20 April 2010 ).
- Isaksen, S.G. and Puccio, G.J., 2008. Adaption-innovation and the Torrance tests of creative thinking: The level-style issue revisited. The Creative Problem Solving Group, Inc. http://cpsb.com/research/articles/problem-solving-style/KAI-TTCT.html (http://cpsb.com/research/articles/problem-solving-style/KAI-TTCT.html) (Accessed: 15 February 2010 ).
- Kada , M. 2008 . “ Generalization of 3D building models for map-like presentations ” . In The International Archives of the Photogrammetry, Remote Sensing and Spatial Information Sciences, XXXVII, 399ff. Part B2, Commission 2 , Beijing, , China : ISPRS Congress . ISSN 1682–1750
- Kitayama , S. 2003 . Perceiving an object and its context in different cultures: a cultural look at new look . Psychological Science , 14 ( 3 ) : 201 – 206 .
- Konecny , M. 2008 . “ Cartography new perspectives in crises management context ” . In Geography, environment, sustainability , Edited by: Kasimov , N.S. , Koltyakov , V.M. and Vandemotten , Ch. Vol. 1 (1) , 46 – 67 . Moscow : MGU Press .
- Konecny , M. 2008 . Cancer Prevalence in the Czech Republic in 1989–2005–2015 , Brno, , Czech Republic : Faculty of Science, Masaryk University, Brno and Občanské sdružení podpory zdraví a onkologické prevence . 257 s. ISBN 978-80-903255-2–4
- Konečný , M. in press . Usability of selected base maps for crises management – users perspectives . Springer JWF – Applied Geomatics , doi: doi: 10.1007/s12518-011–0053–1
- Konečný , M. and Ormeling , F. The role of cartography in the GSDI world . Proceedings, FIG Working Week and 8th International Conference of the Global Spatial Data Infrastructure (GSDI-8) . April 16–21 2005 , Cairo, Egypt.
- Konečný , M. and Staněk , K. 2010 . Adaptive cartography and geographical education . International Research in Geographical and Environmental Education , 19 ( 1 ) : 75 – 78 .
- Li , Z. 2007a . Digital map generalization at the age of enlightenment: a review of the first forty years . The Cartographic Journal , 44 ( 1 ) : 80 – 93 .
- Li , Z. 2007b . Algorithmic Foundation of Multi-scale Spatial Representation , 281 CRC Press (Taylor & Francis Group) .
- Lin , H. and Batty , M. , eds. 2009a . Virtual geographic environments , 350 Beijing, , China : Science Press .
- Lin , H. and Batty , M. 2009b . Virtual geographic environments “ A primer” , 350 Beijing, , China : Science Press .
- Meng , L. 2005 . Egocentric design of map-based mobile services . The Cartographic Journal , 42 : 5 – 13 .
- Meng , L. 2009 . “ Affordance and reflex level of geovisualizattion ” . In Virtual geographic environments”A primer” , Edited by: Hui , L. and Batty , M. 136 – 150 . Beijing, , China : Science Press .
- Molen , P.v.d . 2007 . “ E-government and e-land administration in order to spatially enable a society ” . In Towards a spatially enabled society , Edited by: Rajabifard , A. 43 – 58 . Melbourne : Melbourne University .
- Morita, T., 2004. Ubiquitous mapping in Tokyo. International joint workshop on ubiquitous, pervasive and internet mapping (UPIMap2004), Tokyo, Japan. http://www.ubimap.net/upimap2004/html/papers/UPIMap04-A-01-Morita.pdf (http://www.ubimap.net/upimap2004/html/papers/UPIMap04-A-01-Morita.pdf) (Accessed: 7 September 2004 ).
- Mulíčková , E. and Kubíček , P. 2011 . “ Definition of cartographic context in emergency management - conceptual framework of the pilot study flood ” . In Proceedings of the international conference on military technologies 2011 (ICMT’11) , Edited by: Jalovecký , R. and Štefek , A. 1331 – 1338 . Brno, Czech Republic : University of Defence . ISBN 978-80-7231-788–2
- NRC (National Research Council) . 2007 . Successful response starts with a map. Improving geospatial support for disaster management. NRC of the National Academies , 184 Washington, DC : The National Academic Press . ISBN-10: 0–309–10340–1
- Nisbett , R.E. 2001 . Culture and systems of thought: holistic vs. analytic cognition . Psychological Review , 108 ( 2 ) : 291 – 310 .
- Papadimitriou , F. February 2010 . “ A., “Neogeographical Education”? The Geospatial Web, GIS and Digital Art in Adult Education ” . In International Research in Geographical and Environmental Education. Vol. 19, No 1 , Edited by: Lidstone , J. and Stoltman , J. February , 71 – 74 . London : Routledge, Taylor & Francis . ISSN: 1038-2046 print/1747-7611 online
- Rajabifard , A. , Crompvoets , J. , Kalantari , M. and Kok , Bas . 15–19 June 2009 . “ Spatially Enabled Societies. Chapter 1, pp. 15–25 ” . In GSDI 11 world 1010 conference , Edited by: Rajabifard , A. , Crompvoets , J. , Kalantari , M. and Bas Kok . 15–19 June , 248 Rotterdam, , The Netherlands. Edited by : GSDI Association and Leuven University Press . ISBN 978 90 5867 851 5.
- Rajabifard , A. , Crompvoets , J. , Kalantari , M. and Kok , B. , eds. 2010 . Spatially enabling society. Research, emerging trends and critical assessment , 246 Belgium : Leuven University Press .
- Rajabifard , A. 2006 . The role of subnational government and the private sector in future spatial data infrastructures . International Journal of GIS , 20 ( 7 ) : 727 – 741 .
- Reichenbacher , T. Adaptive methods for mobile cartography . 21st international cartographic conference . August 10–16 2003 , Durban, South Africa.
- Rezaei , A.R. and Katz , L . 2004 . Evaluation of the reliability and validity of the cognitive styles analysis . Personality and Individual Differences , 36 : 1317 – 1327 .
- Riding , R. and Cheema , I. 1991 . Cognitive styles – an overview and integration . Educational Psychology , 11 : 193 – 215 .
- Riding , R.J. and Sadler-Smith , E. 1997 . Cognitive style and learning strategies: some implications for training design . International Journal of Training and Development , 1 ( 3 ) : 199 – 208 .
- Sarjakoski , L.T. and Nivala , A.-M. 2003 . “ Context-aware maps in mobile devices ” . In Perspectives on intelligent user interfaces , Edited by: Salovaara , A. , Kuoppala , H. and Nieminen , M. 112 – 133 . Espoo, , Finland : Helsinki University of Technology Software Business and Engineering Institute, Technical Reports 1, HUT-SoberIT-C1 .
- Segall , M.H. , Campbell , D.T. and Herskovits , M.J. 1966 . The influence of culture on visual perception , Indianapolis : Bobbs-Merrill .
- Stachoň , Z. and Šašinka , Č. in press . Human cognition: people in the world and world in their minds . Towards a universal ontology of geographic space. ,
- Stachoň , Z. , Šašinka , Č. and Talhofer , V. 2010 . “ Perception of various cartographic representation under specific condition ” . In Geographic information and cartography for risk and crisis management – towards better solutions , Edited by: Konečný , M. , Zlatanova , S. and Bandrova , T.L. 349 – 361 . Berlin : Springer .
- Stampach , R. 2010a . “ Dynamic cartographic methods for visualization of health statistics ” . In Cartography in Central and Eastern Europe , Berlin : Springer, Lecture Notes in Geoinformation and Cartography . ISBN 978-3-642-03293–6
- Štampach , R. , Kubíček , P. and Geryk , E. 2010b . “ Cartographic aspects of health databases visualization in global context ” . In 3rd ISDE digital earth summit , Sofia, Bulgaria : University of Architecture, Civil Engineering and Geodesy . 10 s. ISBN 978-954-724–039–1
- Staněk , K. , Konečný , M. and Friedmannová , L. 2007 . “ An adaptive cartographic visualization for support of the crisis management ” . In XXIII international cartographic conference – cartography for everyone and for you , Moscow : Roskartografija . od s. 1–9 on CD-ROM, 9 s. ISSN 2071-9388
- Williamson, I., Rajabifard, A., and Binns, A., 2007. The role of spatial data infrastructures in establishing an enabling platform for decision making in Australia. In: H. Onsrud, ed. Research and theory in advancing spatial data infrastructure concepts. USA: ESRI Press, 121–132. 293 s. ISBN 978-158948–162–6. http://aci.ign.fr/Leicester/paper/Thiemann-v2-ICAWorkshop.pdf (http://aci.ign.fr/Leicester/paper/Thiemann-v2-ICAWorkshop.pdf)
- Wikipedia. http://en.wikipedia.org/wiki/Immersion_%28virtual_reality%29 (http://en.wikipedia.org/wiki/Immersion_%28virtual_reality%29) (Accessed: 27 June 2011 ).
- Williamson , I. , Rajabifard , A. and Binns , A. 2007 . “ The role of spatial data infrastructures in establishing an enabling platform for decision making in Australia ” . In Research and theory in advancing spatial data infrastructure concepts. USA , Edited by: Onsrud , H. 121 – 132 . ESRI Press . 293 s. ISBN 978-158948–162–6
- Williamson , I. , Wallace , J. and Rajabifard , A. Spatially enabling governments: a new vision for spatial information . Towards a 2015 vision of land . October 24–25 2006 , Taipei, Taiwan.
- Wood , M. 2003 . Some personal reflections on change...The past and future of cartography . The Cartographic Journal , 40 ( 2 ) : 111 – 115 .