Abstract
Three issues of applying Huff Model to predict the service area and potential customer pool in Wujin district's commercial networks are analysed and addressed: (1) the distance variable D in Huff Model can either be defined by customer's Euclidean distance, network distance or network time to the commercial circles, and the three approaches have generated very different results in Wujin's case. The differences could be attributed to a traffic infrastructure in the district; (2) the distance decay parameter λ requires either regression or empirical data to estimate. In this paper, several empirical parameters are examined, and it is further proposed that this parameter can be adapted to a fluctuating parameter if the re-modification of Huff model is adopted; and (3) traditional Huff Model was appeared to be over restrictive in Wujin's application because it could only be applied to commercial circles of same scales, and in this paper, a possible re-modification method of predicting the service area and potential customer pool for the different scale commercial circles (Wujin and Changzhou's business circles) are tested. Additionally, a zoning geometry method to analyse the re-modified models’ validation is illustrated.
Introduction
In the study of urban commercial network's attraction, Reilly (Citation1931) first suggested in adopting a gravity model to analyse commercial circles’ attraction to customers. He assumed that the attractions of two commercial circles to a town in between them should be proportional to the population of the base cities of the commercial circles and inversely proportional to the distance of the town to the business circles. Converse (Citation1949, Citation1953) derived a ‘breaking point’ between the two business circles based on Reilly's model – a point that is equally attracted by both circles and can define the boundary of their service area.
These early models were quite limited in fitting a different practical case, and particularly, the defined boundary assumption does not accord with the reality (Huff Citation1962; Ye and Xie Citation2012). Huff (Citation1963, Citation1964) proposed a probability model that contains various factors including commercial circles’ own operating areas. In Huff's model, commercial circles’ service areas are not determined by defined boundaries, but rather in the form of probability of every region's customers to be attracted by the commercial circles. Huff Model has been endured 40 years for a test of time and has a widespread usage by business, governmental analysts, as well as scholars throughout the world (Huff Citation2003). But the parameters in Huff's model were not predetermined and require users to figure those out. As Huff (Citation2003) pointed out, the lack of statistical verification of the parameters has been a major difficulty in the practical use of his model.
The Ministry of Commerce of China has issued regulations that require mandatory commercial network planning for all cities and counties. In the light of that, Wujin commercial circle, as one of the major commercial circles in Wujin district, is under a new planning process for reconstruction. A concerning issue in the planning is that it is only 10 km away from an upper-level scale competitor, Changzhou commercial circle. For that reason, a proper adoption of Huff Model is needed to predict Wujin commercial circle's potential customer pool as an important data input for its new planning. This adoption may require tweaks in the traditional usage of Huff Model, which is going to be reviewed in the following part of the paper.
Review of Huff model
Huff Model suggested that certain customers’ probability to be attracted by a certain commercial circle depends on the scale of the circle and the distance between customers and the circle. The scale of the circle can be measured by the total area of its commercial facilities. The Huff Model can be taken as:
As explained above, the primary difficulty in adopting Huff Model is the estimation of exponential parameters α and λ. To address this problem, many researchers have tried regression with the partial regional data. Although the regression may have technical difficulties since the model must be linearized with respect to its parameters before the standard regression can be applied (Huff Citation2003), it has been successfully performed by a number of researchers (Jin, Wang, and Liu Citation2004) and the difficulties have already been technically overcome.
However, because of the overwhelming barriers for business analysts and researchers to get regional data for regression (especially in the planning process), the adoption of empirical parameters has been taken as a more realistic way to address the parameterization issue. Someone has posed 2.1 for λ after cases studies. While the most currently acknowledged parameters are worked out, in which α equals 1 and λ equals 2. The Tajima estimated parameters were later conceived as ‘the most typical values for an attractiveness parameter’ (Dramowicz Citation2005). Without further notification, this set of empirical parameters will be used in the data analysis in this paper.
The second problem of the model comes from its distance variable. The assumption that customers’ choices for commercial circles depend on their Euclidean distance is restrictive for the accuracy of the model, because in reality, customers need to walk or drive in a street network to their destinations (Okabe and Okunuki Citation2001). Miller (Citation1994) and Okabe, Yomono, and Kitamura (Citation1995) have extended Huff Model to a network-based Huff Model, in which the D variable is determined by the network distance or network time from the customer region to the commercial circle. While the network distance is usually calculated by Dijkstra algorithm (Citation1959), in which a network time's estimation varies in ways (Openshaw Citation1998); however, hardly to find a research to compare the results derived from different distance variables, such as Euclidean distance, network distance and network time, till now. And those differences will be examined in this paper.
The third problem involves the need to adapt the model for application in circles of different scales (Xu 2009). Pointing out that the Tajima modified model failed to take into account the relation between commercial circles’ distance to its upper level circle, Wu (Citation2009) suggested the distance variable to be the product of commercial circle's distance to a customer region and to its upper level circle. This could be a useful method, though its validity is still unsure until going through practical tests.
The popularity acceptance of Huff model is based on its unique characteristics, such as easy to understand, convenient to apply and extensive to solve related issues (Huff Citation2003, 34). Compare to Reilly law, Huff model could be used to deal with the classification of services areas of many shops. And even more, different to the no-overlap services areas based on the Central Place Theory, the Huff services areas are overlapped on each other, which is more realistic (Berry 1967). As you know that the theoretical basis of Huff model is the consumer utility theory, the consumer utility was basically determined by the gravity model (Wang, Jin, and Gu Citation2005; Wang Citation2006). It is approved that the gravity model could be derived from a consumer utility (Niedercorn and Bechdolt 1969; Colwell 1982). Therefore, the Huff model has been applied for business planning since it was proposed. While applying Huff model to a variety planning, the model was improved in many ways (Bucklin Citation1971; Huff and Batsell Citation1974; Lindquis Citation1974; Nakanishi and Cooper1974; Gautschi Citation1981; Weisbrod, Parcells, and Kern Citation1984; Berry et al. Citation1988).
Model data
Overview of Wujin District, Changzhou
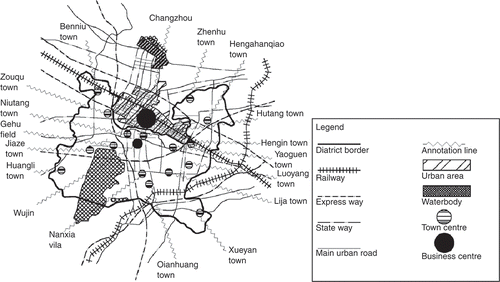
According to the local chronicles (Xzqg.org 2007), Wujin County Government was established on 23 April 1949. Initially located in Shuyeyan Town, the government resident moved to Changzhou City in 1950. Changzhou was separated from Wujin in May 1949 (shortly after Wujin's establishment) as a prefecture level city (see left). On 23 June 1995, Wujin County was converted into a county level city, whose government residents moved out from Changzhou and settled in Hutang Town. On 22 April 2002, Wujin was merged into Changzhou City as a district, and the jurisdictions were adjusted accordingly (see right). The attraction and influence radius of cities (prefecture or county level) have been obviously changing with the move and evolution of their government resident and jurisdictions and would further pose impact on the social and economic courses. illustrates the current location of Changzhou city, Wujin district, and its towns in detail.
Figure 1. Government boundary evolution of Wujin and Changhzou from 1949 to 2002.
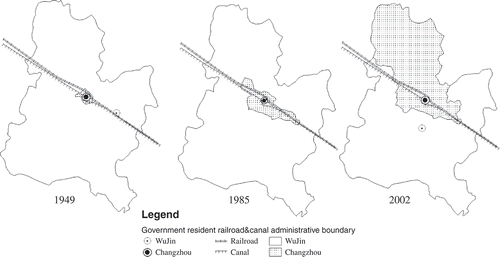
Figure 2. Current location of Changzhou City, Wujin District and its towns.
Business scale
In the Huff Model, the business scale is always defined by the areas of commercial facilities, and it is proportional to the circle's attraction and probability of customer choice in each region. In our case, only main retailers (larger than 3000 square meters) are counted in the areas of commercial for both circles, since these facilities attributes to the largest parts of attractiveness of the circles.
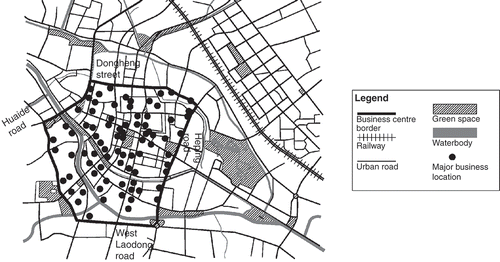
According to the Changzhou Business Market Research Report 2008, Changzhou commercial circle's boundaries are Heping Road, Huaide Road, Dongheng Street, and West Laodong Road. The circle is typified by high density facilities and customers, as well as thriving retails. Some most renowned department stores in Changzhou are located within the circle. As is calculated, the area of facilities in Changzhou commercial circle up to 2010 is 1,000,000 square meters (see for locations of Changzhou central commercials).
Table 1. Distance from each town to the business circle (network distances and times are calculated by Google Map: http://ditu.google.cn/)
Figure 3. Changzhou central commercial area.
Wujin's commercial circle is delimited by Renmin Road, Wuyi Road, Gehu Road, and Changwu Road, and the centre of it is Xintiandi Park. The commercial facilities were approximately 300,000 square meters in area by 2010.
Distance or time variable
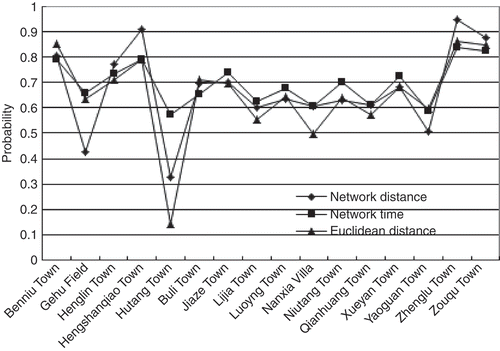
As mentioned above, different variable choices of Euclidean distances, network distances and times’ calculation results will be compared in this research. The network distances and times from towns in Wujin district to the commercial circles are acquired through Google Map. The network times are the shortest time paths for driving as calculated by the Google Map's algorithm. Unit for network distances is kilometers, and network times, minutes. The algorithm in this region roughly assigns 90 km/h driving speed to the highways and freeways, and 15 km/h for the urban roads. The Euclidean distances, network distances and times data are shown in . As can be seen briefly from the , travel from each town to Changzhou commercial circle generally takes less time per kilometer.
In terms of re-modifying Huff Model for different scale commercial circles, Wu (Citation2009) has proposed a re-modified model based on the assumption that lower scale circle's distance to the upper-level scale commercial circle will influence the attractions of the lower-level scale business circle itself. Therefore, the Tajima's squared distance to a customer region for each circle should be altered to the product of distance to customer region and distance to upper-level scale commercial circle for the lower scale circle, as shown by the following formula:
Results
We first choose a Tajima-modified Huff Model to generate the customer-choice probability results from towns in Wujin District to Changzhou and Wujin commercial circle. The result set also includes the total customer pool and service area figures for both circles.
Euclidean distance, network distance and time
Probability (for Changzhou)
In the following result analysis, commercial circles’ probability of regional customer choice will be analysed from Changzhou's perspective. The results are shown in the .
Figure 4. Different customer regions’ choice probabilities for Changzhou commercial circle.
The differences can be interpreted in the following ways:
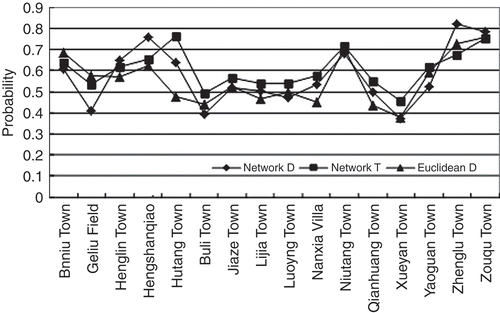
| 1. | Higher probabilities appeared in most of towns’ customer choices in network distances’ calculation than Euclidean distances’ calculation, with exceptions of Benniu Town, Gehu Field and Yaoguan Town. | ||||
| 2. | On further comparison between network distances and times, higher probabilities appeared mostly in network times, with exceptions of Zhenglu Town, Zouqu Town, Henglin Town and Hengshanqiao Town. These comparisons show that when considering traffic conditions in estimating the probability (i.e. network distances and times), Changzhou commercial circle takes higher probabilities since the traffic conditions from each town to larger scale commercial centre appeared to be better. | ||||
| 3. | The comparison of results between network distances and times, higher probabilities appear as a variation that shows degrees of probabilities appeareabilities appeareearee probability (i.e. network distances and times), Changzhou commercial circle takes higher probabilities since the traffic conditions from each town to a larger-scale comicient of variation is helpful to express the fluctuation's difference within the observed otherguess values that differ by several orders of magnitude. The coefficient of variations ratio (i.e. Euclidean distances to network distances to network), is 0.2576:0.2433:0.1184, which mean that probabilities fluctuate the most in Euclidean distances and the least in network times. Again, the traffic conditions might be the cause of smoothing effects for the network results. | ||||
| 4. | The coefficient of variation can also be applied to the three calculation results in each town. And the most varied results occurred in Hutang Town (0.506), Gehu Field (0.182), Nanxia Villa (0.090) and Yaoguan Town (0.072). In fact, these towns are the closest to Changzhou commercial circle among all towns. The results may suggest that in predicting closer locations with more microscopic road network, the adoption of Euclidean distances are most likely to yield unreal results due to its over-simplification on traffic terms. | ||||
Analysis results and summary are shown in . In general, the network time calculation has the highest customer choice probability for Changzhou commercial circle, which is consistent with the above results analysis.
Table 2. Results summary of different distance calculations
Potential customer pool
The potential customer pool for each circle is derived from the probability result and population data of 2010, as shown in .
Table 3. Potential customer pool for Changzhou and Wujin commercial circle
Changzhou commercial circle's customer pool accounts for 59.16% of all the people in Wujin district, totalling 0.9282 million people when adopting Euclidean distances. And the figures are 64.02%, 1.0045 million and 68.16%, 1.0694 million with network distance s and times respectively. And Changzhou to Wujin customer choices ratios are 6:4, 6.5:3.5, 7:3 with Euclidean distances, network distances and times respectively. The change in figures can also attribute to the traffic factors.
Service boundaries
The probability of customer choices for each region is shown in . When delimiting the service areas for two commercial circles, the 50% benchmark is adopted. That is, when a customer region has a larger than 50% probability of patronage for circle, the region can be seen as the circle's service zone. In Euclidean distance calculation, only Gehu Field and Hutang Town's choice probabilities are less than 50% for Changzhou commercial circle, and thus the others are all Changzhou's service area; in network distance calculation, all towns’ choice probabilities are larger than 50% for Changzhou; in network time, only Hutang Town and Nanxia Villa's choice probabilities are less than 50%. Therefore, in all calculations, Changzhou commercial circle takes the most customer regions, showing its overwhelming scale advantage in Wujin district.
Figure 5. Customer choice probability to Changzhou from different regions in Wujin District (Top: Euclidean Distance; Middle: Network Distance; Bottom: Network Time).
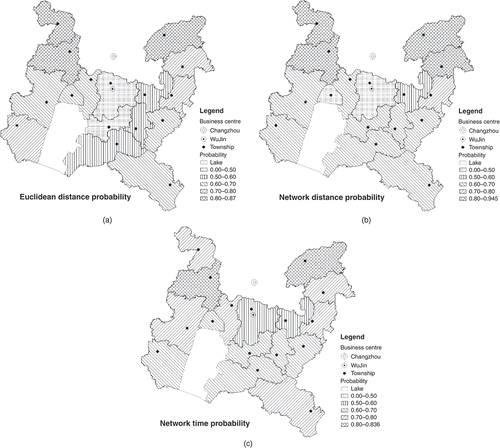
The towns with probability (at least in one calculation) less than 0.5 to Changzhou are Hutang Town, Nanxia Villa and Gehu Field, and they are geographically very close to Wujin commercial circle. The towns in northern part, including Benniu Town, Zouqu Town, Zhenglu Town and Hengshanqiao Town have the highest probability (over 0.7 or 0.8) to Changzhou, as the model predicts.
Re-modified Huff Model
Probability (to Changzhou)
To better address the scale level difference of the two circles, we adopt the re-modified Huff Model (formula 3) to recalculate the customer choice probabilities for each region to Changzhou commercial circle, and the results are shown in . The Wujin circle's distances to Changzhou circle are 7.7, 10, 17 min with Euclidean distances, network distances and network times respectively.
Figure 6. Different customer regions’ choice probabilities to Changzhou business circle with re-modified Huff Model.
Most customer regions’ choice probabilities to Changzhou have decreased with the re-modified calculations, except Hutang Town, Yaoguan Town and Niutang Town.
Potential customer pool
The proportions of customer choices for Changzhou commercial circle are 54.84%, 59.23% and 62.78% with Euclidean distance, network distance and time respectively. And the figures go down about 5% compared to the Tajima modified model's results, which means that Wujin circle centre gains 5% more from the whole in this model ().
As shown in , the northeast and northwest towns in Wujin district have the highest propensity of Changzhou's commercial circle in the Euclidean distance calculation. And the probability goes lower down south, with the lowest figures appearing in Xueyan Town and Huangli Town, which are in the southwest and southeast respectively.
Figure 7. Customer choice probability to Changzhou from different regions in Wujin District by re-modified Huff Model (Top: Euclidean Distance; Middle: Network Distance; Bottom: Network Time).
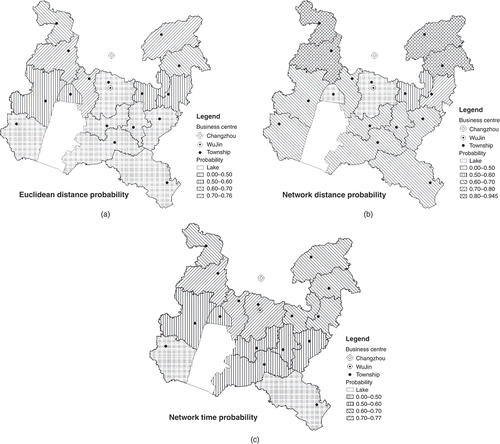
In the network distance and time calculations, the descending trend in probability from north to south is even stronger for Changzhou commercial circle. Four towns have less than 50% probabilities of choosing Changzhou commercial circle, and thus can be categorized as Wujin commercial circle's service areas in the network distance calculation. In the network time calculation, only Xueyan Town and Huangli Town are Wujin commercial circle's service areas.
Adjusted λ
In the re-modified model (formula 3), distance variable Dij with its exponent parameter λ was replaced by the product of Dij and Djc . This will result in the fluctuation of parameter λ if it is derived backwards from the new model's outcomes. The fluctuation of λ of each town to Wujin business circle is shown in .
For most towns, the backward-derived λs are slightly less than 2. But anomalies occurred in Hutang Town's Euclidean and network distance λ values, which are 7.84 and 3.32 respectively. This is due to the vicinity of Hutang Town to Wujin commercial circle. The validity of these values will be examined later in this paper, but that somehow indicates that in the re-modified model, the traffic network's smoothing effect in a network time will yield more close results to the original model.
The distance decay parameter λ has been proposed to vary between geographical regions where the model is applied (Wang 2006). However, the fluctuation of λ within a study region needs further validation. It can be tested with a field data from the study region, but this approach has an overwhelming difficulty in that data from destinations (i.e. commercial circles) are unable to derive the parameter, and the required origin-based data were hard to acquire (Huff Citation2003). And since the paper is for analysing a commercial circle under planning, the origin-based data will be even unrealistic. Therefore, an analytical approach will be adopted to test the validation of λ.
Table 4. Potential customer pool for Changzhou and Wujin business circle with re-modified Huff Model
The Wujin district is divided into four parts, as shown in . The dividers are two simple geometries. The first geometry is a circle centred on Wujin commercial circle and with a radius of distance between Wujin and Changzhou commercial circles (if network distances and times are concerned, the geometry would not be a circle). On this circle, the backward-derived λ will be 2, which is the same as Tajima modified model. And then a straight line divides the segment linking the two circles by half and is vertical to the segment. This describes the line whose points are equal in distance to the two circles (again, if concerning network calculations, that would be a polygonal line).
Figure 8. Four parts divided by simple geometries from Wujin District for λ validation.
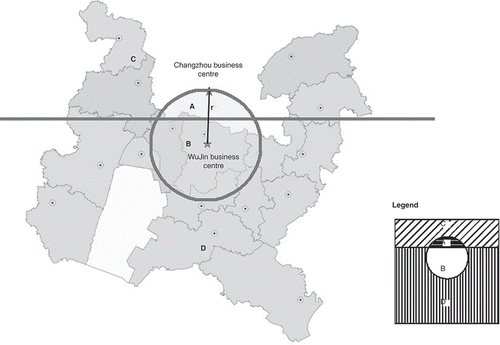
Therefore, in the four parts, A, B, C and D, each stands an area with either backward-derived λ less or more than 2 or with distance closer to one circle rather than another. And the four sets of combinations will have different implications on λ and the validation of the re-modified model.
For example, in region D, λ is less than 2 and these areas are closer to Wujin commercial circle. In reality, customers are more likely to go for a lower scale commercial circle when it is closer and belongs to their own district (for convenience, avoiding congestion and perception reasons), which accord with the lower distance decay parameters. Thus the re-modified λ and model in this situation will be reasonable. And from region D to region B, the λ keeps going up and will surpass 2 entering the circle. This also accords with the reality, because the less the distance difference from customer residences to circles, the more the customers will consider the other advantages for the upper level scale circle rather than the travel time issues. Also region A's parameters could also be understandable to be more than 2 as the re-modified model estimates, considering its vicinity to the Changzhou commercial circle.
The obvious failure in this model occurs in region C. In this part, the distance decay parameter λ for Wujin is below 2. However, the customers in C are much closer to the upper level scale circle, rendering the customers reluctant to go further for a smaller circle with longer distance. Thus, for region C, the re-modified model may not predict as well as the Tajima modified model.
Conclusions and discussions
Because of its comprehensibility and ease of use, Huff Model has been widely adopted in business and various spatial analyses. And the discussions and studies for its variables and parameter estimations have been accompanying its history of adoption.
Huff model could be applied in both single shop and multi-shops for the location allocation or service area determine. In this paper, service area of multi-shops was determined based on the shop business area because of the following considerations. (1) According to the research achievement of Tajima and Harada (Citation1997), the shop business area could be used for calculation of shop service area though the model was simplified. The research achievement was adopted and became the standard of Japan. (2) The business area of large shop is the business identity and influence power of the shop, which represents its commodity class and grades. That is why the large shop was analysed while the small ones were cancelled. (3) Considering the middle class of Changzhou and no ideal transportation network data, it is reasonable to use the Goole map's algorithm of driving to estimate the transportation network time. And the result was somewhat realistic.
Regarding the distance variable, this paper compares three types of distance input (Euclidean distance, network distance and network time) for the case study. Network distance, and time yielded a higher customer propensity for Changzhou commercial circle due to the better traffic infrastructures from each town to Changzhou. And network distance and time calculations also had less fluctuated results. That smoothing effect could also contribute to the traffic (shorter distance travels will take a larger part in urban areas, thus lowering the speed).
Table 5. Fluctuation of λ in different towns (to Wujin business circle)
In terms of the distance decay parameters, this paper examines the Wu (Citation2009) re-modified Huff Model. The re-modified model includes the lower-scale circle's distance from upper-scale circle, thus possessing a potential for different scale circles’ analysis that cannot be realized in the original model. The distance decay parameter λ in the re-modified model was than backward-generated. And further validation shows that though in most regions the re-modified model could predict well of the real customer choices to the two different scale circles, incongruity might still occur in some of the regions (Radke and Mu Citation2000). However, the adaption and adoption of Huff Model for different scale commercial circles’ analysis will still be worthy a topic, since the newly developing retail industry in China and other parts of the world will arouse many more competitions between different scale circles (Fang, Shih-Lung, and Qingquan Citation2010).
The Huff Model's usage has been spreading far beyond commercial circles’ spatial analysis over time. Wang and Guo (Citation2003) has conducted different cities’ influence zoning research in Yangtze River Delta. The inclusion of various cities also arises scale issues in the parameter estimation (Wei and Ye Citation2009; Ye and Carroll Citation2011). And people's perceptions of their provincial affiliation are underrepresented in the original model or Tajima Model. Therefore, the re-modification of Huff Model to take all these factors into consideration will be a potentially meaningful exploration in future studies.
Acknowledgements
The authors thank the editor and two anonymous reviewers for their helpful comments on this paper. Funding for this study was provided by the National Scientific Foundation of China (51008187) and Sub-topic of Key Project of 11th-5-year National Supporting Program (2012BAJ22B03).
References
- Berry, B. J. L. 1967. The Geography of Market Center and Retail Distribution. Englewood Cliffs, NJ: Prentice Hall
- Berry , B. J. L. , Parr , J. B. , Epstein , B. J. , Ghosh , A. and Smith , R. H. T. 1988 . Market Centers and Retail Location: Theory and Applications , 1 – 230 . Englewood Cliffs , NJ : Prentice Hall .
- Bucklin , L. P. 1971 . Retail Gravity Models and Consumer Choice: A Theoretical and Empirical Critique . Economic Geography , 47 : 489 – 497 .
- Converse , P. D. 1949 . New Laws of Retail Gravitation . Journal of Marketing , 14 : 379 – 384 .
- Converse , P. D. 1953 . Comment on Movement of Retail Trade in Iowa . Journal of Marketing , 18 ( 2 ) : 170 – 171 .
- Colwell , P. F. 1982 . Central Place Theory and the Simple Economic Foundations of the Gravity Model . Journal of Regional Science , 22 : 541 – 546 .
- Dijkstra , E. 1959 . A Note on Two Problems in Connection with Graphs . Numerische Mathematik , 1 : 269 – 271 .
- Dramowicz, E. 2005. “Retail Trade Area Analysis Using the Huff Model.” Directions Magazine. Accessed August 21, 2011 http://www.directionsmag.com/articles/retail-trade-area-analysis-using-the-huff-model/123411 (http://www.directionsmag.com/articles/retail-trade-area-analysis-using-the-huff-model/123411)
- Fang , Z. , Shih-Lung , S. and Qingquan , L. 2010 . A Sensitive Indicator of Regional Space–Time Accessibility . Annals of GIS , 16 ( 3 ) : 155 – 164 .
- Gautschi , D. A. 1981 . Specification of Patronage Models for Retail Center Choice . Journal of Marketing Research (JMR) , 18 ( 2 ) : 162 – 174 .
- Huff , D. L. 1962 . A Note on the Limitations of Intraurban Gravity Models . Land Economics , 38 ( 1 ) : 64 – 66 .
- Huff , D. L. 1963 . A Probability Analysis of Shopping Center Trade Areas . Land Economics , 53 : 81 – 90 .
- Huff , D. L. 1964 . Defining and Estimating a Trading Area . The Journal of Marketing , 28 ( 3 ) : 34 – 38 .
- Huff , D. L. 2003 . Parameter Estimation in the Huff Model . ArcUser , October –November : 34 – 36 .
- Huff , D. L. and Batsell , R. R. 1974 . “ Conceptual and Operational Problems with Market Share Models of Consumer Spatial Behavior ” . In Advances in Consumer Research , Edited by: Schlinger , M. J. Vol. II , Urbana , IL : Association for Consumer Research .
- Jiangsu Sunyun Agency Ltd., Co. 2008. Changzhou Business Market Research Report, 2008. Accessed August 23, 2011 http://www.docin.com/p-61303324.html (http://www.docin.com/p-61303324.html)
- Jin , F. , Wang , F. and Liu , Y. 2004 . Geographic Patterns of Air Passenger Transport in China 1980–1981: Imprints of Economic Growth, Regional Inequality, and Network . The Professional Geographer , 56 ( 4 ) : 471 – 478 .
- Lindquist , J. D. 1974 . Meaning of Image: A Survey of Empirical and Hypothetical Evidence . Journal of Retailing , 50 : 29 – 38 .
- Miller , H. 1994 . Market Area Delineation Within Networks Using Geographic Information Systems . Geographical Systems , 1 : 157 – 175 .
- Nakanishi , M. and Cooper , L. G. 1974 . Parameter Estimates for Multiplicative Competitive Interaction Models: Least Square Approach . Journal of Marketing Research , 11 : 303 – 311 .
- Niedercorn , J. H. and Bechdolt , B. V. 1969 . An Economic Derivation of the ‘Gravity Law’ of Spatial Interaction . Journal of Regional Science , 9 : 273 – 282 .
- Okabe , A. and Okunuki , K. A. 2001 . Computational Method for Estimating the Demand of Retail Stores on a Street Network and Its Implementation in GIS . Transactions in GIS , 5 ( 3 ) : 209 – 220 .
- Okabe , A. , Yomono , H. and Kitamura , M. 1995 . Statistical Analysis of the Distribution of Points on a Network . Geographical Analysis , 27 : 152 – 175 .
- Openshaw , S. 1998 . Some Trends and Future Perspectives for Spatial Analysis in GIS . Geographic Information Sciences (Annals of GIS) , 4 ( 1–2 ) : 5 – 13 .
- Radke , J. and Mu , L. 2000 . Spatial Decompositions, Modeling and Mapping Service Regions to Predict Access to Social Programs . Geographic Information Sciences (Annals of GIS) , 6 ( 2 ) : 105 – 112 .
- Reilly , W. L. 1931 . The Law of Retail Gravitation , 1 – 5 . New York : Knickerbocker Press .
- Tajima , Y. and Harada , H. 1997 . Seminal Trade , 1 – 123 . Tokyo : Nihon Keizai Shimbun .
- Wang , D. and Guo , J. 2003 . Hinterland and Its Dynamic Changes in Hu-Ning-Hang Region . Urban Planning Forum , 2003 ( 6 ) : 6 – 13 .
- Wang , F. 2006 . Quantitative Methods and Applications in GIS , 77 – 81 . London : Taylor & Francis .
- Wang , F. , Jin , F. and Gu , C. 2005 . GIS-Based Method for Delineating Urban Hinterlands in Northeast China . Geographic Information Sciences (Annals of GIS) , 11 ( 2 ) : 113 – 121 .
- Wei , Y. D. and Ye , X. 2009 . Beyond Convergence: Space, Scale, and Regional Inequality in China . Journal of Economic and Social Geography , 100 : 59 – 80 .
- Weisbrod , G. E. , Parcells , R. J. and Kern , C. 1984 . A Disaggregate Model for Predicting Shopping Area Market Attraction . Journal of Marketing , 60 : 65 – 83 .
- Wu , Z. 2009 . Re-modified Model of Location of Urban Trade Areas Based on Huff Modified Model . Journal of Jishou University (Natural Science Edition) , 30 ( 2 ) : 108 – 111 .
- Xu , X. 2009 . Urban Geography , 300 – 301 . Beijing : The Commercial Press .
- Xzqg.org. 2007. The Chronicles of Changzhou. Accessed August 20, 2011 http://www.xzqh.org/old/quhua/32js/0400.htm (http://www.xzqh.org/old/quhua/32js/0400.htm)
- Ye , X. and Carroll , M. 2011 . Exploratory Space-Time Analysis of Local Economic Development . Applied Geography , 31 : 1049 – 1058 .
- Ye , X. and Xie , Y. 2012 . Re-Examination of Zipf's Law and Urban Dynamic in China: A Regional Approach . Annals of Regional Science , 49 ( 1 ) : 135 – 156 .