
Abstract
Social media data are available and accumulated at the extra-byte level every day. As social media applications are widely deployed in various platforms from personal computers to mobile devices, they are becoming a natural extension to human sensory system. The synthesis of social media with human intelligence has the potential to be the intelligent sensor network of unprecedented scale and capacity. However, it also poses several grand challenges to archive and retrieve information from massive social media data. One of these challenges is how to archive, retrieve and mine such massive unstructured data set efficiently to support real-time emergency response. To explore potential solutions, this paper utilizes parallel computing methods to harvest social media data sets, using Twitter as an example, and to store, index, query and analyse them. Within this framework, a Not Only SQL database (DB), MongoDB, is used to store data as document entries rather than relational tables. To retrieve information from the massive data sets efficiently, several strategies are used: (1) data are archived in the MongoDB across multiple collections with each collection containing a subset of the accumulated data, (2) parallel computing is applied to query and process data from each collection and (3) data are duplicated across multiple servers to support massive concurrent access of the data sets. This study has also tested the performance of spatiotemporal query, concurrent user requests and sentiment analysis over multiple DB servers, and performance benchmark results showed that the proposed approach could provide a solution for processing massive social media data with more than 40% performance improvement. A proof-of-concept prototype implements the design to harvest, process and analyse tweets.
1. Introduction
The past years have witnessed the flourish of social media such as Facebook, Twitter, LinkedIn and Flickr, which are widely used in people’s daily lives. With advancement in computing infrastructure and services, a social media service can be accessed on different physical devices from desktop computers to smart mobile phones. This makes it convenient and intuitive for people to easily share their stories or photos with friends through the Internet.
Because of its timely availability and accessibility, social media data sets are utilized in a variety of ways, for example, one typical usage is in marketing (Thomases Citation2009). Besides their usage in exploring business opportunities, social media also ignite strong interests in academic environment. Researchers have experimented with concepts, such as applying social media as an intelligent ‘geo-sensor’ to detect extreme event or disaster (Sutton Citation2010). The availability of social media data indeed provides new types of subjective data at individual level, which were very difficult to collect previously. The network of social media users has been considered to be the low-cost effective ‘geo-sensor’ network for contributing information individually. For example, Asiana Flight 214 from Seoul, Korea crashed while landing at San Francisco International Airport on 6 July 2013. News of the crash was spread quickly on the Internet through social media. With eyewitnesses sending tweets of their stories, posting images of the plumes of smoke rising above the bay and uploading video of passengers escaping the burning plane through the Internet, the event was quickly acknowledged globally. Some went even further to experiment with using social media platforms for coordinating activities. Gao, Barbier, and Goolsby (Citation2011), for example, applied crowdsourcing information for disaster relief coordination. One prominent feature of social media data is their obvious subjective nature because many social media data were from personal witnesses or personal feelings. Social media data thence potentially are invaluable to situations where human emotional status can significantly affect the result. The image of a total failure of government agencies’ responses to Hurricane Katrina was somehow intensified by reports of media (Guion, Scammon, and Borders Citation2007).
Social media, such as Twitter and Jaiku, publish huge volumes of user-generated data as they are created in real time. For example, Twitter has 350 million active users worldwide who create 177 million tweets daily in multiple languages. While the population of Twitter users is dwindling slightly in the United States, its service territory has been effectively expanded to more than 100 countries. The simplicity of its service design, no more than 140 characters for each post, has the most astonishing versatility in contents. Many of the tweets are merely daily greetings to or short conversations with friends; a large portion of tweets is short descriptions with web links to external sources. Though underneath the platitude surface are the intensive human emotions towards their daily encounters. Nowadays, it is almost a norm for public relationship management to monitor closely company or personal images in the Twitter sphere (Culnan, McHugh, and Zubillaga Citation2010). For the ripple of a negative comment about a product might be amplified to a tsunami of public distrust to threaten the survival of an entire company. Just like many other elegantly simple products, the restriction to whose usage is only imagination, the usage of Twitter service in real world scenarios has gone far beyond maintaining personal relations. Even at its early days, Twitter was used for communication purposes in major humanitarian activities (Murthy and Longwell Citation2013). The effectiveness and efficiency with applying its service to loosely coordinate crowd events had caused Twitter to be banned in some countries (Aouragh and Alexander Citation2011).
Despite the possibilities that scholars and practitioners envisioned in utilizing social media, the computational hurdle to practically leverage social media data is currently extremely high (Elwood, Goodchild, and Sui Citation2012; Manovich Citation2011). Social media data present challenges at least in the following four dimensions:
There is the huge volume of social media data. For Twitter alone, the number of tweets reached 400 million per day in March 2013 and that number is escalating rapidly (Twitter statistics Citation2014).
There is the enormous velocity of real-time social media data streams. For Twitter, 9100 tweets are posted every second currently (Statistics Brain Citation2014).
There is the high variety of social media data contents. Text-based tweets, image-based Flickr photos or video-based YouTube posts are all telling stories using different media.
Social media data are assertive and create the trustworthiness question.
These dimensions are now widely cited as the four V's of big data (Fromm and Bloehdorn Citation2014). While the trustworthiness touches upon non-technical challenges, the other three challenges put more demands on innovative computational solutions (Agrawal, Das, and El Abbadi Citation2011). It is our goal in this paper to present a prototype we created to address the demands on high performance computing framework for processing social media data timely and effectively.
The rest of the paper is organized as such that a general review of the research on social media processing provides the broader context for our empirical study, followed by the third section describing the methodology for storing, organizing, managing, searching and mining data. Then, we present the performance analysis and prototype. The paper is concluded with discussions about challenges and future research directions.
2. Literature review
The openness of Twitter platform has made it an attractive data source for academic studies (Signorini, Segre, and Polgreen Citation2011). Previous studies in social or behavioural research were regularly restricted by data availability, either ‘surface data’ about many or ‘deep data’ about the few (Manovich Citation2011). Based on suitability, methodologies such as direct observation or personal interview are commonly practised by social scientists to investigate a well-defined sample population. Or, research participants are requested to keep space–time diaries about their daily routines. Tactical sacrifice has to be made to balance the depth of a study and the width of the surveyed population out of the available economic and manpower resource. A typical social survey at the national level demands years of dedicated investments of resources to be successful (Savage et al. Citation2013). On the contrary, even with the research at rudimentary level, Twitter data have presented interesting snapshots about human society at macro scale with agility that would only be dreamed of by traditional surveys (González-Bailón et al. Citation2011; Frank et al. Citation2013).
Numerical empirical studies have shown that if combined effectively, social media data such as tweets can be used to detect events, and indicate society situations as they are evolving at different spatiotemporal granularity across the world (Singh, Gao, and Jain Citation2010). The phenomenon has been termed ‘citizen-as-sensors’ (Goodchild Citation2007). The fundamental idea is that human actors in a connected environment when augmented with ubiquitous mechanical sensory system can form the most intelligent sensor web (Sheth, Henson, and Sahoo Citation2008). Such intelligent sensor webs have the most realistic implications for operations such as emergency management, where information is the most valuable and hard to get asset (Vieweg et al. Citation2010; Verma et al. Citation2011).
However, the great potential comes with grand challenges as well (Sui and Goodchild Citation2011; Madsen Citation2012). It is beyond the scope of this paper to comprehensively discuss envisioned challenges from both the epistemological and the computational perspectives. The exploration of epistemological difficulties raised by social media data is forsaken here. The attention is on computational challenges, the so-called three ‘V’s’ (Zikopoulos and Eaton Citation2011) that emphasize the grand computational difficulties. The volume, the velocity and the variety of the accumulated social media data produce the most compelling demands for computing technologies from data management to technology infrastructure (Keen et al. Citation2012). For big data management, many non-traditional methodologies such as not only SQL (NoSQL) and scalable SQL are implemented (Nambiar, Chitor, and Joshi Citation2014). Meanwhile, various types of computational infrastructures are designed, from the more traditional cluster computing (Huang, Yang, Benedict, Rezgui, et al. Citation2013) and the grid computing to the recent cloud computing (Yang et al. Citation2014; Huang, Yang, Liu, et al. Citation2013) and the central processing unit (CPU)/graphics processing unit heterogeneous computing (Schadt et al. Citation2010).
Specifically cloud computing has been increasingly viewed as a viable solution to conjure up an army of low-profile computing resources that can break the big volume of data into small pieces that can be processed simultaneously (Huang, Yang, Benedict, Chen, et al. Citation2013). In fields that face the big data challenge, cloud computing has been experimented for their performance and best computing strategies (Schadt et al. Citation2010, Helen Citation2013; Sowe and Zettsu Citation2014). For the geospatial computing field, Huang, Yang, Benedict, Chen, et al. (Citation2013) provided one of the early experiences on using cloud computing for processing large amount of traditional geospatial data. But still there are many unanswered questions about bettering the utilization of cloud computing for geospatial research, for example how to process geospatial data in non-traditional format such as the Twitter data.
While the implementation of cloud computing technology solves the problem of elastic resource management, data have to be managed in a way that is suitable for distributed parallel processing. Here, NoSQL has been popularly implemented as a better means to manage social media data. NoSQL implements new data structures, such as tree, graph or key-value, and their implementation in geospatial computing is largely for experimental purposes (Franke et al. Citation2011). Hence more studies would contribute more practical experiences, which would eventually pave the way for systematic implementation of the new technology in Geographic Information System (GIS). One prominent difficulty with traditional GIS is that it was originally designed and implemented as an application targeting stand-alone single computers. In other words, traditional GIS lacks the capacities to process new data types such as Twitter data, which constantly flow, in extremely large volume and with versatile contents. Meanwhile, although a small portion of Twitter data is georeferenced and with exact geographic location information, the majority of Twitter data have no explicit geographic location information. And the fact that much useful information in Twitter is textual only compounds the problem. The convenience in harvesting Twitter data has made it a popular research data source in many fields (Frank et al. Citation2013; Murthy and Longwell Citation2013; Culnan, McHugh, and Zubillaga Citation2010). In geography, Xu et al. (Citation2013) presented a computational method to extract and georeference textual location information from Twitter data and analyse it using traditional GIS. However, the data processing was only carried out on a single machine. Although the study showed a conceptual model, it is crucial to be able to examine the initial discoveries with more observations.
Thus, the requirement for systematic examination of computing method that integrates cloud computing and NoSQL is prominent (Shekhar et al. Citation2012). Shekhar et al. (Citation2014) benchmarked the potential benefits of leveraging the strength of big data to better solution for the traditional routing finding problem. In the fields of geosciences, big data have been bringing new possibilities to the somewhat ‘old’ problems (Narock and Hitzler Citation2013). However, in traditionally more qualitative-oriented fields, the potential of a computation turn only raises as many questions as, for example, about suitable methodology (Manovich Citation2011). Among them, one prominent challenge is how to cost-effectively support big social data archiving and processing. This paper proposes a new framework for harvesting the social media data sets, using tweets as an example, on a real-time fashion, and to store, retrieve and analyse them efficiently.
3. Methodology
Twitter publishes real-time tweet stream through open application programming interfaces (APIs). By registering an account and applying for access keys, third parties can receive tweets in real time. Depending on the account type, there are limits posed by Twitter on the amount of tweets that can be collected. For this study, we only used the basic type of account, which gives us access to 1% of total real-time tweets. As Twitter only allows users limited access to historical tweets, tweets have to be archived in local hard drive. Therefore, our approach starts with data access, and then data are stored locally and processed later for analysis purpose.
In order to query and process the massive data sets efficient, three primary strategies are used:
Data sets are archived as different collections in the database (DB). In the MongoDB, the information is stored in the format of a document collection rather than a table, and each DB could have multiple collections. In addition, each collection could have many document entries while each piece of social media data set (tweet) is treated as a document entry. Therefore, social media data sets can be archived and managed in multiple collections. Different strategies can be used to decompose the entire data sets into different collections. For instance, decomposition based on temporal information, where tweets in different time period, such as monthly or weekly, are stored in different collections. Or decomposing the entries according to the spatial region, which means we can divide the interested regions into multiple sub-regions and archive data sets into multiple sub-region collections. For example, United State can be divided into four sub-regions, including eastern, western, southern and northern, and tweets sent from different sub-regions are put into relevant collections
Parallel computing is applied to harvest, query and analyse tweets to or from different collections simultaneously. Multiple processes or threads are initiated to implement parallelization, and each process or thread is responsible to archive, query and handle tweets to or from one collection.
Data are duplicated across multiple servers to support massive concurrent access of the data sets.
3.1. System architecture
shows a general architecture for archiving and analysing real-time social media data, which in this study is Twitter. The system is designed to include four layers, including: (1) data resources: Different social media such as Twitter, Google+ and Flickr can be served as the data resources to be archived by the system; (2) data repository: The data repository layer is responsible for archiving and retrieving data sets; (3) data processor: This layer provides data processing and high-level analytical functions and (4) data client: The data client layer provides information analysis for end users through geovisualization or animation with interactive tools. Even though a stand-alone desktop client could be used to serve as a data client, a web portal with a web graphic user interface (Li et al. Citation2011; Roth Citation2013) is more accessible as the entry point for the public users to use the system.
Figure 1. General architecture of an archiving and analytical system for social media data set.
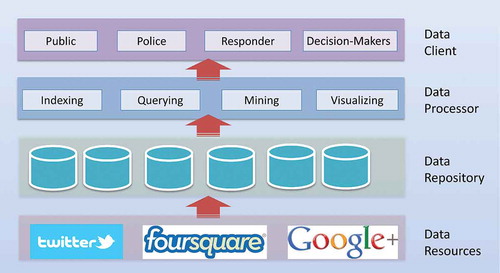
In this architecture, the data resources and data client layers are common layers included in a web system and easy to understand. The core components in the architecture are the data repository and processor layers, which implement and provide the capabilities of efficient data archiving, query and analysis.
3.1.1. Data repository
Data repository layer is designed to store and manage the harvested social media data sets. The proposed framework is capable of harvesting data set from multiple social media, such as Twitter, Google+ and Flicker. In our design, a non-traditional, NoSQL DB system, also known as document DB system, MongoDB, instead of a relational DB management system (RDMS), is used to manage those social media data sets efficiently. There are two primary reasons that MongoDB is an appropriate DB system to sustain this framework (Membrey, Plugge, and Hawkins Citation2010):
In a traditional RDMS, all data are stored in tables, and it is the relations between the tables enforced by foreign keys (Shanmugasundaram et al. Citation1999) that make it a ‘relational’ table. Each data record has the same structure repeated in each row, and each column includes a specific type of data. If using a RDMS, a tweet entry, as a row of a table, may contain the columns of the user account, user name, location, tweet content, retweet counts, sent to users and hashTag identifying the content theme or topic. However, tweets are not uniform and structured in nature. For example, some tweets may have longer texts than others, a tweet may have hashTag, be retweeted by many followers or sent to a specific user. Therefore, as unstructured data sets with non-uniform fields in nature, tweet entries are not appropriate to be stored as structured tables, where the table columns and the length of each column are predefined and fixed when the table was created. On the other hand, document DBs such as MongoDB use JavaScript Object Notation (JSON) (Membrey, Plugge, and Hawkins Citation2010) documents to store records. Within each document, non-uniform fields can be added with no limitation. In addition, a JSON DB returns JSON query results that can be easily parsed, with little or no transformation, directly by JavaScript (JS) and most popular programming languages. This can help to reduce the amount of logic required to build into the application layer.
Traditional relational DBs are not designed to deal with the scale and agility goals of modern applications (Membrey, Plugge, and Hawkins Citation2010). The performance of a relational DB mostly relies on the underlying server hardware, and it is not convenient to scale a relational DB to multiple servers. For example, neither MySQL nor PostgreSQL can effectively leverage a cluster of servers to support a single DB, while all servers can read and write data. This is because when receiving a query, those traditional relational DBs will have to find all the relevant data from multiple tables and link them all together to generate query results, which means that a complete view of data should be obtained in order to fetch query results. If distributing the data stored as the format of tables across multiple servers with each server having the same DB schema but partial data records, relational DBs will not be able to get all links and relevant data. Alternative approach for utilizing multiple servers is replicating a DB on those servers. However, automatically synchronizing replication would be a great challenge, for example, how to ensure that data written on one server are immediately available for the rest of the servers. On the other hand, MongoDB supports the utilization of multiple servers to improve the performance in a much easier way. Although similar documents are stored together, individual documents do not have relationships. The queries in the MongoDB look for specific keys (similar as the header of the columns in a relational-DB table) and values (similar as the specific values of each column for each row) in a document, such queries can be easily distributed across different servers. Each server checks the content it has, and returns the result. Such document-oriented mechanism effectively allows almost linear scalability and performance improvement through the distributed servers (Membrey, Plugge, and Hawkins Citation2010).
3.1.2. Data processor
Data processor layer is used to receive and parse a specific data request (e.g., get all the tweets that include the word ‘water’ in the content) from the client. In addition, it also performs the functionalities of accessing, querying and analysing the massive data sets retrieving them from the local DB. The query and analysis, especially the interaction between the data processor and DB are time consuming when massive data sets are involved (). This issue is further exaggerated by multiple simultaneous requests from massive users (). An application’s usability has significant impact on its user acceptance. A study shows that if the response time is longer than 3 seconds, the users will become frustrated (Nah Citation2004). Therefore, data processor empowered by parallel computing is used to support the computing demands from the system. The parallel computing is used at two levels:
Process level: For each data and service request, multiple processes or threads are initiated with each process or thread accessing different collections from the DB.
Client level: the DB is replicated to multiple DB servers to handle massive concurrent user requests with each sever handling a subset of user request.
3.2. Workflow
To implement an archiving and online analytical system for exploring massive social media data sets based on the architecture proposed in , there are several system components that should be included, such as a web portal for public users to access the services, one or more web servers to handle the service requests and one or multiple data or DB servers for data processing. shows the workflow of integrating the three components to build a functional and robust system for massive public users to access and process big social media data. Each component includes multiple modules and is described as below.
Figure 2. Workflow of an archiving and online analytical system for social media data set.
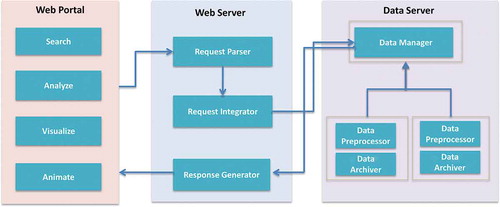
The web portal provides data search, analysis, visualization or animation service. Users from a variety of communities can request the services through the web portal to the data processor. To handle the user request from the public users, three service request handling modules are designed on the web server side, including:
Request parser: After receiving a request from the web client, the request parser in the sever side will be invoked to parse and extract the query parameters (such as key words, the spatial and temporal coverage of the data queried), and create a new service task based on the parameters. Then it adds the task into the service request queue, which is processed by request integrator.
Request integrator: This module is used to schedule, and dispatch the query tasks to the data manager module deployed on the data server. Based on the query parameters extracted by the request parser, the request integrator can determine how many processes or threads should be invoked to query the data from different data repositories in parallel. For example, if users are interested in a specific time period and spatial coverage data that are stored in one collection of the DB, one process is initiated to query that DB. However, if the data spread in two collections that may distribute either on one or two data servers, two processes are launched to query those collections concurrently.
Response generator: This module is responsible for integrating and wrapping up the query results from the data manager module. In addition, the response generator module can also perform the analytical or data mining functions, such as sentiment analysis, over the query results to generate response results. Finally, it sends those response results in the format of JSON to the web portal for further visualization or animation.
To handle massive concurrent requests from the public users, the three service request handling modules can be deployed on more than one web server. In this case, cloud computing is a new computing that can be leveraged to elastically provision the amount of computing servers to handle spike workloads and accelerate geocomputation in a few seconds to minutes (Huang, Yang, Benedict, Chen, et al. Citation2013). The basic modules in the data server include:
Data archiver: To handle the data gathered from social media networks efficiently and effectively, a data archiver module is needed to access and receive the near real-time data from those network systems. In this case, it can continuously harvest tweet entries from Twitter with its APIs, and save them as document entries in the MongoDB. The data archiver can be deployed on multiple servers with each server making one connection for general streams of tweets to get more access of the tweets.
Data preprocessor: This module is responsible to preprocess the data collections in the MongoDB to facilitate data query and access. For example, MongoDB cannot support full text search over the tweet content and spatial query over the geo-tags at the same time. Therefore, the content of each tweet is tokenized as single words, which are stored as an extra field of the document entry to facilitate spatial and keyword-based query at the same time. In addition, building up indexes for tweet collections would make a great difference in terms of data query. Thus, indexes are created for the tweet content and hashTag for each collection.
Data manager: This module keeps an overall picture of the data collections in the DB across multiple servers. When receiving the data access request from the request integrator, it can disseminate the request to related data collections on different servers.
As the web server, multiple data servers can be leveraged to handle the big social media data. When two or more data servers are used, one of them should be served as the master data server while the rest as slave data servers with data preprocessor and data archiver modules deployed. The master server including the data manager module communicates with all slave data servers to effectively archive and preprocess data and dispatch data retrieval request. With MongoDB as the DB management system, such scenarios can be easily implemented because the MongoDB naturally supports master–slave replication on a cluster of servers (Banker Citation2011). One of the servers can be chosen as the master node to store data, all write operations go to this server from any client. A large number of non-master (slave) nodes can be configured to automatically synchronize with the master node and accept read operations. If master server crashed, one of the slave nodes will be elected as the master server.
4. Experiments
4.1. Performance analysis
To benchmark the performance of the designed architecture for big data analysis, several performance tests are conducted on three servers with each having 16 GB memory and dual quad-core CPU of 3.40 GHz. During the test, the DB is configured on two servers where one serves as the master node and the other as the slave node. The third server serves as the client to send the queries for retrieving data sets from the DB.
The tests use 160 million tweets collected from 29 October 2013 to 25 December 2013. In the MongoDB, each tweet is a document entry with each entry recording the fields of user name, location (longitude and latitude), content, time for posting the tweet, device used for tweeting and hashTag. In addition, an array of words tokenized from the content is stored and indexed in each document entry to support keyword-based query. Those tweets are stored in the same DB but within different collections for different tests on each DB server. Two indexes are created for each collection based on hashTag and tokens fields to further speed up the query time. More specifically, two groups of tests are performed, including:
Spatiotemporal query: One, two, and four threads are issued to handle the query of the targeted tweets from a 5-, 10-, 40-, 80- and 160-million record collection that is hosted on both one and two DB servers with the same set of keywords and spatiotemporal scope.
Concurrent query: This experiment tests the scenarios of one server and two servers to process 10, 20, 40, 80, 160 and 320 requests generated simultaneously.
Sentiment analysis: One, two and four threads are issued to support the sentiment analysis of 5, 10, 40 and 80 million records.
4.1.1. Spatiotemporal query
In this experiment, different numbers of data records (tweets) are used to demonstrate the query performance improvement by using parallel computing, where a query from one user is decomposed into multiple sub-queries with each sub-query handled by one thread searching a subset of data sets. When only one thread is used, the query for different DB record collections (5-, 10-, 40-, 80- and 160-million record collections in this test) is the same as serial computing. When using two threads with only one DB server, two queries are constructed with each query directed to a 2.5-, 5-, 20-, 40- and 80-million record collection, respectively. In this case, it is worthy of mentioning the original 5-, 10-, 20-, 40- and 80-million record collections are split equally into two 2.5-, 5-, 10-, 40- and 80-million ones. If two DB servers are used, one query is handled by the master-node DB server, and the other is sent to the slave-node server. On the same way, four queries are used within the four-thread scenario test, and each query is restricted to search a 1.25-, 2.5-, 10-, 20- and 40-million record collection only.
shows the spatiotemporal query performance results using different numbers of threads, DB servers and tweet records in the DB. The experiment results indicate that the query time would increase with the increase of tweet numbers. However, with the support of parallel computing, the query time can be reduced.
Figure 3. Performance of different number of threads for spatiotemporal query of different number of tweets on one and two DB servers.
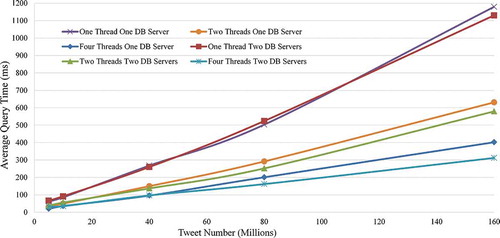
According to the results, it takes around 62, 186, 268, 503 and 1179 ms in average for the system to retrieve the targeted tweets within a 5-, 10-, 40-, 80- and 160-million record collections using one thread. However, when the number of threads increases to 2, the average response time to retrieve the targeting tweets from two 2.5-, 5-, 10-, 40- and 80-million record collections that are hosted on one server are improved to 31, 50, 150, 292 and 631 ms, respectively. Further improvement can be achieved by increasing the thread numbers to 4, where the query time is reduced to 20, 36, 96, 201 and 402 ms, respectively. Compared to one-thread (serial computing) scenario, two- and four-threads querying data sets from one server can improve the performance by a factor of 45% and 63% in average ().
Figure 4. Performance improvement compared to the serial computing (one thread) with one DB server.
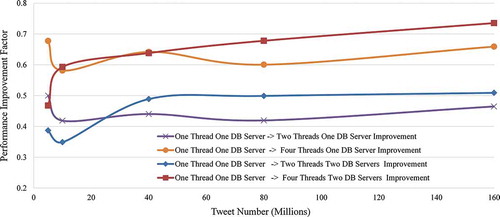
Since DB is replicated into multiple servers, the performance of leveraging different copies of data sets to handle a query is tested as well. From , it can be observed that using two DB servers does not have much gains, especially for relatively small-sized collections (5 and 10 million), in the performance, when distributing the queries issued by different threads to the two-DB servers compared to one-DB server. This is possibly due to the communication overhead between the master and slave DB server. However, the results also indicate that this approach may be useful when handling extremely large data sets. For example, it only takes 312 ms to retrieve the targeting tweets from four 40-million record collections (160 million records in total) using four threads where two threads are distributed to master DB, and two threads are directed to slave DB, while it spends 402 ms with all four threads query sent to one DB server only.
4.1.2. Concurrent query
In this experiment, multiple user scenarios are tested by simulating 10, 20, 40, 80, 160, 320 concurrent query requests to an 80-million record collection. shows the performance of one DB and two DB servers (average response time measured in seconds) in handling different numbers of concurrent requests. The x-axis indicates the concurrent access number and the y-axis indicates the average response time.
Figure 5. Response performance comparisons by one and two DB servers with different concurrent request numbers.
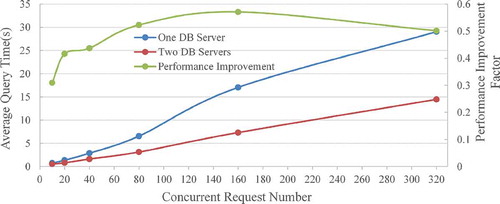
According to the results, two-DB servers can reduce the average response time for each user query by a factor of 45% in average. When one DB sever is used, it takes around 0.747, 1.369, 2.871, 6.554, 17.048 and 29.041 s to respond to 10, 20, 40, 80, 160 and 320 concurrent requests. With two-DB servers, users may expect to get results back in 0.516, 0.799, 1.616, 3.127, 7.313 and 14.469 s, respectively.
4.1.3. Sentiment analysis
Sentiment analysis, also known as opinion mining or voice of the customer, is one of the most popular data mining functions and analysis of social media data sets (Thelwall, Buckley, and Paltoglou Citation2011). Sentiment analysis studies the feelings (i.e. attitudes, emotions and opinions) hinted in the words using natural language processing tools. In this paper, LingPipe (Citation2014) is used as the toolkit for processing tweet using computational linguistics. It can classify opinions in text into three categories, including ‘positive’, ‘negative’ and ‘neutral’. This experiment uses the four groups of collections, including (1) 5 million, two 2.5 million and four 1.25 million, (2) 10 million, two 5 million and four 2.5 million, (3) 40 million, two 20 million and four 10 million and finally (4) 80 million, two 40 million and four 20 million, to demonstrate the data mining of tweets, with sentiment analysis as an example, to illustrate the performance improvement by using parallel computing ().
Figure 6. Performance of different number of threads for sentimental analysis of different number of tweets on one and two DB servers.
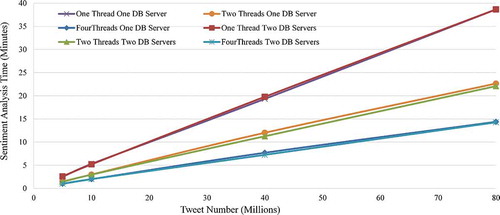
shows the sentiment analysis performance results using different thread numbers and tweets records in one and two MongoDB DB servers. According to the results, it does not make too much difference in terms of performance for time-consuming data analysis with multiple DB servers since most of time is spent on processing data rather than querying data. However, parallelizing the data analysis tasks would reduce data processing time significantly. It takes around 2.8, 5.5, 19.3 and 38.7 minutes for the system to complete the sentiment analysis for 5, 10, 40 and 80 million tweets using one thread. When the number of threads increases to 2, the sentiment analysis time for the targeting tweets are improved to 1.5, 3.0, 12.0, and 22.6 minutes within two 2.5-, 5-, 10- and 40-million record collections, respectively. Further improvement can be achieved by increasing the thread numbers to 4, where the computing time is reduced to 1.1, 2.0, 7.7, and 14.6 minutes, respectively. Compared to one-thread scenario, two- and four-thread can improve the performance by a factor of 40% and 60% in average.
4.2. Prototype
A system prototype has been implemented based on JAVA and Java Server Page (JSP) to demonstrate how to archive, retrieve and process social media data based on the proposed framework. Several open sources are used for the prototype development. For instance, Twitter4j (Citation2014), an unofficial Java library for the Twitter API, is used for accessing streaming tweets, Google Maps API (Citation2014) for mapping the geo-tags tweets, and LingPipe (Citation2014) for performing sentimental analysis.
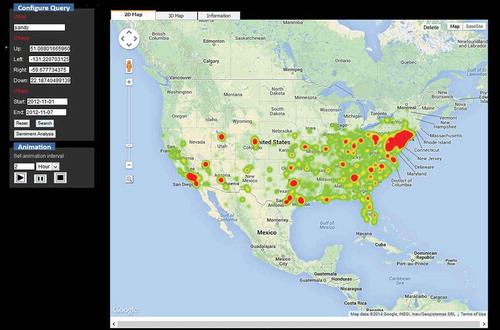
Currently, the web portal supports several functions from submitting a spatiotemporal query request to visualizing or animating the query results. First, users can set up the input parameters of the query, such as, keywords, temporal information (date and time), area of interest (also known as spatial domain information) and analytical methods (visualization or animation), etc. After obtaining query results back, users are able to visualize the results to get an overall view about spatial distribution patterns of the tweets related to a specific topic, as well as animate the results to see the spatiotemporal patterns of the tweets retrieved from the DB. shows the visualization of the tweets (17,195 in total) that include ‘Sandy’ and send during 1 November 2012 to 7 November 2012 across the United States.
Figure 7. Configuring and submitting a spatiotemporal query, and visualizing tweets commenting about Hurricane Sandy in 2012.
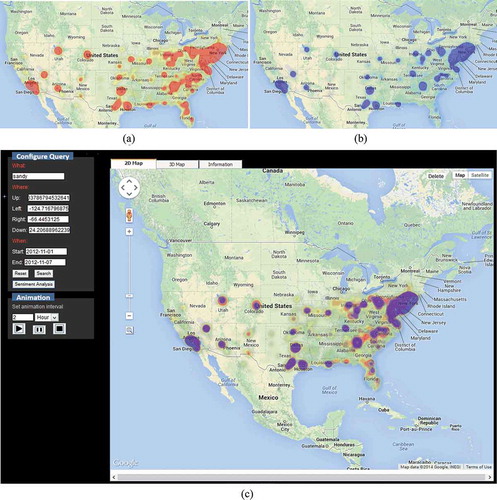
After fetching the tweets of a specific theme (such as the hurricane Sandy or government) from the DB, users can perform sentiment analysis of tweets. shows twitter users’ attitude to the hurricane Sandy occurred in 2012, where tweets (11,144 out of 17,195) with negative opinions are represented with red tone, while tweets with positive emotions are depicted with blue tone. The results indicate that almost twice users hold a negative attitude towards such a natural disaster event.
Figure 8. Sentiment analysis results: (a) negative tweets, (b) positive tweets, (c) negative and positive tweets overlay.
5. Conclusion
This paper proposed and prototyped a data-driven framework to address the big data archiving, retrieving and computing changes for social media data exploration by leveraging non-relational DB and parallel computing. Methodologies for designing and implementing the proposed framework are elaborated in Section 3. To test the feasibility of the framework, a prototype system is developed. In this paper, we have experimentally studied the performance of parallel computing for querying the DB, supporting concurrent requests and performing sentiment analysis, and compared against the traditional serial computing both one and two physical DB servers. Our preliminary results show that the proposed non-relational DB and parallel computing can facilitate the big social media data sets query and analysis with a performance improvement of more than 40%.
Cloud computing becomes a promising computing infrastructure to accelerate geoscience research and applications by pooling, elastically sharing and integrating latest computing technologies and deploying physically distributed computing resources (Huang, Yang, Liu, et al. Citation2013). Therefore, cloud storage should be investigated and leveraged for the massive social media data archiving. In addition, more research efforts should be devoted on integrating elastic computing power for handling the computing demands from mining big social media data, and massive concurrent access of an online analytical system.
References
- Agrawal, D., S. Das, and A. El Abbadi. 2011. “Big Data and Cloud Computing: Current State and Future Opportunities.” In Proceedings of the 14th International Conference on Extending Database Technology, edited by A. Ailamaki, S. Amer-Yahia, J. Pate, T. Risch, P. Senellart, and J. Stoyanovich, Uppsala, 530–533. New York: ACM.
- Aouragh, M., and A. Alexander. 2011. “The Egyptian Experience: Sense and Nonsense of the Internet Revolution.” International Journal of Communication 5: 15.
- Banker, K. 2011. MongoDB in Action. Greenwich, CT: Manning Publications.
- Culnan, M. J., P. J. McHugh, and J. I. Zubillaga. 2010. “How Large US Companies Can Use Twitter and Other Social Media to Gain Business Value.” MIS Quarterly Executive 9 (4): 243–259.
- Earle, P. S., D. C. Bowden, and M. Guy. 2011. “Twitter Earthquake Detection: Earthquake Monitoring in a Social World.” Annals of Geophysics 54 (6): 708–715.
- Elwood, S., M. F. Goodchild, and D. Z. Sui. 2012. “Researching Volunteered Geographic Information: Spatial Data, Geographic Research, and New Social Practice.” Annals of the Association of American Geographers 102 (3): 571–590. doi:10.1080/00045608.2011.595657.
- Frank, M. R., L. Mitchell, P. S. Dodds, and C. M. Danforth. 2013. “Happiness and the Patterns of Life: A Study of Geolocated Tweets.” Scientific Reports 3: 2013. doi:10.1038/srep02625.
- Franke, C., S. Morin, A. Chebotko, J. Abraham, and P. Brazier. 2011. “Distributed Semantic Web Data Management in Hbase and Mysql Cluster.” In Proceedings of the 2011 IEEE 4th International Conference on Cloud Computing, 105–112. Washington, DC: IEEEXplore.
- Fromm, H., and S. Bloehdorn. 2014. “Big Data–Technologies and Potential.” In Enterprise-Integration, edited by G. Schuh and V. Stich, 107–124. Berlin: Springer.
- Gao, H., G. Barbier, and R. Goolsby. 2011. “Harnessing the Crowdsourcing Power of Social Media for Disaster Relief.” IEEE Intelligent Systems 26 (3): 10–14. doi:10.1109/MIS.2011.52.
- González-Bailón, S., J. Borge-Holthoefer, A. Rivero, and Y. Moreno . 2011. “The Dynamics of Protest Recruitment through an Online Network.” Scientific Reports 1: 197. doi:10.1038/srep00197.
- Goodchild, M. F. 2007. “Citizens as Sensors: The World of Volunteered Geography.” GeoJournal 69 (4): 211–221. doi:10.1007/s10708-007-9111-y.
- Google API. 2014. “Google Maps API Tutorial.” Google API. Accessed January 10. http://w3schools.com/googleAPI/default.asp.
- Guion, D. T., D. L. Scammon, and A. L. Borders. 2007. “Weathering the Storm: A Social Marketing Perspective on Disaster Preparedness and Response with Lessons from Hurricane Katrina.” American Marketing Association 26 (1): 20–32.
- Helen, M. 2013. “Data, Data Everywhere: Open Data versus Big Data in the Quest for Transparency.” In Transparency in Politics and the Media: Accountability and Open Government, edited by N. Bowles, J. T. Hamilton, and D. A. L. Levy, 167. New York: I. B. Tauris & Co.
- Huang, Q., C. Yang, K. Benedict, A. Rezgui, J. Xie, J. Xia, and S. Chen. 2013. “Using Adaptively Coupled Models and High-performance Computing for Enabling the Computability of Dust Storm Forecasting.” International Journal of Geographical Information Science 27 (4): 765–784. doi:10.1080/13658816.2012.715650.
- Huang, Q., C. Yang, K. Benedict, S. Chen, A. Rezgui, and J. Xie. 2013. “Utilize Cloud Computing to Support Dust Storm Forecasting.” International Journal of Digital Earth 6 (4): 338–355. doi:10.1080/17538947.2012.749949.
- Huang, Q., C. Yang, K. Liu, J. Xia, C. Xu, J. Li, Z. Gui, M. Sun, and Z. Li. 2013. “Evaluating Open Source Cloud Computing Solutions for Geosciences.” Computers & Geosciences 59 (9): 41–52. doi:10.1016/j.cageo.2013.05.001.
- Keen, J., R. Calinescu, R. Paige, and J. Rooksby. 2012. “Big Health Data: Institutional and Technological Challenges.” Paper presented at IPP2012 Conference ‘Big Data, Big Challenges’, Oxford, September.
- Li, Z., C. Yang, H. Wu, W. Li, and L. Miao. 2011. “An Optimized Framework for Seamlessly Integrating OGC Web Services to Support Geospatial Sciences.” International Journal of Geographical Information Science 25 (4): 595–613.
- LingPipe. 2014. “LingPipe.” LingPipe. Accessed January 10. http://alias-i.com/lingpipe/index.html.
- Madsen, A. K. 2012. “Between Technical Constraints and Epistemic Assumptions.” Paper presented at Internet, Politics, Policy, Oxford, September 20.
- Manovich, L. 2011. “Trending: The Promises and the Challenges of Big Social Data.” In Debates in the Digital Humanities, edited by M. K. Gold, 460–475. Cambridge, MA: The University of Minnesota Press.
- Membrey, P., E. Plugge, and T. Hawkins. 2010. The Definitive Guide to MongoDB: The NoSQL Database for Cloud and Desktop Computing. New York: Apress.
- Murthy, D., and S. A. Longwell. 2013. “Twitter and Disasters: The Uses of Twitter during the 2010 Pakistan Floods.” Information, Communication & Society 16 (6): 837–855. doi:10.1080/1369118X.2012.696123.
- Nah, F. 2004. “A Study on Tolerable Waiting Time: How Long are Web Users Willing to Wait?” Behaviour and Information Technology 23 (3): 153–163.
- Nambiar, R., R. Chitor, and A. Joshi. 2014. “Data Management–A Look Back and a Look Ahead.” In Specifying Big Data Benchmarks, edited by R. Tilmann, P. Meikel, B. Chaitanya, and J. Hans-Arno, 11–19. Berlin: Springer.
- Narock, T., and P. Hitzler. 2013. “Crowdsourcing Semantics for Big Data in Geoscience Applications.” In AAAI Fall Symposium Series. Palo Alto, CA: The Association for the Advancement of Artificial Intelligence Press.
- Roth, R. E. 2013. “Interactive Maps: What We Know and What We Need to Know.” The Journal of Spatial Information Science 6: 59–115.
- Savage, M., F. Devine, N. Cunningham, M. Taylor, Y. Li, J. Hjellbrekke, B. L. Roux, S. Friedman, and A. Miles. 2013. “A New Model of Social Class? Findings from the BBC’s Great British Class Survey Experiment.” Sociology 47 (2): 219–250. doi:10.1177/0038038513481128.
- Schadt, E. E., M. D. Linderman, J. Sorenson, L. Lee, and G. P. Nolan. 2010. “Computational Solutions to Large-Scale Data Management and Analysis.” Nature Reviews Genetics 11: 647–657. doi:10.1038/nrg2857.
- Shanmugasundaram, J., K. Tufte, C. Zhang, G. He, D. J. DeWitt, and J. F. Naughton. 1999. “Relational Databases for Querying XML Documents: Limitations and Opportunities.” In Proceedings of the 25th International Conference on Very Large Data Bases, edited by M. P. Atkinson, M. E. Orlowska, P. Valduriez, S. B. Zdonik, and M. L. Brodie, 302–314. San Francisco, CA: Morgan Kaufmann. Accessed September 7–10.
- Shekhar, S., M. R. Evans, V. Gunturi, K. Yang, and D. C. Cugler. 2014. “Benchmarking Spatial Big Data.” In Specifying Big Data Benchmarks, edited by R. Tilmann, P. Meikel, B. Chaitanya, and J. Hans-Arno, 81–93. Berlin: Springer.
- Shekhar, S., V. Gunturi, M. R. Evans, and K. Yanger. 2012. “Spatial Big-Data Challenges Intersecting Mobility and Cloud Computing.” In Proceedings of the Eleventh ACM International Workshop on Data Engineering for Wireless and Mobile Access (MobiDE ‘12), 1–6. doi:10.1145/2258056.2258058.
- Sheth, A., C. Henson, and S. Sahoo. 2008. “Semantic Sensor Web.” IEEE Internet Computing 12 (4): 78–83.
- Signorini, A., A. M. Segre, and P. M. Polgreen. 2011. “The Use of Twitter to Track Levels of Disease Activity and Public Concern in the US during the Influenza a H1N1 Pandemic.” Plos One 6 (5): e19467. doi:10.1371/journal.pone.0019467.
- Singh, V. K., M. Gao, and R. Jain. 2010. “Social Pixels: Genesis and Evaluation.” In Proceedings of the International Conference on Multimedia, Firenze, 481–490. New York: ACM.
- Sowe, S. K., and K. Zettsu. 2014. “Curating Big Data Made Simple: Perspectives from Scientific Communities.” Big Data 2 (1): 23–33. doi:10.1089/big.2013.0046.
- Statistics Brain. 2014. “Twitter Statistics.” Statistics. Accessed January 10. http://www.statisticbrain.com/twitter-statistics/.
- Sui, D., and M. F. Goodchild. 2011. “The Convergence of GIS and Social Media: Challenges for GIScience.” International Journal of Geographical Information Science 25 (11): 1737–1748. doi:10.1080/13658816.2011.604636.
- Sutton, J. N. 2010. “Twittering Tennessee: Distributed Networks and Collaboration following a Technological Disaster.” The 7th international conference on information system for crisis response and management, Seattle, WA, May 2–5.
- Thelwall, M., K. Buckley, and G. Paltoglou. 2011. “Sentiment in Twitter Events.” Journal of the American Society for Information Science and Technology 62 (2): 406–418. doi:10.1002/asi.21462.
- Thomases, H. 2009. Twitter Marketing: An Hour a Day. Hoboken, NJ: John Wiley & Sons.
- Twitter statistics. 2014. “Twitter, by the Numbers.” Twitter statistics. Accessed January 10. http://news.yahoo.com/twitter-statistics-by-the-numbers-153151584.html.
- Twitter4j. 2014. “Twitter4j.” Twitter4j. Accessed January 10. http://twitter4j.org/en/index.html.
- Verma, S., S. Vieweg, W. J. Corvey, L. Palen, J. H. Martin, M. Palmer, A. Schram, and K. M. Anderson, eds. 2011. “Natural Language Processing to the Rescue? Extracting ‘Situational Awareness’ Tweets during Mass Emergency.” In Proceedings of the 5th International AAAI Conference on Weblogs and Social Media, 385–392. Palo Alto, CA: The Association for the Advancement of Artificial Intelligence press.
- Vieweg, S., A. L. Hughes, K. Starbird, and L. Palen. 2010. “Microblogging during Two Natural Hazards Events: What Twitter May Contribute to Situational Awareness.” In Proceedings of the SIGCHI Conference on Human Factors in Computing Systems, edited by E. Mynatt, G. Fitzpatrick, S. Hudson, K. Edwards, and T. Rodden, 1079–1088. New York: ACM.
- Xu, C., D. W. Wong, and C. Yang. 2013. “Evaluating the ‘Geographical Awareness’ of Individuals: An Exploratory Analysis of Twitter Data.” Cartography and Geographic Information Science 40 (2): 103–115. doi:10.1080/15230406.2013.776212.
- Yang, C., Q. Huang, Z. Li, C. Xu, and K. Liu. 2014. Spatial Cloud Computing: A Practical Approach, 304. Boca Raton, FL: CRC Press/Taylor & Francis. ISBN: 978-1466593169.
- Zikopoulos, P., and C. Eaton. 2011. Understanding Big Data: Analytics for Enterprise Class Hadoop and Streaming Data. New York: McGraw-Hill Osborne Media.