
Abstract
Urban population growth has been accelerating in the developing countries and this exerts tremendous pressure on available land resources in major cities and urban centres. Greater Doha, which is a metropolis area where 78% of the country’s population live, has witnessed a substantial population growth and a large urban expansion. This study is the first of its kind in the State of Qatar and it aims to provide an understanding of the land use/land cover (LULC) change and its spatio-temporal pattern in Greater Doha between the years 1997 and 2010. Parcel data and census statistics from these two dates were used in the analysis. LULC change statistics indicate a very large increase of 289% in the built-up areas and a larger increase of 426% of recreational spaces which shows a progressive planning approach towards improving living standards in Greater Doha. As a result of this development demands, the open spaces have been substantially reduced from 77% to 25%, population density increased in many parts of the metropolis and high-rise building started to dominate the skylines in certain parts of the metropolis. MARKOV model was used to generate future LULC change scenarios for the year 2020. The analysis predicts a 20% increase of built-up areas which will take place in the open spaces, and this modest increase may be explained by model constraints resulting from limited availability of land within the current boundaries of Greater Doha for future development.
1. Introduction
Over the history of mankind, records show that there is a systematic population migration from rural to urban form of life. According to the 2011 Revision of World Urbanization Prospects (United Nations Citation2012), the world’s urban population increased from 0.75 billion to 3.63 billion between 1950 and 2011. Furthermore, this urban population is projected to reach 6.25 billion (67.2%) by 2050. The growth of urban population is one of the most important driving forces of change in urban systems where cities expand horizontally and vertically to accommodate new comers. This urban growth is manifested by the development of suburban expansion and redevelopment of the city centres, or by urban sprawl in the case of rapid suburbanization (Duany, Speck, and Plater-Zyberk Citation2001; Gordon and Richardson Citation1997). Studies show that rapid urban growth may cause social, physical and environmental challenges. Under such urbanization conditions, agricultural land and forests at urban fringes are converted to residential and industrial areas (Nuissl et al. Citation2009), which weakens ecosystem and landscape functions (Curran and de Sherbinin Citation2004; de Groot, Wilson, and Boumans Citation2002).
In order to improve the process of land use planning, information on present land use patterns and simulations of its changes over the course of time is essential for effective planning (Bagan and Yamagata Citation2012). This has led to numerous studies in many countries around the world that are experiencing a rapid change in their urban landscape in order to understand urban growth needs and to forecast future tendencies and developmental requirement. Such studies can be the cornerstone in human pursuit to better understand and to rationalize the forces which we exert over the land to meet our growing demands. This was the wisdom behind the establishment of the ‘land use and land cover change (LUCC)’ research programme which was created by the International Geosphere-Biosphere Program and the Global Environmental Change in the Humanities Program (Zhang et al. Citation2010). It is understood that land use/land cover (LULC) change is among the greatest environmental concern and it is the key to many applications in various fields such as environment, forestry, hydrology, agriculture (Li and Yeh Citation1998), geology and ecology (Weng Citation2001). In fact, LULC change has become recognized since the mid-1980s as an important global environmental change in its own right (Turner Citation2002).
Urban growth affects the ecology of cities in a number of ways, such as eliminating and fragmenting native habitats, modifying local climate conditions and generating anthropogenic pollutants. Also, it is widely recognized that the spatial pattern of a landscape affects ecological processes (Wu and Loucks Citation1995). Tremendous urban expansion with high inflow of population from the local or distant places results in a change in urban morphology, expansion of impervious surface and conversion of productive lands in and around urbanized area, and affects natural and human systems at all geographic scales. In addition, rapid urbanization is conceived to be a major inducer of climate change despite the fact that the urban areas worldwide represent only a small fraction of the total land surface (McCarthy, Best, and Betts Citation2010; Zhang et al. Citation2013). Urban heat islands which are formed in urban centres represent one form of this climate change and they have an adverse effect on urban air quality and health conditions of urban dwellers (Hattis, Ogneva-Himmelberger, and Ratick Citation2012). Urban crowding, housing shortages and lack of infrastructure, as well as impact of increasing urban expansion on fertile lands calls for immediate attention to sustainable and effective management and planning of urban areas. Innovative approaches in urban land use planning and management are the need of the hour to achieve sustainable development and smart growth (Kaiser, Godschalk, and Chapin Citation1995).
LULC change studies have benefited greatly from the latest advancement in geospatial science and its associated technology. Such advancement enabled in-depth investigations of issues related to LULC change detection, spatio-temporal analysis (Coppin et al. Citation2004; Zhou, Li, and Kurban Citation2008) and prediction of future needs for urban expansion (Liu and Zhou Citation2005). Land use change models have evolved to visualize and support the analysis of the causes and consequences of land use. According to Verburg et al. (Citation2004), scenario analysis with land use models is useful in land use planning and policy. These models give a better understanding of land use system and support efficient land use planning and policy. They are also valuable to investigate simultaneously the socio-economic and biophysical forces that influence the rates and spatial pattern of land use and land cover (Yackulic et al. Citation2011) which are otherwise complex blend of factors. These models support the exploration of future land use changes under different scenario conditions. They are also reproducible tools that supplement our existing capabilities to analyse land use change and to make more informed decisions (Costanza and Ruth Citation1998). Such models rely on Geographic Information Systems (GIS) and satellite remote sensing techniques which can be effectively applied to detect LULC changes in urban expansion (López et al. Citation2001; Prenzel Citation2004; Weng et al. Citation2003), urban planning (Li and Yeh Citation1998), as well as in cropland and forest loss (Li and Yeh Citation2004).
To the best of our knowledge, this study is the first of its kind in the State of Qatar and this is evident in the published literature. The study comes at a crucial juncture as the country is in the process of developing its urban master plan for the year 2030 in order to cope with the ever-growing urban and developmental demands. The overall objective of this study is to understand the LULC change in Greater Doha and its spatio-temporal pattern between the years 1997 and 2010. This will help to recognize the types of LULC changes that have been mostly affected by this massive urban growth and to understand the inter-relationship between this LULC change and population change. This study will also forecast the future land use scenarios in the metropolis based on the previous and current controlling parameters. GIS will be used to collate the existing data, to carry out the spatial analysis and to run the land cover prediction model.
2. Methodology
2.1. Study area
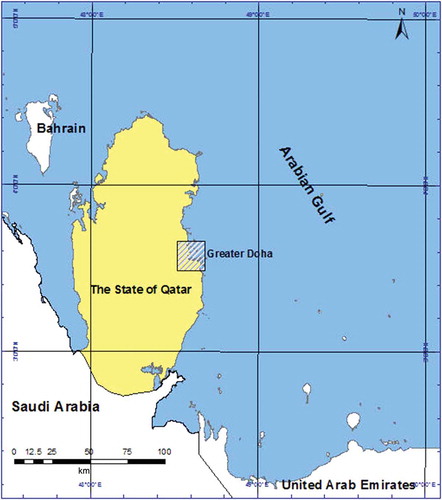
The State of Qatar is a peninsula located along the west coast of the Arabian Gulf. This gulf borders Qatar from the east, west and north sides. Qatar is bordered by the Kingdom of Saudi Arabia from the south which provides the country with its land access to the Arabian Peninsula (Hashem Citation2013). Qatar’s area is 11,437 square kilometres which is mostly desert with modest agricultural activities in land depressions which rely on fast-depleting ground water resources. Historically, the country has a relatively small population which has grown from 111,133 in 1970 to 744,029 in 2004. However, this population surged within the following 7 years to reach an estimated figure of 1.8 million in 2011 (Qatar Statistics Authority Citation2011) with an average annual growth of 20%. This substantial population growth has been fuelled by the booming oil and gas industry which attracted a large number of temporary migrant workforces. These workforces came to Qatar to take up jobs created by various sectors of industry, construction, service and education. Currently, around 84% of the country’s population is made up of expatriates, and the Qatari nationals make up 16% of the population.
Greater Doha () is a metropolis area which is made up of a number of adjacent cities and urban areas where the majority of the country’s population is concentrated. This metropolis is comprised of the capital city of Doha (the old city), the city of Al-Rayyan and other small towns and urban centres of Umm Salal Muhammad, Umm Salal Ali, Al-Daayen, Al-Khuraitiat and Umm Al-Afa’i. Greater Doha has witnessed a swift change in response to the rapid economic development in the country which resulted in a very high population growth and a large-scale urbanization. This has led to a massive land use change in the metropolis in favour of built-up areas to cater for the population’s growing needs. A new mushrooming phenomenon of high-rise buildings and skyscrapers started to appear in the skylines of metropolis over the last 10 years. This new trend of buildings represents a direct response to the growing urban needs in Qatar for both residential and business purposes. It is estimated that around 78% of country’s population live within Greater Doha, with an average annual growth rate of 6.3% over the last decade (Qatar Statistics Authority Citation2012).
Figure 1. Location map for Greater Doha, the State of Qatar.
2.2. Data sources
In order to analyse the patterns of land use changes in Greater Doha, different types of data were needed. Secondary sources included vector-based GIS data and census data. These data were obtained through the national GISnet, a fibre-optics network which connects 64 hubs representing the main public agencies in Qatar that deal with geospatial data. Data needed in this study include administrative boundaries (census zones and census blocks where a block is the lowest administrative unit in Qatar), parcel boundaries and descriptions, population data (at administrative zone level), building footprints, road network, urban topography polygons and ortho-rectified aerial photography for specific dates. The parcel land use data were verified through field visits to validate land use types.
2.3. Land use change analysis
Recent advances in geospatial-based modelling have greatly enabled the process of analysing and simulating spatial patterns in land use change analysis (Sang et al. Citation2011). This process of analysis and simulation relies on robust and comprehensive geospatial databases that describe physical-control parameters such as current urban extent, main transportation networks, protected areas and the topography. Currently, there are many readily available land use change models which provide analysts with the necessary tools to understand the past change and predict the future growth. MARKOV model has been widely used in this context because it has the ability to integrate remote sensing and GIS efficiently into the model (Kamusoko et al. Citation2009). The model is based on a stochastic approach where future trend scenarios are based on current situation in a non-deterministic manner. Thus, this model is used in this study.
In order to correlate population change to land use change, population densities from 1997 and 2010 were calculated as per administrative block in order to spatially display population growth in Greater Doha. Another measure of land use change over the period of 13 years is the magnitude of urbanism. This urbanism measure was calculated by totalling the number of buildings per zone (for 1997 and 2010). This process produced two maps which describe urban expansion during this period. In this calculation, a distinction was made between the built-up and non-built-up areas in order to understand the urban expansion irrespective of urban sub-type. This gives a strong indication of the trend and direction of urban growth which may explain the socio-economic change since 1997 as manifested by the very recent adaptation to high-rise life in the study area.
MARKOV model is available as a module within IDRISI package. This model is raster based and it requires a pair of land use maps. The first map represents the land use at a specific date in the past, whereas the second map represents the current land use situation. The model produces three forms of output. The first output is a transition areas matrix which registers the number of pixels that are expected to change from each land use type to each other land use type. Second output is a transition probability matrix that registers the probability that each land use category will change to every other category. Third output is a set of conditional probability maps (as projections) which display the probability of each land use type that might be found at each pixel.
The LULC classification system for Greater Doha has been developed as shown in , based on the cadastral land use data obtained from the planning department in the State of Qatar. The table shows six LULC classes at level I which are agricultural areas (farms), open spaces (undeveloped areas), industrial areas, recreation, transportation (areal extent of road networks, parking spaces etc.) and built-up areas (areas developed for residential, commercial etc. purposes). In order to construct the input maps needed by the MARKOV model, the transportation class was merged into the built-up area class to facilitate model implementation. When the MARKOV model was run, it returned probability images for each land use type which were then hardened and combined into a projected land use map for 2020. This 2020 year is of special interest in Qatar where many development projects for the FIFA 2022 are expected to be completed ahead of this mega event.
Table 1. Land use and land cover classification system for Greater Doha.
3. Results and discussion
3.1. Land use/land cover change analysis
The LULC distribution of an area is strongly linked to the natural and socio-economic dynamics of that area and it is dependent on human activities in space and time. The outcomes of this study show beyond any doubt the magnitude of LULC change which Greater Doha has undergone over a period of 13 years between 1997 and 2010. The LULC maps for two specific dates of 1997 and 2010 were constructed ( and ) using the parcel data. To do so, the parcel polygons were aggregated in line with the specific LULC classes outlined in .
Figure 2. Land use/land cover types in 1997.
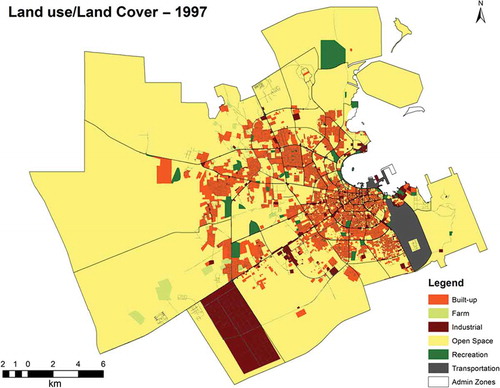
Figure 3. Land use/land cover types in 2010.
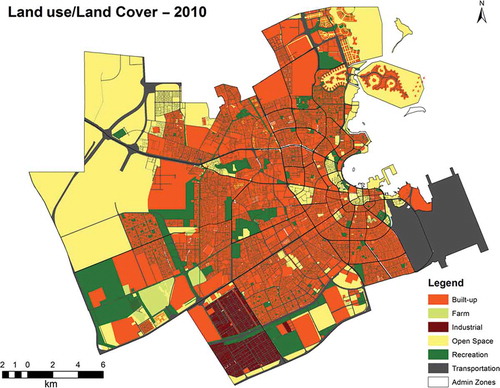
The figures show a significant change in land utilization over this period where large parts of open spaces have been converted to other types of land use. LULC statistics have been extracted from the 1997 and 2010 maps using GIS techniques (). These statistics indicate that open spaces in Greater Doha have reduced from 76.81% to 25.3%. This space reduction is explained by the drive to meet the fast-growing development demands for residential, commercial and recreational needs in the booming metropolis. This trend is somehow similar to other countries characterized by fast-growing population and the magnetic effect of major urban centres similar to the results reported by Dewan and Yamaguchi (Citation2009) and Islam (Citation1999). The table also shows that there is an increase by 288.65% and a greater increase of 426.42% for built-up and recreational areas, respectively. This greater increase in recreational spaces indicates a positive planning attitude towards improving living standards in Greater Doha. What’s striking, however, is the increase of farm area by 72.18% which can be attributed to large plots near the western peripheries. These plots are owned by the state and they rely on treated water from a nearby large pond for crop irrigation in an attempt to improve the food security in the country.
Table 2. Land use/land cover change analysis over a period of 13 years between 1997 and 2010.
As has been stated before, LULC patterns cannot be understood in isolation from the human factor. and a show the population density of Greater Doha in 1997 and 2010, respectively, expressed as the number of inhabitants per square kilometre at the census block level. These figures indicate a substantial change in population densities and in spatial distribution over the study period. Similar to many metropolis areas around the world, there is a systematic population shift from the traditional old parts of the City of Doha (as shown in and ) to the new urban areas in the north, west and south directions (). The urban expansion towards the east of Greater Doha is though limited by the sea, and it has witnessed a remarkable change by the creation of the ‘Pearl Qatar’ artificial island through dredging. Once completed, this artificial island will provide modern and luxury high-rise urban development to affluent – and mostly expatriate – residents in Greater Doha (some parts of the island were completed by end of 2013 and they became home to new dwellers).
Figure 4. Population density of Greater Doha (per square kilometre) in 1997 (a) and a zoomed area around the City of Doha (b).
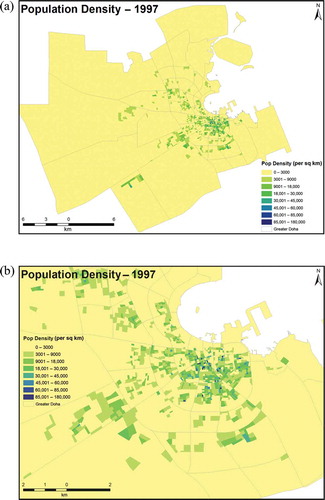
Figure 5. Population density of Greater Doha (per square kilometre) in 2010 (a) and a zoomed area around the City of Doha (b).
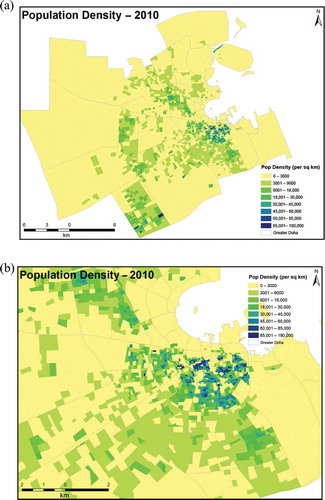
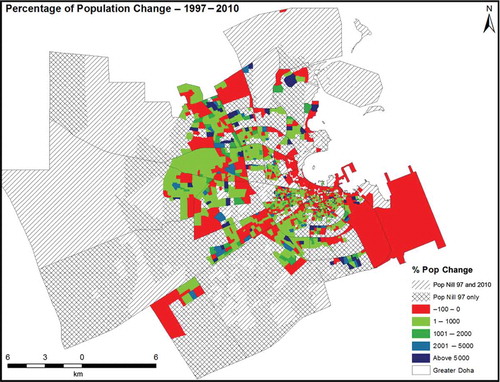
Figure 6. Population change between 1997 and 2010. Notice areas where population is reduced or totally relocated.
These changes are closely linked to the socio-economic transformation in Qatar which has started after the discovery and export of fossil fuel in large volumes in 1960s. The transformation has accelerated at an unprecedented pace over the last two decades due to boom in the global demand for oil and due to the massive natural gas discovery and production. Over the period of 1997–2010, the population of Greater Doha increased from 425,462 to 1,174,437 which amounts to 176% increase over such a short span of time (Qatar Statistics Authority Citation2011). This is translated into an increase of average population density from 709 to 1957 inhabitant per square kilometre.
This population’s spatial shift and redistribution were accompanied by a significant change of the urban landscape of the study area. In 1997, a large portion of the metropolis was characterized by a relatively low level of urbanism and building density (). In contrast and over a period of 13 years, the urban landscape has experienced higher urban density in most areas of the metropolis. This was the result of the enormous urban demand in order to provide dwellings for the relocated residents from the City of Doha, as well as for the internal Qatari migration and expatriate incomers into Greater Doha. Also, this urban demand was fuelled by the need to create office spaces and industrial establishments required by the accelerated development (). The total number of buildings in Greater Doha increased from 59,248 to 107,647 over the 13-year period which accounts for 82% increase ().
Table 3. Building density per census block, expressed as number of buildings per square kilometre.
Figure 7. Building density (per square kilometre) in 1997 at the block level.
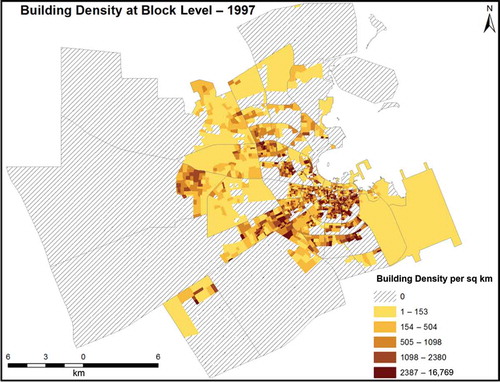
Figure 8. Building density (per square kilometre) in 2010 at the block level.
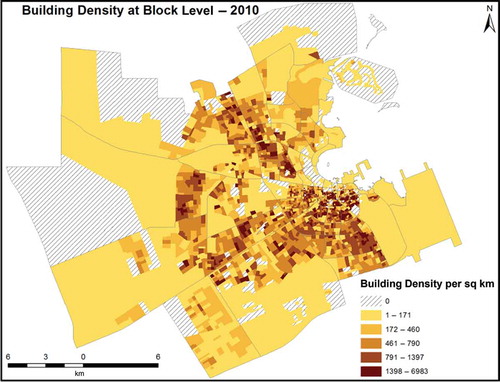
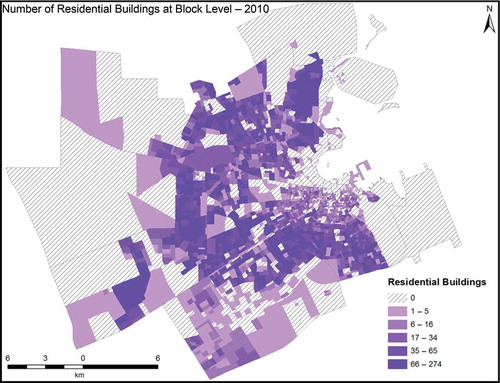
When this figure of increase is compared to the 176% population increase, it shows that the number of people living in one building is growing, which indicates a gradual shift towards multi-storey and high-rise living style. Comparatively in 1990s, the great majority of buildings in the urban landscape of Greater Doha were traditional Arabic style of low-rise buildings (G and G + 1 style). and reveal the spatial distribution for both residential and non-residential buildings in 2010. A large number of non-residential buildings have been pushed away from residential areas towards the peripheries of the metropolis. This indicates a planning strategy to separate the commercial zones from residential zones, contrary to the situation in 1997.
Figure 9. Number of non-residential buildings in 2010 at the block level.
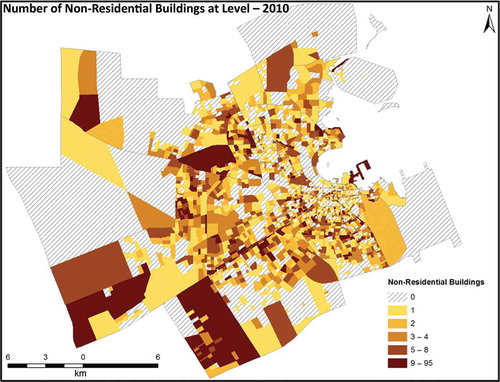
Figure 10. Number of residential buildings in 2010 at the block level.
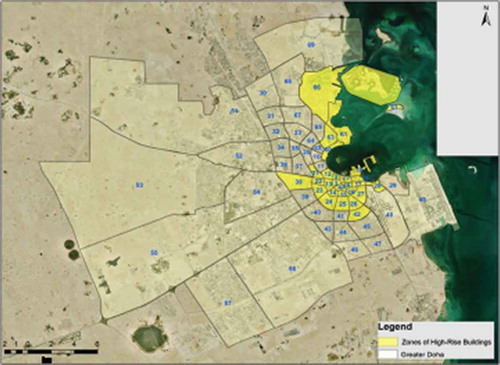
In order to understand the urban expansion over the period 1997–2010, the urban extent and its spatial distribution have been analysed to meet the rapid development demand ( and ). In 1997, the built-up areas amounted to 10.1% of the total area of Greater Doha (equals to 60.53 square kilometres). In 2010, these built-up areas increased to 39.3% of the metropolis total area (equals to 235.25 square kilometres). This increase can be attributed to major projects such as the new airport, Lusail City and the Pearl Qatar and other residential developments in Al-Rayyan, West Bay and other parts of Greater Doha. Also, a new form of vertical urban growth has evolved over the last decade in order to cater for the residential, business and commercial needs. High-rise buildings started to mushroom in Greater Doha and dominate its skylines. shows the locations of high-rise developments which are concentrated in the Pearl Qatar, around Doha’s Corniche and the inner areas inside the C-Ring road.
Figure 11. Urban extent in Greater Doha as in 1997.
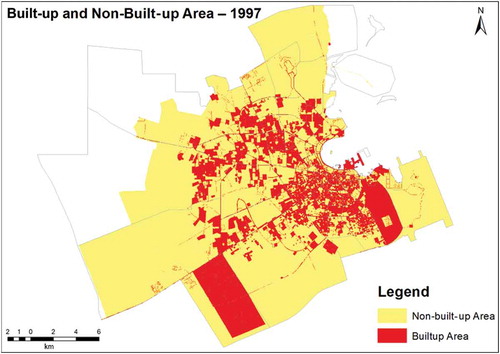
Figure 12. Urban extent of Greater Doha as in 2010.
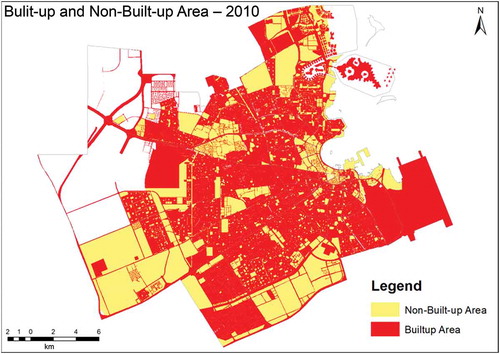
Figure 13. High-rise building zones in Greater Doha in 2010.
It is worth mentioning that the study did not conduct any accuracy assessment of the LULC data which were used as inputs into this study. This is because the study relied in cadastral LULC data which are collected by the planning department, based on building permits and their continuous field surveys.
3.2. Modelling future change in Greater Doha
The MARKOV model (which is a module embedded in IDRISI software) has been used in this study and it produced a matrix of transition probability, a matrix of transition areas and conditional probability images. The matrix of transition probability calculated the probability of each LULC category changing to each of the other categories. This matrix is also linked to the matrix of transition areas which calculated the number of pixels that were projected to change from each category to the other categories over a period of 10 years (to 2020). The shows the matrix of transition probability between 2010 and 2020 where rows and columns in this matrix represent the LULC categories for 2010 and 2020, respectively. The table shows that built-up areas have the highest probability of remaining the same, whereas open spaces and industrial areas are more probable to convert to built-up areas. This shows a logical transition in the context of this fast-growing metropolis. The table also shows that there are 23.5% and 16.8% probabilities for the farms to transform into built-up areas and recreational spaces, respectively. The only two categories that have the lowest probability of remaining the same are farms and open spaces, and these statistics are logical when interpreted in line with the future trends of Greater Doha.
Table 4. Transaction probabilities table derived by Markov model from land use/land cover maps of 1997 and 2010.
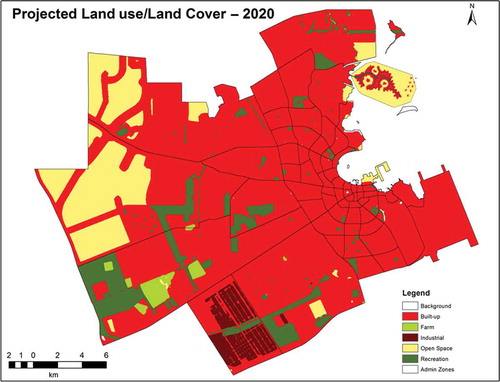
The model was used to project the LULC change from 2010 to 2020, using the matrix of transition probability, the matrix of transition areas and the conditional probability images generated by MARKOV model (). The map shows that most land use change will take place in the open space and built-up categories. The model expects that open spaces will be reduced dramatically by 49.1% in favour of other urban categories. Model also predicts that built-up areas will increase by 20.1% which is below initial expectation at the onset of this study and this can be attributed to boundary restrictions of Greater Doha (). The study projects that the environ of Greater Doha will have to expand to cope with the demand for built-up development in the north and south directions that can provide easy access to the major industrial cities of Mesaieed and Ras Laffan.
Table 5. Statistics and magnitude of land use/land cover projection from 2010 to 2020.
Figure 14. Projected land use/land cover projection map for Greater Doha – 2020.
4. Conclusion
This study investigated the magnitude and trend of LULC change between 1997 and 2010 in Greater Doha, in the light of the unprecedented economic growth in Qatar over the past two decades. It has been found that a very prominent change has taken place in built-up areas, and this trend is similar to other cases in fast-growing major cities (see Dewan and Yamaguchi Citation2009). Recreational provision has increased by an enormous amount of 426.42% which is substantially faster than the change in built-up developments. This indicates a commitment by planning authorities and decision-makers in Qatar to improve the lives of dwellers in the metropolis and to promote Doha as an international destination for business and also as a family-friendly holiday destination. This period also witnessed a massive transport network expansion which has increased by 267.77%, and this figure is well in line with the built-up expansion. These expansions are in direct response to major changes in the socio-economic development in Qatar as a result of the boom in the energy sector which forms the backbone of Qatar’s economy.
The metropolis witnessed a massive foreign labour immigration and inner migration of local Qataris which excreted pressure on planning authorities to expand the old urban boundaries significantly. This expansion took horizontal and vertical forms where new residential and commercial areas have been developed. In response to this massive demand, a new form of high-rise urban development has been introduced in certain parts of the metropolis to cater for residential and commercial demands. Also, industrial activities that were intertwined with the residential fabrics of the city have been moved from their traditional places towards new locations outside the urban centres.
The CA MARKOV model was used to project the future urban growth of Greater Doha in 2020, based on the 2010 LULC patterns. In general, the model predicted growth in built-up areas and a lesser growth in recreation provision. The model produced moderate growth which is attributed to urban boundary restrictions of Greater Doha where available spaces for expansion are limited. The study forecasts that there could be an expansion of the current urban boundary of Greater Doha. The outputs of the CA MARKOV model may be different once such expansion is introduced.
Acknowledgement
We would like to extend our gratitude to Qatar’s Center for GIS (CGIS) for providing GIS data through the national GISnet.
Additional information
Funding
References
- Bagan, H., and Y. Yamagata. 2012. “Landsat Analysis of Urban Growth: How Tokyo became the World’s Largest Megacity during the Last 40 Years.” Remote Sensing of Environment 127: 210–222. doi:10.1016/j.rse.2012.09.011.
- Coppin, P., I. Jonckheere, K. Nackaerts, B. Muys, and Lambin. 2004. “Digital Change Detection Methods in Ecosystem Monitoring: A Review.” International Journal of Remote Sensing 25 (9): 1565–1596. doi:10.1080/0143116031000101675.
- Costanza, R., and M. Ruth. 1998. “Using Dynamic Modeling to Scope Environmental Problems and Build Consensus.” Environmental Management 22: 183–195. doi:10.1007/s002679900095.
- Curran, S. R., and A. De Sherbinin. 2004. “Completing the Picture: The Challenges of Bringing ‘Consumption’ into the Population – Environment Equation.” Population and Environment 26 (2): 107–131. doi:10.1007/s11111-004-0837-x.
- De Groot, R. S., M. A. Wilson, and R. M. J. Boumans. 2002. “A Typology for the Classification, Description and Valuation of Ecosystem Functions, Goods and Services.” Ecological Economics 41 (3): 393–408. doi:10.1016/S0921-8009(02)00089-7.
- Dewan, A., and Y. Yamaguchi. 2009. “Land use and Land Cover Change in Greater Dhaka, Bangladesh: using Remote Sensing to Promote Sustainable Urbanization.” Applied Geography 29 (3): 390–401. doi:10.1016/j.apgeog.2008.12.005.
- Duany, A., J. Speck, and E. Plater-Zyberk. 2001. Smart Growth: New Urbanism in American Communities. New York, NY: McGraw-Hill.
- Gordon, P., and H. W. Richardson. 1997. “Are Compact Cities a Desirable Planning Goal?” Journal of the American Planning Association 63 (1): 95–106. doi:10.1080/01944369708975727.
- Hashem, N. 2013. “Assessing Spatial Equality of Urban Green Spaces Provision: A Case Study of Greater Doha in Qatar.” Local Environment: The International Journal of Justice and Sustainability doi:10.1080/13549839.2013.855182. Taylor & Francis
- Hattis, D., Y. Ogneva-Himmelberger, and S. Ratick. 2012. “The Spatial Variability of Heat-Related Mortality in Massachusetts.” Applied Geography 33: 45–52. doi:10.1016/j.apgeog.2011.07.008.
- Islam, N. 1999. Urbanization, Migration and Development in Bangladesh: Recent Trends and Emerging Issues. CPD-UNFPA Series 1. Dhaka: Center for Policy Dialogue.
- Kaiser, E., D. Godschalk, and S. F. Chapin Jr. 1995. Urban Land use Planning. 4th ed., 493p. Urbana: University of Illinois.
- Kamusoko, C., M. Aniya, B. Adi, and M. Manjoro. 2009. “Rural Sustainability under Threat in Zimbabwe – Simulation of Future Land Use/Cover Changes in the Bindura District Based on the Markov-Cellular Automata Model.” Applied Geography 29 (3): 435–447. doi:10.1016/j.apgeog.2008.10.002.
- Li, X., and A. G. O. Yeh. 1998. “Principal Component Analysis of Stacked Multi-Temporal Images for the Monitoring of Rapid Urban Expansion in the Pearl River Delta.” International Journal of Remote Sensing 19 (8): 1501–1518. doi:10.1080/014311698215315.
- Li, X., and A. G. O. Yeh. 2004. “Analyzing Spatial Restructuring of Land use Patterns in Fast Growing Region using Remote Sensing and GIS.” Landscape and Urban Planning 69 (4): 335–354. doi:10.1016/j.landurbplan.2003.10.033.
- Liu, H., and Q. Zhou. 2005. “Developing Urban Growth Predictions from Spatial Indicators Based on Multi-Temporal Images.” Computers, Environment and Urban Systems 29 (5): 580–594. doi:10.1016/j.compenvurbsys.2005.01.004.
- López, E., G. Bocco, M. Mendoza, and E. Duhau. 2001. “Predicting Land-Cover and Land Use Change in the Urban Fringe: A Case in Morelia City, Mexico.” Landscape and Urban Planning 55: 271–285. doi:10.1016/S0169-2046(01)00160-8.
- McCarthy, M. P., M. J. Best, and R. A. Betts. 2010. “Climate Change in Cities due to Global Warming and Urban Effects.” Geophysical Research Letters 37: L09705. doi:10.1029/2010GL042845.
- Nuissl, H., D. Haase, M. Lanzendorf, and H. Wittmer. 2009. “Environmental Impact Assessment of Urban Land use Transitions – A Context-Sensitive Approach.” Land Use Policy 26 (2): 414–424. doi:10.1016/j.landusepol.2008.05.006.
- Prenzel, B. 2004. “Remote Sensing Based Quantification of Land-Cover and Land-Use Change for Planning.” Progress in Planning 61: 281–299. doi:10.1016/S0305-9006(03)00065-5.
- QSA (Qatar Statistics Authority). 2011. Population census and projection. Accessed April 14. http://www.qsa.gov.qa/eng/index.htm
- QSA (Qatar Statistics Authority). 2012. The 27th Issue of “Qatar in Figures”. Doha: QSA Publication.
- Sang, L., C. Zhang, J. Yang, D. Zhu, and W. Yun. 2011. “Simulation of Land Use Spatial Pattern of Towns and Villages Based on CA–Markov Model.” Mathematical and Computer Modelling 54: 938–943. 2011. 10.1016/j.mcm.2010.11.019.
- Turner II, B. L. 2002. “Toward Integrated Land-Change Science: Advances in 1.5 Decades of Sustained International Research on Land-Use and Land Cover Change.” In Challenges of a Changing Earth, edited by W. Steffen, J. Jäger, D. J. Carson, and C. Bradhsaw, 21–26. Berlin: Springer.
- United Nations. 2012. World Urbanization Prospects: The 2011 Revision United Nations. New York: Population Division of the Department of Economic and Social Affairs. ESA/P/WP/224.
- Verburg, P. H., P. P. Schot, M. J. Dijst, and A. Veldkamp. 2004. “Land use change Modelling: Current Practice and Research Priorities.” GeoJournal 61: 309–324. doi:10.1007/s10708-004-4946-y.
- Weng, Q. 2001. “A Remote Sensing – GIS Evaluation of Urban Expansion and Its Impacts on Surface Temperature in the Zhujiang Delta, China.” International Journal of Remote Sensing 22 (10): 1999–2014.
- Weng, Q., L. Qiao, S. Yang, and H. Guo. 2003. “Guangzhou’s Growth and Urban Planning, 1960–1997: An Analysis through Remote Sensing.” Asian Geographer 22 (1–2): 77–92. doi:10.1080/10225706.2003.9684100.
- Wu, J., and O. L. Loucks. 1995. “From Balance of Nature to Hierarchical Patch Dynamics: A Paradigm Shift in Ecology.” The Quarterly Review of Biology 70: 439–466. doi:10.1086/419172.
- Yackulic, C. B., M. Fagan, M. Jain, A. Jina, Y. Lim, M. Marlier, R. Muscarella, P. Adame, R. DeFries, and M. Uriarte. 2011. “Biophysical and Socioeconomic Factors Associated with Forest Transitions at Multiple Spatial and Temporal Scales.” Ecology and Society 16 (3): 15. doi:10.5751/ES-04275-160315.
- Zhang, H., Z.-F. Qi, X.-Y. Ye, Y.-B. Cai, W.-C. Ma, and M.-N. Chen. 2013. “Analysis of Land Use/Land Cover Change, Population Shift, and Their Effects on Spatiotemporal Patterns of Urban Heat Islands in Metropolitan Shanghai, China.” Applied Geography 44: 121–133. 2013. 10.1016/j.apgeog.2013.07.021.
- Zhang, X., T. Kang, H. Wang, and Y. Sun. 2010. “Analysis on Spatial Structure of Land Use Change Based on Remote Sensing and Geographical Information System.” International Journal of Applied Earth Observation and Geoinformation 12: S145–S150. doi:10.1016/j.jag.2010.04.011.
- Zhou, Q., B. Li, and A. Kurban. 2008. “Spatial Pattern Analysis of Land Cover Change Trajectories in Tarim Basin, Northwest China.” International Journal of Remote Sensing 29 (19): 5495–5509. doi:10.1080/01431160802060938.