
Abstract
The exponential growth of cities in India due to urbanization resulted in increased use of non-renewable energy resources to meet the essential power requirements of urban built environment. It is essential for urban planners to provide innovative solutions in context of urban energy simulation based on virtual 3D city models. The recent 3D geoinformation science studies are insufficient in providing optimal solutions because of lack of emerging concepts and integrated softwares. Presently 3D GIS data can be generated into various LODs (Levels of Detail) depending upon the application requirement and input data used. There are various 3D GIS softwares like Google SketchUp, ESRI CityEngine etc., which are being used mostly for data creation especially for boundary representation for geometry abstraction without semantic information. The 3D GIS data conversion from native format into City Geography Markup Language (CityGML) enhances it by providing information both at geometric and at semantic level in interoperable format. A building information model of Geoinformatics department building in IIRS campus is created using Google SketchUp and exported to energy modelling program in gbXML schema. The present investigation explores the semantic characteristics of developed CityGML model for solar thermal and photovoltaic energy production potential assessment based on building semantic components. The amount of solar irradiation incident on bounding features and also illumination obtained through openings of building is quantized using SunCast and RadianceIES application of IESVE Software, respectively. The simulated energy data are integrated with building semantic features and stored in open-source PostGIS RDBMS to address basic semantic queries.
1. Introduction
The rapid growth of cities in recent past has accentuated thinking of urban designers to provide 3D city models–based spatial analysis in order to address complicated urban planning scenarios. An ideal virtual 3D environment aids urban designer to simulate and analyse various urban environment scenarios related to heat, noise, lighting, ventilation, sun illumination and pollution conditions. The key research area in 3D geoinformation management concerning urban space is its registration as an operational 3D analytical system (Zhang, Zhu, and Wang Citation2004). The 3D data-sets generated are often available in native data format and lacks interoperability in order to be useful for any kind of spatial analysis. The integration of building information models (BIMs) and geospatial technology can offer 3D analytical system which could provide spatio-semantic information about buildings and neighbourhood environment (El-Mekawy, Östman, and Hijazi Citation2012).
A framework for 3D city models proposed by Köninger and Bartel (Citation1998) deals with the conceptual aspects and scopes related to data acquisition, modelling, its storage and analysis. A conceptual model of urban environment within city can be represented in hierarchical object structure called Levels of Detail (LoDs). LoD in 3D city modelling refers to multi-resolution representation of urban object space with optimum amount of details required according to user needs and input data used (Biljecki Citation2013). 3D city modelling is the computer abstraction or representation of spatio-semantic aspects of city objects such as building, vegetation, city furniture, etc., into 3D analytical system demonstrating contextual simulation scenarios. 3D city models are stored in corresponding digital file format of modelling software. An overview of various 3D vector data acquisition techniques in context of LoD for building city object has been demonstrated by Wate et al. (Citation2013). The authors have proposed 3D GIS modelling matrix which provides general guidelines for 3D data-set generation in context of distinct City Geography Markup Language (CityGML) LoD.
In present investigation, LoD3 data acquisition technique demonstrated in study is being used for creation of building city object. A typical satellite photogrammetric-based methods for 3D city modelling store geometric data as raster data format i.e. DEM or as vector data format i.e. TIN. A close-range photogrammetry software such as PhotoModeler Scanner provide options to store generated 3D model in drawing format (.dxf), VRML (.wrl), Google Earth (.kml) formats. A hand-crafted 3D content design approach for LoD3 data creation uses Google SketchUp software to store 3D model in native SketchUp (.skp) format. These approaches on 3D vector content creation in native formats limit the applicability of models for 3D spatial analysis to address issues such as urban energy consumption estimation of city for integrated urban energy planning and subsequent decision-making.
In order to integrate an application-specific content with 3D data, it is essential to have generated 3D model in interoperable format. An open data format allows for the modification in conceptual schema according to application-specific requirements. CityGML is a XML-based open and interoperable data format for storage and exchange of virtual 3D city models (Kolbe et al. Citation2012). It is an application schema of GML3.1.1 based on the ISO 19107 model for storage of 3D geometry as Boundary Representation (B-Rep) and lossless information exchange between heterogeneous Geographic Information (GI) systems. The class diagram representation of CityGML features facilitates integration of spatio-semantic and appearance properties of 3D city model. The amendments in CityGML data model for integration of application-specific content could be considered as extensions to CityGML and could be implemented as Application Domain Extensions (ADEs). Krüger and Kolbe (Citation2012) have derived key indicators for building heating energy analysis from Berlin 3D city models and integrated them with CityGML building model for realization of CityGML Energy ADE. In current energy consumption scenario, the urban spaces are potential consumers of large part of non-renewable sources of energy for their day-to-day requirements resulting in greenhouse gas production and adversely affecting the climate. Hence, the cities are required to devise parametric techniques to accurately assess the spatially distributed energy demand and supply in view of climate change and environment policies which will result in efficient energy consumption and low carbon footprint. The urban energy modelling studies are facing the problems of data availability of real-time city-wide energy consumption which is useful for simulation of various urban energy scenarios and subsequent decision-making. Hence, these parametric approaches must be able to model, analyse and simulate heterogeneous urban energy scenarios based on urban morphology (2D and 3D) and building energy characteristics at different scales bridging the gap between urban and energy planning. The objectives of proposed investigation are:
To study available native 3D data-set storage formats in terms of their applicability and limitations.
To present CityGML semantic model derivation process from native 3D data-set file format.
To provide mechanism for integration of building solar energy simulation data with semantic model.
To perform semantic analysis for assessment of building solar thermal and photovoltaic (PV) potential.
2. Study area
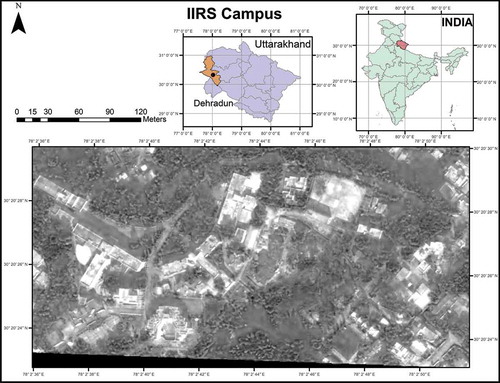
The study was carried out on Geoinformatics department building in Indian Institute of Remote Sensing Campus spread over an area of 84,425.00519 m2 as shown in . The study area is geographically located between 78°02ʹ35.56″ to 78°02ʹ52.224″ East longitudes and 30°20ʹ23.0784″ to 30°20ʹ29.8104″ North latitudes. The average altitudinal height is 653.573 m above ellipsoidal datum (WGS 84) and lies at foot hills of Himalayas.
Figure 1. Location and IKONOS panchromatic imagery of study area – Indian Institute of Remote Sensing (IIRS) Campus.
2.1. Data used
Following data were used:
IKONOS imagery of IIRS Campus
Field surveyed data
2.2. Software used
The present work used following software:
Google SketchUp (version 7)
Feature Manipulation Engine (FME) Desktop 2013
Integrated Environmental Solutions Virtual Environment (IESVE) 2013
3. Related works
3.1. 3D data-set standards
Commercial-Off-The-Shelf (COTS) softwares (e.g. Google SketchUp) in 3D GIS market accounts for the efficient handling of 3D data in 3D visualization aspect and also for very basic analysis to certain extent (Zlatanova, Rahman, and Pilouk Citation2002). The current general purpose GIS vendors does not offer full 3D GIS functionality in terms of 3D structuring (geometry and topology), 3D manipulation and 3D analysis (semantics) instead they only offer tools for 3D navigation, animation, visualization and exploration. Zlatanova, Stoter, and Isikdag (Citation2012) provide overview of various 3D data standards and its excerpt is listed in .
Table 1. 3D data-set standards.
The standards (DXF, VRML, X3D and COLLADA) from Computer Aided Design (CAD) domain in general follow geometry and texture criteria of first category. On other hand, the standards (KML, Geo-VRML, 3D PDF) from Computer Graphics (CG) domain are in accordance with the georeferencing and XML-based Web geovisualization category.
CityGML and IFC 3D standard from BIM accounts for the object identity (semantics), attributes along with its thematic properties. CityGML is a GML3-based object-oriented model for real 3D objects representation in terms of their semantic, geometry, topology and appearance characteristics (Kolbe et al. Citation2012).
3.2. Urban energy conservation case studies
Ratti, Baker, and Steemers (Citation2005) have examined the correlation between building energy consumption and architectural parameters using Lighting and Thermal (LT) model (Baker, Hoch, and Steemers Citation2000). Carrión, Lorenz, and Kolbe (Citation2010) proposed method using degree day model for heating energy estimation based on geometric, semantic and energy characteristics of building derived from 3D city model represented in CityGML.
3.2.1. Case study of energy Atlas of Berlin – CityGML energy ADE test bed
Urban energy consumption in terms of power/electricity, water, gas and heating is directly correlated with building information such as envelope volume, assignable area, its type and number of inhabitants (Krüger and Kolbe Citation2012). The test bed provides estimation of heating energy consumption based on building information parameters, indexes, elementary and complex indicators. Indicator values are derived from the semantic, geometric and topological properties of CityGML compliant 3D city model of Berlin.
3.2.2. Interoperable Smart City services through an Open Platform for urban ecosystems (I-SCOPE) project – solar ADE test bed
I-SCOPE project is based on use of CityGML as Urban Information Model to provide smart services for accurate assessment of solar energy potential at building level (Amicis et al. Citation2012). The estimation of solar energy potential of roof is based on parameters such as effective roof area from city model, total solar irradiation data-set stored in CityGML textures, panel efficiency and roof orientation (Prandi et al. Citation2013). The single irradiation value is assigned to roof area by overlaying corresponding areas of irradiation maps to the roof areas (‘Solar Potential Assessment – SmartCity Wiki’ Citation2013). The study provides conceptual schema for RoofSurface Solar energy potential assessment as Solar ADE.
4. Rationale for 3D GIS modelling at semantic level using CityGML
In last decade, it was reportedly noted in the literature that there had been no commonly agreed standard available to represent and exchange 3D city models in an interoperable way. Hence, the need for more general interoperable modelling approach for 3D city objects in terms of topological and semantic aspects to account for the information requirements of various vibrant user application fields was identified (Stoter and Zlatanova Citation2002). Usually, 3D city models were represented and exchanged in non-GIS CG standards (3D Studio Max or VRML) lacking interoperability as it was necessary for many user-specific applications of 3D city models (Gröger and Plümer Citation2012).
But, from last couple of years onwards, CityGML has emerged as a common geometric and semantic information model to abstract the virtual 3D city objects and to facilitate lossless data exchange in interoperable way. The only geometry representation of 3D objects may results in more complex and redundant 3D content. This restricts utility of geometrical models for broader use of 3D city models (Kolbe et al. Citation2012). CityGML is widely accepted OGC standard for 3D city models by geospatial industry to facilitate spatio-semantic analysis (Gröger and Plümer Citation2012).
Henceforth, the modelling and encoding of 3D space in CityGML standard at semantic level including above-ground and underground, indoor and outdoor built environment is needed to provide an optimum total solution for integrated urban planning and decision-making.
4.1. CityGML (version 2.0.0)
Semantic information about 3D city object (e.g. building) is human conceptualization of different geometries (e.g. Wall surface, Roof surface, Door, Window) associated with it. Semantic information helps to reduce ambiguities for geometric integration, if it is coherently structured with respect to geometry (Stadler and Kolbe Citation2007). ‘CityGML is a common semantic information model based on ISO 191xx family standards for the representation of 3D urban objects that can be shared over different applications’ (Kolbe et al. Citation2012). CityGML is an open data model and XML-based format for representation of 3D geometries of most relevant city objects such as buildings, city furniture, land use and vegetation (Krüger and Kolbe Citation2012). The applicability of model for different applications facilitates the cost-effective sustainable maintenance of various 3D city models.
The class diagram representation of relevant topographic objects in cities abstracts their appearance, geometrical, topological and semantic properties along with application-specific data (e.g. values concerning urban energy consumption and production) to develop specific ADE for strategic urban energy planning. CityGML standard compliant 3D city model facilitates large and small scale representation of urban 3D objects in different LODs simultaneously. The peculiarity of CityGML is interoperability, in general and lossless information exchange between heterogeneous GI systems and users, in particular (Kolbe et al. Citation2012).
The 3D urban segment can be decomposed into several natural and man-made entities. City is a man-made entity which abstracts major components such as buildings, commutation networks, city furniture, etc., in a structured manner in terms of their semantics and well-defined spatial and thematic properties. Building component is the most important man-made object in a city. Building module in CityGML contributes to a significant quantum of semantics of City module. It also accounts for multi-resolution representation of buildings and their installation parts. A particular module in CityGML is specified by Unified Modeling Language (UML) instance diagrams.
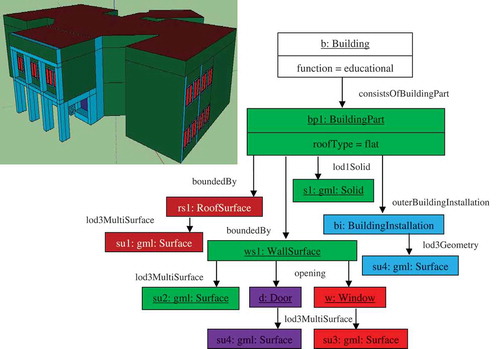
illustrates CityGML feature structure as UML instance diagram of basic LoD3 building model. The geometry of building semantics is given by externally referenced GML3.1.1 application schema. In order to support data integration and spatio-semantic queries, it is essential to have structurally consistent models in terms of their geometry and semantics properties (Stadler and Kolbe Citation2007).
Figure 2. Illustration of CityGML LoD3 building feature structure as UML instance diagram.
4.2. CityGML LoD3 building model
CityGML building model is defined by the building thematic extension module. It allows multi-resolution representation of thematic and spatial properties of buildings and building parts in discrete LoD. shows UML instance diagram of building model and corresponding classification of BoundarySurfaces. The _AbstractBuilding is parent class of building model which is sub-class of thematic class _Site and which is sub-class of root class _CityObject. Building and BuildingPart are the specialized classes of _AbstractBuilding class. GML3 feature properties and CityGML-specific properties from _CityObject class are inherited by _AbstractBuilding class. The building class, building function (e.g. residential, commercial, etc.), building usage, year of construction and demolition, roof type, building and storey height attributes of _AbstractBuilding class are inherited by Building and BuildingPart.
The outer shell of building in LoD3 is semantically distinguished with bounding _BoundarySurface and BuildingInstallation thematic classes. A _BoundarySurface is further decomposed mainly into thematic features like wall (WallSurface), roof (RoofSurface) and ground plate (GroundSurface). The BuildingInstallation class accounts for building elements such as balconies, chimneys, dormers, etc., related mostly to outer appearance of buildings. The openings in _BoundarySurface objects are represented by doors and windows thematic objects.
5. Interoperability gap between CityGML and energy models
With the advent of energy rating systems (e.g. LEED – Leadership in Energy and Environment Design) and energy efficiency requirements of built environment, the assessment of energy performance of new buildings and refurbishment rates of existing buildings has become important compliance in building design process. In order to implement the energy efficient measures for building, it is essential that there exists geometric information interoperability between BIM softwares and energy modelling softwares. The interoperability between design and energy models allows lossless translation and eliminates again re-designing of same geometric content in energy modelling software. Interoperability facilitates the different domain teams (design, engineering and energy modelling) to interact with single building model and to make necessary changes in design depending upon the analysis of ‘what-if’ scenarios. The current commercial softwares (Autodesk, Bentley, IESVE, etc.) from CAD domain use Green Building XML schema (referred to as ‘gbXML’) architecture for bidirectional information exchange between their modelling and energy analysis software environments. The major drawbacks of CAD domain softwares are: they lack object definition i.e. semantic information, multi-scale representation and geospatial reference. Moreover, their energy analysis software modules only offer visualization of energy simulation and lack access to energy data.
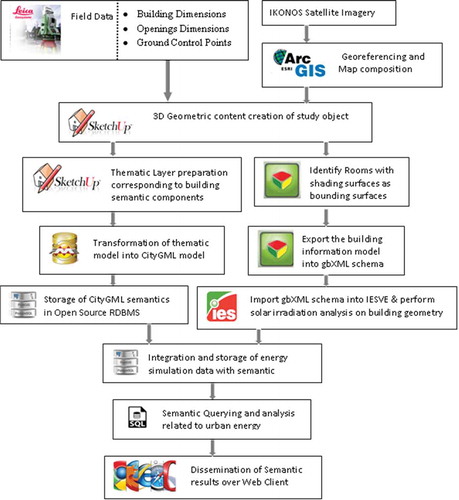
On other hand, CityGML is an XML-based standard for 3D geodata which offers spatio-semantic multi-resolution modelling with geospatial reference and also provides ADE mechanism for extension of semantics to integrate energy data with CityGML. This capability of CityGML over gbXML (schema used only for representation in energy analysis softwares) can be utilized to develop software interface architecture in order to facilitate exchange and integration of information between different domains including commercial as well as open-source softwares (OSEMOSYS, etc.). The integration of information from CityGML (3D urban data) and energy analysis (urban energy data) domains is essential not only for energy performance assessment of buildings but also to implement energy rating systems and energy efficiency standards for built environment. The present investigation in urban energy modelling attempted to integrate the energy simulation data with semantic features of CityGML (derived from BIM model, where derivation mechanism is demonstrated in Section 5.1)-based building model. The unidirectional process workflow was implemented using gbXML to export the building information into energy modelling software. represents workflow adopted in present experimental study for integration of energy information with CityGML. The solution to interoperability gap between design and energy analysis domain could be to formulate conceptual schema based on CityGML ADE mechanism. The derived XML instance of ADE schema along with the software interface architecture could be used to bridge the gap between CityGML and Energy models.
Figure 3. Process workflow between CityGML and energy models.
5.1. Materials and methods
In order to generate 3D model, the IKONOS imagery of IIRS campus was rectified and georeferenced with reference to Ground control points (GCPs) obtained from field survey. Map composition of IIRS campus area was carried and building footprints were obtained. Geoinformatics department building in IIRS campus was taken as use case for present investigation. Following flow chart shows methodology employed in current research work ().
Figure 4. Methodology.
5.1.1. Building and opening dimensions measurement from field data
Field survey was carried out using total station Leica TPS1200 instrument to measure the building dimensions such as building height, floor height, window width, window height, door width and door height which was useful for facade modelling and detailing of building geometry from architecture point of view.
5.1.2. LoD2 and LoD3 building model generation
The LoD2 and LoD3 models of Geoinformatics department building were generated using Google SketchUp. Extensive field data (building and openings dimensions) were being used for reconstruction of actual architectural details as shown in .
Figure 5. (a) LoD2 building model (b) LoD3 building model with semantics and geometry.
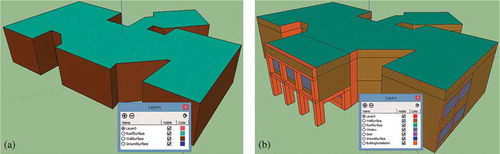
5.1.3. Semantic categorization
Google SketchUp facilitates thematic layering of model into different semantic components of building. The LoD2 model was thematically layered into bounding features such as WallSurface, RoofSurface and GroundSurface while LoD3 model was layered into WallSurface, RoofSurface, GroundSurface, Door and Window ().
5.1.4. Transformation of Google SketchUp model to CityGML
Thematic model prepared in Google SketchUp was transformed into CityGML using FME by Safe Software. FME Desktop 2013 supports over 300 formats and 400 transformers to allow interoperability between different data formats including point cloud, 3D, raster, database, vector and XML formats. FME Desktop 2013 is useful for data conversion, transformation, integration and validation. It also supports database solutions including PostGIS, Oracle and Microsoft SQL Server.
A Google SketchUp to CityGML converter with SketchUp Reader and CityGML writer was developed using sequence of built-in FME transformers for LoD2 and LoD3 model. As we dealt with LoD3 model, the feature classes for Building, RoofSurface, WallSurface, Window and Door has been created with building as parent feature class. The FME workspace which contains readers, writers and transformers of converter is shown in .
Figure 6. SketchUp to CityGML LoD3 customized converter using FME.
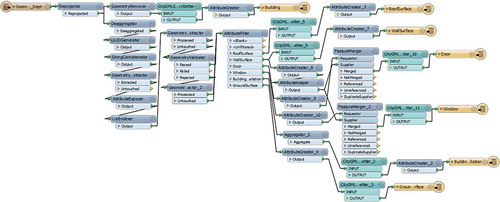
GeometryPropertyExtractor transformer in customized converter extracts the geometry trait or name from different SketchUp layers by trait ‘sketchup_layer_name’ – Building, RoofSurface, WallSurface, Window and Door. The CityGMLGeometrySetter transformer was used to assign CityGML LoD name and Feature Role to CityGML Feature corresponding to extracted geometry trait. GeometryValidator transformer repairs geometry defects in processed input features. AttributeCreator creates new CityGML features and assigns unique ids to generated features. The CityGML feature writers in FME imports the XSD schema of core and base profiles to write CityGML instance document. The citygml_parent_id for the RoofSurface and WallSurface was set to Building ID. While for Building, the citygml_parent_id was set to CityModel ID. Thus, the corresponding CityGML LoD3 model was obtained from SketchUp model.
5.1.5. Storage of semantic components in open-source RDBMS
The LoD3 CityGML model generated was imported in open-source PostGIS database for semantic querying. There were six relations (Building, CityModel, RoofSurface, WallSurface, Door, Window) imported into PostGIS database using FME CityGML reader and PostGIS writer with linkage to each other by attribute ‘citygml_parent_id’.
5.1.6. Model preparation for export to energy modelling program
The building information designed in Google SketchUp is transformed into space model by selecting shading surfaces as bounding surfaces and creating the Room space using gModeller-Energy Analysis Plug-in for Google SketchUp. The space model is then exported to IESVE energy modelling program in gbXML schema to allow interoperable use of BIM into energy analysis software program.
5.1.7. Integration of energy simulation data, semantic analysis and dissemination
For energy conservation strategy in urban segment, building object was considered as hemispherical dome and sun elevation above horizon was categorized as 30°, 60°, 90°, 120° and 150°. The solar energy potential of WallSurface of LoD2 building model was assessed by quantizing amount of solar intensity irradiated on walls of building using SunCast application in Virtual Environment Software. Attribution of solar intensity data for energy conservation strategy was performed on semantic relations and same was repeated for RoofSurface feature. Semantic query was performed to find out WallSurfaces having good solar irradiation for given season of year. Similarly, query can be performed to find out sun illuminated windows of building. The query results obtained was converted into Web compliant data standard using FME for display purposes.
6. Results
The LoD3 CityGML XML schema obtained from converter uses externally referenced GML3.1.1 schema for storage of geometry of semantic components. It derives required XML elements of building module from the XSD document of externally referenced base profile module. It derives gml: envelope element from CityGML core module to define the spatial bounding box of building model. The cityObjectMember element of core module contains all elements required for definition of building semantic components.
A building object is bounded by WallSurface with openings which are stored as exterior and interior LinearRing geometry type. It stores the coordinates of points forming the LinearRing geometry in gml: posList element.
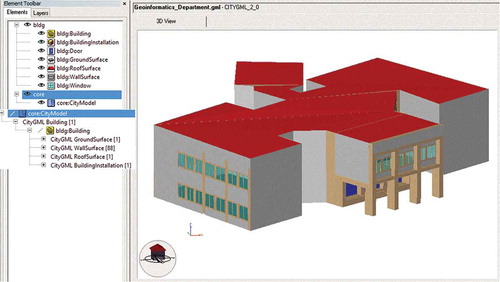
The building installation semantic component is stored in bldg: BuildingInstallation element as lod3Geometry with gml: MultiSurface, gml: surfaceMember, gml: Polygon, gml: LinearRing as child elements and bldg: outerBuildingInstallation as parent element. On similar lines building surface bounding components such as WallSurface, RoofSurface and GroundSurface are stored as lod3MultiSurface geometries. The opening semantic components (Door and Window) of building are also stored as lod3MultiSurface geometries with hierarchy of gml: MultiSurface, gml: surfaceMember, gml: Polygon, gml: LinearRing and gml: posList as child elements inside bldg: opening parent element. shows the LoD3 CityGML building model with semantic layers rendered in FZK viewer. shows the summary of semantic features of Geoinformatics department building written by the FME CityGML writer of developed customized converter. The unique identity of semantic components of LoD2 model stored as distinct relation in PostGIS database. These semantic relations are attributed with application-specific data of percentage of sun exposed walls in winter and summer obtained from SunCast application simulation. The application provides effective percentage of wall surface areas exposed to insolation during every hour throughout the year. shows actual wall areas exposed to insolation.
Table 2. Semantic features summary.
Table 3. Percentage of WallSurface areas exposed to insolation.
Figure 7. Developed LoD3 CityGML of Geoinformatics department building rendered using FZK viewer.
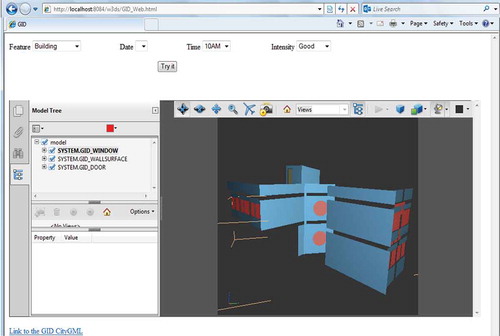
shows semantic analysis results in Web environment for LoD3 model in 3D PDF format. It provides information about insolation on semantic components for given time of day. The Web interface allows choosing of good, medium and poor intensity facades at every hour of day. The Web interface facilitates end user to analyse the particular openings of buildings receiving enough illumination during daytime.
Figure 8. Semantic query results dissemination through Web Client.
7. Discussions
7.1. Solar mapping on LoD2 model
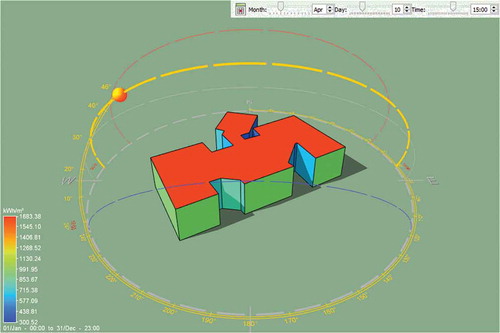
The SunCast application in IES Virtual Environment software calculates percentage of sun exposed areas in year and also insolation on wall surfaces using Sun–Earth geometry defined by date, time, orientation, site longitude and latitude. It allows generating of temporal images which can be used for solar surface shading and insolation analyses. The Global Horizontal Irradiance (GHI) values are computed for full year using object location information and weather data files of point nearest to it. The simulated full year insolation values on walls and roof can be used to quantify the solar thermal and photovoltaic potential of building object (). The application provides simulation for every month which is useful to evaluate building semantic features which are exposed to sun for longer duration during summer and winter. The temporal simulation plays important role in calculation of actual solar panel size and their placement on walls and roof. The SunCast application could be used to analyse the effects of building obstructions on surrounding buildings and also visualize different building orientations at designing stage.
Figure 9. Solar Mapping on Lod2 model.
7.2. Solar luminance and illuminance mapping on LoD3 model
The RadianceIES application in IES Virtual Environment software visualizes the distribution of amount of light available in given 3D environment. It is useful to compute the solar illuminance on semantic feature surfaces (windows), luminance due to facades, daylight factors and glare analysis. RadianceIES works on ‘ray-tracing’ algorithm which traces ray of light from eye position into the source and generates luminance and illuminance images based on loaded sky conditions ( and ).
Figure 10. Luminance mapping and glare analysis on LoD3 model.
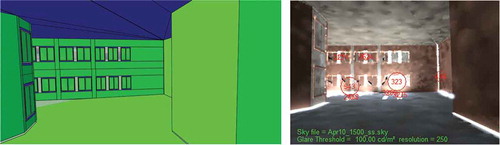
Figure 11. Illuminance mapping on LoD3 model.
7.3. Semantic analysis on LoD2 and LoD3 models
The presented simulation could be useful to address certain queries related to semantic features of building object. These queries could be analysed and answered in below-mentioned manner:
Query1: What is the effective surface area of WallSurface features which is useful for PV installation?
The simulation for full year is carried out for sun exposure and shading on walls and roof of LoD2 model using SunCast application. The exposure areas are obtained on hourly basis and then summed up to compute effective percentage exposure areas of total available surface areas. The effective exposure areas are aggregated for winter and summer months. For walls with windows, the actual available surface area is computed by subtracting total window areas from wall area and then effective area is computed as percentage of actual available surface area. That is the area available for PV installation and its potential can be evaluated by integrating the insolation data (KWh/m2) from energy simulation. Then, the criteria can be set accordingly to find out maximum energy yield areas of roof and walls. shows walls with areas greater than 10 m2.
Figure 12. Walls with effective surface areas greater than 10 m2.
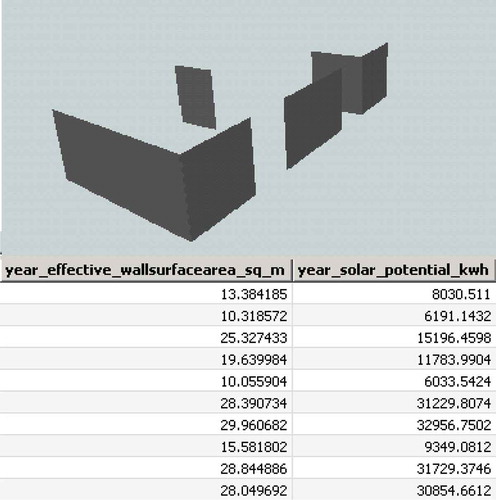
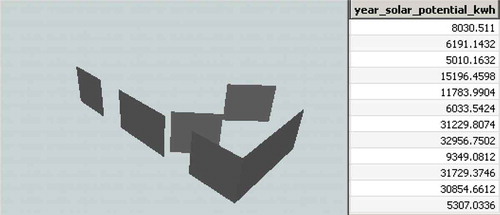
Query2: Which are those WallSurfaces having potential of more than 5 MW of power?
shows wall surfaces which are having potential of generating more than 5 MW of power throughout the year.
Figure 13. Walls with potential for more than 5 MW of power throughout the year.
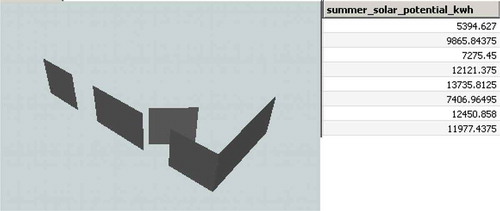
Query3: Which are those walls suitable for PV installation during summer and winter seasons?
shows wall surfaces which are having potential of generating more than 5 MW of power during winter season. shows wall surfaces which are having potential of generating more than 5 MW of power during summer season.
Figure 14. Walls with potential for more than 5 MW of power during winter season.
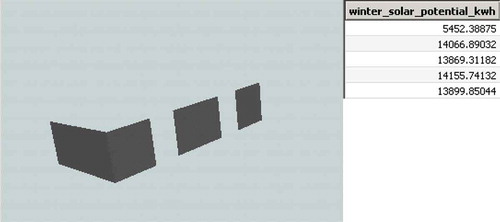
Figure 15. Walls with potential for more than 5 MW of power during summer season.
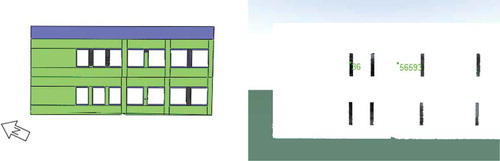
Query4: Which windows of building receiving sufficient amount of Illumination during daytime?
The amount of illumination received on windows could be considered as saving in power for lighting during day. It is illuminance in lux i.e. lumen per sq m (). The lighting power allowance of specific space use can be obtained from lighting specific data sheet. The day light potential of windows can be obtained by multiplying it with respective window areas. Then, by using light efficiency (lumens per watt) factor of lighting system installed in building, the saving in power during daytime can be assessed. The overall assessment of walls, roof and windows in terms of solar irradiation and illuminance potential could be considered as contribution towards production of solar thermal and electrical energy based on spatio-semantic and energy characteristics of building. The query results have shown that there is seasonally variation in insolation on walls of building. It is observed that there are more walls exposed to insolation in summer than in winter and also there is variation in effective area of particular wall exposed to insolation in two seasons i.e. in summer it is exposed more than in winter. Hence, the building semantic analysis has helped in qualitative and quantitative assessment of insolation exposed building walls and their potential for thermal and PV power generation.
Table 4. Solar illuminance through windows.
The investigated methodology uses proprietary softwares (Google SketchUp, FME Desktop 2013) except for model storage in RDBMS and display of semantic query results. The use of commercial softwares can be reduced by investigating r.sun and v.sun modules of open-source GRASS GIS environment for insolation simulation (Hofierka and Zlocha Citation2012). An improved Web 3D GIS framework formulation is essential with sophisticated client–server architecture. Other types of semantic queries can be performed, like to calculate surface area of RoofSurface and particular WallSurface, to count number of doors and windows to a particular building, to find out window receiving maximum illumination throughout the day, to investigate total solar thermal and photovoltaic potential of building object.
8. Conclusions and future scope
The present investigation in 3D city modelling attempts to provide a framework for assessment of solar thermal and PV energy production potential at building level. The study can be extended to evaluate the solar thermal and PV potential at neighbourhood scale and city scale. The presented CityGML profile could be enriched with urban energy simulation data to develop CityGML Energy ADE. The employed methodology explores semantic modelling capability of CityGML data model and proposes technique for transformation of native 3D model into interoperable semantic 3D model. The present study also presents brief review of various data acquisition techniques in context of LoD. The geometry validation of SketchUp model was performed using GeometryValidator FME transformer of presented converter to avoid errors in geometry representation due to null geometries. The investigation also demonstrated the effective use of field surveyed data of building dimension measurements to enable accurate detailing of architectural features in terms of its position as well as geometrical extent with sub-centimetre accuracy in GCP coordinates. The study also attempts at use of Web environment for presentation semantic analysis results.
Integrated Simulation Environment Language (INSEL) offers building energy dynamics simulation models which can be used to simulate more complex solar and building thermal scenarios to provide more accurate energy demand and supply values. The validation of simulation results with field measured data can be done to support robust urban energy planning decisions. The XML schema validation of urban energy information integrated semantic model could be performed for its conformance towards CityGML Energy ADE instance document.
Acknowledgements
The authors would like to thank Mr Anany Dwivedi, third-year B.Tech student of LNMIIT, Jaipur, India, and Mr Manav Sethi, third-year B.Tech student of IIT Kharagpur, India, for their assistance in preparing data-sets. The authors would also like to thank Data Equipment Section of IIRS for providing IKONOS imagery of IIRS campus. The authors are thankful to IES software support team for providing licensing of Virtual Environment software during first training module meeting of CI-NERGY project at Geneva.
References
- Amicis, R., G. Conti, D. Patti, M. Ford, and P. Elisei. 2012. “I-Scope–Interoperable Smart City Services through an Open Platform for Urban Ecosystems.” REAL CORP 2012. http://www.corp.at
- Baker, N., D. Hoch, and K. Steemers. 2000. “Lighting and Thermal Method”. Directorate General XII for Science.
- Biljecki, I. F. 2013. “The Concept of Level of Detail in 3D City Models.” PhD Research Proposal GISt Report No. 62. http://repository.tudelft.nl/assets/uuid:cea5a207-e796-4691-9440-13362cf8654c/291180.pdf
- Carrión, D., A. Lorenz, and T. H. Kolbe. 2010. “Estimation of the Energetic Rehabilitation State of Buildings for the City of Berlin Using a 3D City Model Represented in CityGML.” International Archives of Photogrammetry, Remote Sensing and Spatial Information Sciences 38: 31–35.
- El-Mekawy, M., A. Östman, and I. Hijazi. 2012. “A Unified Building Model for 3D Urban GIS.” ISPRS International Journal of Geo-Information 1 (3): 120–145. doi:10.3390/ijgi1020120.
- Gröger, G., and L. Plümer. 2012. “CityGML – Interoperable Semantic 3D City Models.” ISPRS Journal of Photogrammetry and Remote Sensing 71 (July): 12–33. doi:10.1016/j.isprsjprs.2012.04.004.
- Hofierka, J., and M. Zlocha. 2012. “A New 3-D Solar Radiation Model for 3-D City Models: New 3-D Solar Radiation Model.” Transactions in GIS 16 (5): 681–690. doi:10.1111/j.1467-9671.2012.01337.x.
- Kaden, R., and T. H. Kolbe. 2013. “City-Wide Total Energy Demand Estimation of Buildings Using Semantic 3D City Models and Statistical Data.” ISPRS Annals II-2/W1: 163–171.
- Kolbe, T. H., G. Gröger, C. Nagel, and H. Karl-Heinz. 2012. “OGC City Geography Markup Language (CityGML) En-coding Standard.” Open Geospatial Consortium.
- Köninger, A., and S. Bartel. 1998. “3D-GIS for Urban Purposes.” GeoInformatica 2 (1): 79–103. doi:10.1023/A:1009797106866.
- Krüger, A., and T. H. Kolbe. 2012. “Building Analysis for Urban Energy Planning Using Key Indicators on Virtual 3D City Models – The Energy Atlas of Berlin.” In International Archives of the Photogrammetry, Remote Sensing and Spatial Information Sciences, edited by M. Shortis, Vol. XXXIX-B2, 145–150. Melbourne: International Society for Photogrammetry and Remote Sensing (ISPRS).
- Prandi, F., R. De Amicis, S. Piffer, M. Soavea, S. Cadzowb, E. Gonzalez Boix, and E. D’Hondt. 2013. “Using CityGML to Deploy Smart-City Services for Urban Eco-Systems.” ftp://prog.vub.ac.be/tech_report/2013/vub-soft-tr-13-10.pdf
- Ratti, C., N. Baker, and K. Steemers. 2005. “Energy Consumption and Urban Texture.” Energy and Buildings 37 (7): 762–776. doi:10.1016/j.enbuild.2004.10.010.
- Solar Potential Assessment – SmartCity Wiki. 2013. http://smartcity.gistandards.eu/index.php/Solar_potential_assessment
- Stadler, A., and T. H. Kolbe. 2007. “Spatio-semantic Coherence in the Integration of 3D City Models.” In Proceedings of the 5th International Symposium on Spatial Data Quality, Enschede. http://www.citygml.org/fileadmin/citygml/docs/SDQ2007_Stadler_Kolbe.pdf
- Stoter, J., and S. Zlatanova. 2002. “3D GIS, Where Are We Standing?” In Advances in Spatial Data Handling, edited by D. E. Richardson and P. van Oosterom, 6p. Ottawa, ON: Springer.
- Wate, P., S. Saran, S. K. Srivastav, and Y. V. N. Krishna Murthy. 2013. Formulation of Hierarchical Framework for 3D-GIS Data Acquisition Techniques in Context of Level-of-Detail (LoD).pdf, 154–159. Shimla: IEEE. doi:10.1109/ICIIP.2013.6707573.
- Zhang, X., Q. Zhu, and J. Wang. 2004. “3D City Models Based Spatial Analysis to Urban Design.” Annals of GIS 10 (1): 82–86. doi:10.1080/10824000409480658.
- Zlatanova, S., A. Rahman, and M. Pilouk. 2002. “3D GIS: Current Status and Perspectives.” International Archives of Photogrammetry Remote Sensing and Spatial Information Sciences 34 (4): 66–71.
- Zlatanova, S., J. Stoter, and U. Isikdag. 2012. “Standards for Exchange and Storage of 3D Information: Challenges and Opportunities for Emergency Response.” In Proceedings of the Fourth International Conference on Cartography and GIS, Albena, 17–28. International Cartographic Association. http://www.academia.edu/download/30614783/Standards_Exchange_Storage_3D_Information.pdf