
Abstract
This short paper discusses a research framework for healthcare accessibility using cancer care as an example. The United States’ National Cancer Institute-designated Cancer Centers (US-NCI-CCs) form the ‘backbone’ of the cancer care system in the United States, and their attendance is associated with better outcomes. Three interconnected themes are proposed for the study of US-NCI-CC accessibility: (1) measuring disparities in access to the US-NCI-CCs, (2) examining the pathway from accessibility to utilization of cancer care services and then to cancer outcomes (e.g. cancer-specific mortality), and (3) designing policy scenarios for minimal disparities in accessibility.
1. Introduction
Cancer is the leading cause of death for those under age 85 in the United States (Twombly Citation2005). The lifetime risk of cancer in the United States is 45% for men and 38% for women (Howlader et al. Citation2012). Access to cancer care – defined here as the ability to reach and potentially use cancer care – can be particularly important to patients’ utilization of the services and their outcomes. Several studies have demonstrated better outcomes associated with access and utilization of more specialized cancer care facilities (Hillner, Smith, and Desch Citation2000), particularly NCI-designated Cancer Centers (US-NCI-CC) in the United States (Birkmeyer et al. Citation2005; Onega et al. Citation2009, Citation2010). Research suggests that longer travel time to these services increases risk of advanced cancer (e.g. Gumpertz et al. Citation2006), reduces utilization of certain therapy (e.g. Celaya et al. Citation2006), limits enrolment in clinical trials (e.g. Avis et al. Citation2006), and thus increases patients’ mortality rates (Onega et al. Citation2009). Uneven distributions of cancer care facilities and population lead to geographic disparity in accessibility, exemplified by presence of ample service in some areas and absence or paucity of service in others (Shi et al. Citation2012). Furthermore, disproportionately higher numbers of racial and ethnic minorities often suffer from poor access to health care including cancer care (National Cancer Institute Citation2008; Onega et al. Citation2008), commonly referred to as racial disparity. Inequality in health care access comes at a personal and societal price, evidenced in major disparities in health outcomes in the United States (Sridhar Citation2005). With the adoption of the Affordable Care Act (ACA) in the United States (http://www.hhs.gov/healthcare/rights/), barriers such as insurance coverage and costs are expected to be reduced, leaving geographic access to high-quality cancer care as a relatively more dominant barrier. The American Society of Clinical Oncology notes that with the ACA, any meaningful improvement in quality and access to cancer care must take into account the setting and location of care (Moy et al. Citation2011).
This short paper proposes a research framework on studying cancer care accessibility with an emphasis on related methodological issues. Among others (e.g. the Community Clinical Oncology Programs or CCOPs, and other academic medical centers in the Council of Teaching Hospitals and Health Systems or COTH), the US-NCI-CCs represent among the highest quality of specialized cancer care in the United States, and are used as an example here to illustrate the issues and related methods. While we focus on cancer care facilities, the proposed research framework may also be applicable to other healthcare systems facing similar issues.
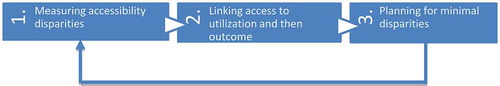
As outlined in , assessing the disparities in cancer care begins with the task of accurate measures of accessibility related to both spatial and non-spatial factors. Spatial (geographic) accessibility also interacts with non-spatial (socio-demographic) factors as disadvantaged population groups (e.g. low-income and minority residents) often suffer from poor access to certain activities or opportunities because of their lack of economic or transportation means. Disparities in accessibility lead to disparities in cancer outcome (e.g. cancer-specific mortality rate) across geographic areas as well as demographic groups. Therefore, the second task is to examine and validate the pathway from cancer care accessibility, to utilization and then to outcomes. The objective of some model-based inferential studies will eventually enable us to estimate the societal cost of access disparities in cancer mortalities. With the extent of disparities identified and the cost in cancer mortalities established, the third question is whether and how we can reduce the disparities through planning and policy interventions. This task can be formulated as an optimization problem of minimizing inequality of accessibility across geographic areas and demographic groups by adjusting the locations and capacities of cancer care facilities. Possible policy initiatives include creation of US-NCI-CC satellite facilities through new partnerships, developing telemedicine consultations/referrals in shortage areas, and adding equity in the designation process of new US-NCI-CCs. The solution to the optimization problem is newly adjusted cancer care facilities, which can be fed back to Task 1 to update the accessibility measures; and Task 2 then uses the revised accessibility scores to estimate corresponding outcomes (e.g. reduced cancer mortalities). The following three sections discuss each task in more detail.
Figure 1. Three themes (tasks) in analysis of accessibility of cancer care.
2. GIS-based measures of cancer care accessibility
Accessibility refers to the relative ease by which health care (in our case, cancer care) can be reached from a given location, and is affected by both spatial and non-spatial factors (Khan Citation1992). Spatial access emphasizes the importance of spatial separation between supply (cancer care facilities) and demand (patients) as a barrier or a facilitator, whereas non-spatial access includes many demographic and socioeconomic variables (e.g. age, sex, race and ethnicity, socioeconomic status, linguistic barrier, education, vehicle ownership, etc.).
Measuring spatial accessibility is a classic issue for location analysis well suited for GIS to address. Among applications in assessing spatial accessibility of cancer care, the methods range from the basic approach emphasizing the proximity to service locations to more advanced models designed to account for complex interaction between supply and demand of cancer care. For example, Onega et al. (Citation2008) used minimum travel time to the closest cancer care facility to measure accessibility of cancer care service. When the capacity of service providers is less a concern, such an approach is acceptable. In most cases, accessibility measures need to account for both supply and demand because of scarcity of supply. The past decade has seen major advances in GIS-based models of spatial accessibility along this line of work. The most popular methods are the ‘two-step floating catchment area (2SFCA) method’ (Luo and Wang Citation2003) and its various refinements, which have recently been synthesized into a generic model, termed ‘generalized 2SFCA or G2SFCA’ (Wang Citation2012).
The G2SFCA is written as
Figure 2. Conceptualizing distance decay f(d).
One major debate in spatial accessibility measures is what distance decay function is most suitable. In other words, how do we define function f(d) in Equation (1)? One has to analyse the actual travel patterns of patients in visiting the cancer care facilities in order to define the best-fitting function (Delamater et al. Citation2013). The analysis begins with deriving a data set of patient–hospital visitation trips with variables such as number of hospital visits (V), corresponding travel time (d) between patient residence (origin) and hospital (destination) locations. Take the popular gravity-based function, V = V0d–β, for example. Its logarithmic transformation can be fitted by a simple bivariate regression, where R2 indicates the goodness of fit and the estimate for parameter β defines the distance friction coefficient (Jin, Wang, and Liu Citation2004). In the case of a discrete model is preferred, the travel time beyond which the number of hospital visits drops to minimal suggests a reasonable catchment area size in a particular geographic setting.
Some of the major challenges for measuring spatial accessibility of cancer care include: (1) a comprehensive count of cancer care facilities that vary a great deal in service capacity, scope and quality, (2) an accurate estimate of cancer patients at finer geographic resolutions, and (3) a suitable distance decay function that reflects actual patients’ hospital visit behaviour.
3. Examining association of accessibility, utilization and cancer outcomes
The second theme is to build upon the access characterization in the above section and test whether socio-demographic variation in access is related to utilization of cancer care services and cancer-specific mortality. As an example, breast cancer is chosen here to illustrate this theme due to its high incidence and mortality, as well as clear treatment recommendations. Questions related to this theme include the following:
Does spatial access to cancer care impact utilization of these services and mortality, and does race/ethnicity/socioeconomic status modify those relationships?
What is the population effect of access on use of cancer care facilities and on mortality, overall and by population subgroups, such as racial?
Following the Behavioral Model of Health Service Use (Andersen and Newman Citation1973; Aday and Andersen Citation1974; Andersen and Aday Citation1978), three multilevel models (MLM) can be conceptualized, as shown in , to explain different multinomial dependent variables: (1) utilization of cancer care facilities, (2) utilization of specialized treatment (e.g. tumour marker testing), and (3) cancer mortality. In addition to a similar set of independent variables including neighbourhood level (e.g. accessibility, socioeconomic structure, rurality) and individual ones (e.g. race and ethnicity, age, stage, histology, comorbidities) used in all three models, facility type attended (dependent variable in model 1) is an added independent variable in model 2, and both facility type attended and use of tumour marker testing (dependent variables in models 1 and 2) are added independent variables in model 3. The results from these models help us calculate the attributable risk (AR) and population attributable risk (PAR) for (1) use of cancer care facility type and (2) for mortality, as a function of accessibility. The AR is the increased risk of death in persons with an attribute compared to otherwise similar persons without the attribute, and the PAR represents the proportion of the deaths (in a specified time) in the whole population that may be preventable if a cause of mortality were totally eliminated (Deubner et al. Citation1975; Narayan et al. Citation1999).
Figure 3. Conceptual model of socio-demographic effects on access, utilization and outcomes of breast cancer care.
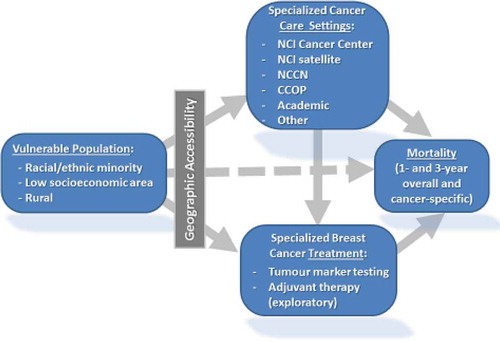
In short, the analysis in this theme will reveal the pathway from cancer care access to utilization of the facilities and related treatment, and then to outcomes such as mortality. This analysis will enable us to substantiate the effect of healthcare access inequality on outcomes and estimate the societal cost of disparities in cancer mortality.
4. Planning towards minimal disparities in access to cancer care
With the extent of access disparities and outcomes identified from the previous two tasks, the final theme is to explore policy strategies for mitigating disparities in access to these facilities and to estimate the impact in reduced cancer mortality. We formulate the issue as an optimization problem of minimizing inequality of access across geographic areas and racial subgroups. This proposition constitutes two new objectives, unlike most of existing work on planning for healthcare facilities that follows the framework of classic location–allocation problems (Church Citation1999) with objectives such as minimal travel (Wang Citation2015, 251–253), limiting resource allocation (Shavandi and Mahlooji Citation2008), maximal coverage (Pacheco and Casado Citation2005), maximal health (Hemenway Citation1982), or a combination of them or multi-objective (Gu, Wang, and McGregor Citation2010).
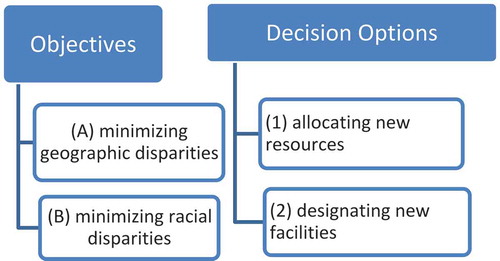
As illustrated in , one may examine two distinct objectives with two policy options. Specifically, objective (A) is to minimize inequality in accessibility scores across geographic areas, and (B) is to minimize inequality in accessibility across racial–ethnic groups (e.g. white vs. a minority). At least two decisions can be explored: (1) allocating new resources to existing facilities to expand their service capacities, and (2) designating/building new facilities. The objectives can be combined by assigning different weights to the objectives to form a multi-objective optimization (Gu, Wang, and McGregor Citation2010). Similarly, the policy options can be examined independently or with a combination. The intersection of objectives and decisions leads to various planning scenarios. The following discusses some technical details in formulating the problems.
Figure 4. Planning goals and policy options.
[Formulating objective A] Denoting the total supply as S (=S1 +S2 + … + Sn) and total demand as D (=D1 + D2 +…+ Dm), we have the weighted average accessibility (Shen Citation1998). The objective A of minimal geographic disparity (‘GeoDisp’) is formulated as minimizing the variance (i.e. least squares) of accessibility index Ai across all areas, i.e.,
[Formulating objective B] For illustration, consider two racial groups (say, white and non-white minorities) with corresponding numbers of patients in each area, denoted as Wi and Mi (i.e. Wi + Mi = Di), and their total populations in the study area as W and M, respectively. The spatial accessibility defined in Equation (1) is based on location and thus identical for the two groups in the same location. However, disparity arises due to disproportional concentration of minorities in geographic areas of poor accessibility (Dai and Wang Citation2011). The objective B of minimal racial disparity (‘RacDisp’) is to minimize the gap between the weighted average of accessibility for white and that for a minority group in the entire study area, such as
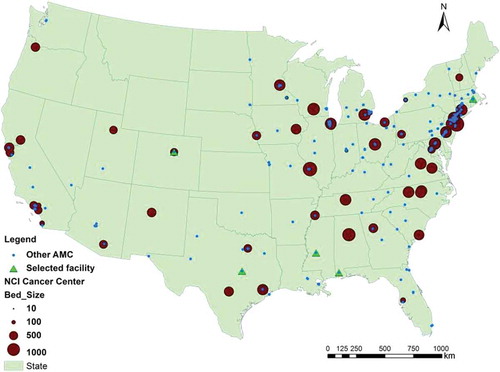
Figure 5. Designating new NCI Cancer Centers for maximal equality.
Based on the optimization results, the impact of each mitigation scenario can be quantified by estimating improved access and reduced mortality with comparison to the existing state by feeding the results back to Tasks 1 and 2 as shown in . The analysis will help policy makers in planning the cancer care resources that directly account for equity and developing direct measures of benefits of a policy proposition in reduced disparities and saved lives. Future refinements on optimization approaches may target minimizing disparities in cancer outcomes by including measures of high-risk populations, for instance areas of high cancer incidence.
In summary, this short paper proposes a research framework on studies of healthcare accessibility for improving health outcomes for populations. There are three interconnected themes that begin by measuring disparities in accessibility of the service, move on to establish the associations between accessibility, utilization and health outcome, and finally explore policy scenarios of reducing the disparities. GIS technologies are used in each task. While cancer care is used as an example for illustrating related methodological issues, the framework is applicable to other healthcare studies.
References
- Aday, L. A., and R. M. Andersen. 1974. “A Framework for the Study of Access to Medical Care.” Health Services Research 9: 208–220.
- Andersen, R., and J. F. Newman. 1973. “Societal and Individual Determinants of Medical Care Utilization in the United States.” Milbank Mem Fund Q Health Soc 51: 95–124.
- Andersen, R. M., and L. A. Aday. 1978. “Access to Medical Care in the U.S.: Realized and Potential.” Medical Care 16: 533–546. doi:10.1097/00005650-197807000-00001.
- Avis, N. E., K. W. Smith, C. L. Link, G. N. Hortobagyi, and E. Rivera. 2006. “Factors Associated with Participation in Breast Cancer Treatment Clinical Trials.” Journal of Clinical Oncology 24: 1860–1867. doi:10.1200/JCO.2005.03.8976.
- Birkmeyer, N. J. O., P. P. Goodney, T. A. Stukel, B. E. Hillner, and J. D. Birkmeyer. 2005. “Do Cancer Centers Designated by the National Cancer Institute Have Better Surgical Outcomes?” Cancer 103: 435–441. doi:10.1002/cncr.20785.
- Celaya, M. O., J. R. Reese, J. J. Gibson, B. L. Riddle, and E. R. Greenberg. 2006. “Travel Distance and Season of Diagnosis Affect Treatment Choices for Women with Early-Stage Breast Cancer in a Predominantly Rural Population (United States).” Cancer Causes and Control 17: 851–856. doi:10.1007/s10552-006-0025-7.
- Church, R. L. 1999. “Location Modelling and GIS.” In: Geographical Information Systems, edited by P. A. Longley, M. F. Goodchild, D. J. Maguire, and D. W. Rhind, 293–303. New York: John Wiley.
- Dai, D., and F. Wang. 2011. “Geographic Disparities in Accessibility to Food Stores in Southwest Mississippi.” Environment and Planning B: Planning and Design 38: 659–677. doi:10.1068/b36149.
- Delamater, P. L., J. P. Messina, S. C. Grady, V. WinklerPrins, and A. M. Shortridge. 2013. “Do More Hospital Beds Lead to Higher Hospitalization Rates? A Spatial Examination of Roemer’s Law.” PLoS ONE 8 (2): e54900.
- Deubner, D. C., H. A. Tyroler, J. C. Cassel, C. G. Hames, and C. Becker. 1975. “Attributable Risk, Population Attributable Risk, and Population Attributable Fraction of Death Associated with Hypertension in a Biracial Population.” Circulation 52: 901–908.
- Gu, W., X. Wang, and S. E. McGregor. 2010. “Optimization of Preventive Health Care Facility Locations.” International Journal of Health Geographics 9: 17. doi:10.1186/1476-072X-9-17.
- Gumpertz, M. L., L. W. Pickle, B. A. Miller, and B. S. Bell. 2006. “Geographic Patterns of Advanced Breast Cancer in Los Angeles: Associations with Biological and Socio-Demographic Factors (United States).” Cancer Causes and Control 17: 325–339. doi:10.1007/s10552-005-0513-1.
- Hemenway, D. 1982. “The Optimal Location of Doctors.” The New England Journal of Medicine 306: 397–401. doi:10.1056/NEJM198202183060704.
- Hillner, B. E., T. J. Smith, and C. E. Desch. 2000. “Hospital and Physician Volume or Specialization and Outcomes in Cancer Treatment: Importance in Quality of Cancer Care.” Journal of Clinical Oncology 19: 1539–1569.
- Howlader, N., A. M. Noone, M. Krapcho, N. Neyman, R. Aminou, S. F. Altekruse, C. L. Kosary, et al., eds. 2012. SEER Cancer Statistics Review, 1975–2009 (Vintage 2009 Populations). Bethesda, MD: National Cancer Institute. http://seer.cancer.gov/csr/1975_2009_pops09/
- Jin, F., F. Wang, and Y. Liu. 2004. “Geographic Patterns of Air Passenger Transport in China 1980–98: Imprints of Economic Growth, Regional Inequality and Network Development.” Professional Geographer 56: 471–487.
- Khan, A. A. 1992. “An Integrated Approach to Measuring Potential Spatial Access to Health Care Services.” Socio-Economic Planning Sciences 26: 275–287. doi:10.1016/0038-0121(92)90004-O.
- Luo, W., and Y. Qi. 2009. “An Enhanced Two-Step Floating Catchment Area (E2SFCA) Method for Measuring Spatial Accessibility to Primary Care Physicians.” Health and Place 15: 1100–1107. doi:10.1016/j.healthplace.2009.06.002.
- Luo, W., and F. Wang. 2003. “Measures of Spatial Accessibility to Health Care in a GIS Environment: Synthesis and a Case Study in the Chicago Region.” Environment and Planning B: Planning and Design 30: 865–884. doi:10.1068/b29120.
- Moy, B., B. N. Polite, M. T. Halpern, S. K. Stranne, E. P. Winer, D. S. Wollins, and L. A. Newman. 2011. “American Society of Clinical Oncology Policy Statement: Opportunities in the Patient Protection and Affordable Care Act to Reduce Cancer Care Disparities.” Journal of Clinical Oncology 29: 3816–3824. doi:10.1200/JCO.2011.35.8903.
- Narayan, K. M., T. J. Thompson, J. P. Boyle, G. L. A. Beckles, M. M. Engelgau, F. Vinicor, and D. F. Williamson. 1999. “The Use of Population Attributable Risk to Estimate the Impact of Prevention and Early Detection of Type 2 Diabetes on Population-Wide Mortality Risk in US Males.” Health Care Management Science 2: 223–227. doi:10.1023/A:1019048114376.
- National Cancer Institute. 2008. Cancer Health Disparities. Accessed February 7, 2015. http://www.cancer.gov/cancertopics/factsheet/disparities/cancer-health-disparities
- Onega, T., E. J. Duell, X. Shi, E. Demidenko, and D. C. Goodman. 2010. “Race Versus Place of Service in Mortality Among Medicare Beneficiaries with Cancer.” Cancer 116: 2698–2706.
- Onega, T., E. J. Duell, X. Shi, E. Demidenko, D. Gottlieb, and D. Goodman. 2009. “The Influence of NCI-Cancer Center Attendance on Mortality in Lung, Breast, Colorectal, and Prostate Cancer Patients.” Medical Care Research and Review 66: 542–560. doi:10.1177/1077558709335536.
- Onega, T., E. J. Duell, X. Shi, D. Wang, E. Demidenko, and D. Goodman. 2008. “Geographic Access to Cancer Care in the U.S.” Cancer 112: 909–918. doi:10.1002/cncr.23229.
- Pacheco, J. A., and S. Casado. 2005. “Solving Two Location Models with Few Facilities by Using a Hybrid Heuristic: A Real Health Resources Case.” Computers & Operations Research 32: 3075–3091. doi:10.1016/j.cor.2004.04.009.
- Shavandi, H., and H. Mahlooji. 2008. “Fuzzy Hierarchical Queuing Models for the Location Set Covering Problem in Congested Systems.” Scientia Iranica 15: 378–388.
- Shen, Q. 1998. “Location Characteristics of Inner-City Neighborhoods and Employment Accessibility of Low-Wage Workers.” Environment and Planning B: Planning and Design 25: 345–365. doi:10.1068/b250345.
- Shi, X., J. Alford-Teaster, T. Onega, and D. Wang. 2012. “Spatial Access and Local Demand for Major Cancer Care Facilities in the United States.” Annals of the Association of American Geographers 102: 1125–1134. doi:10.1080/00045608.2012.657498.
- Sridhar, D. 2005. “Inequality in the United States Health care System.” United Nations Human Development Report Office Occasional Paper. Accessed February 20, 2013. http://hdr.undp.org/en/reports/global/hdr2005/papers/HDR2005_Sridhar_Devi_36.pdf
- Twombly, R. 2005. “Cancer Surpasses Heart Disease as Leading Cause of Death for all but the very Elderly.” Journal of the National Cancer Institute 97: 330–331. doi:10.1093/jnci/97.5.330.
- Wang, F. 2012. “Measurement, Optimization, and Impact of Health Care Accessibility: A Methodological Review.” Annals of the Association of American Geographers 102: 1104–1112. doi:10.1080/00045608.2012.657146.
- Wang, F. 2015. Quantitative Methods and Socio-economic Applications in GIS (2nd ed.). Boca Raton, FL: CRC Press.
- Wang, F., C. Fu, and X. Shi. 2015. “Planning Towards Maximum Equality in Accessibility to NCI Cancer Centers in the U.S.” In Spatial Analysis in Health Geography, edited by P. Kanaroglou, E. Delmelle, D. Ghosh, and A. Paez. Surrey: Ashgate.