
Abstract
This article discusses the near real-time (NRT) satellite mapping activities in response to the recent Gorkha earthquake in Nepal by UNSW as well as other institutions around the globe. This study demonstrates that data from current SAR satellites can already be processed and delivered in near real-time to support post-disaster response and emergency management. Three ALOS-2 PALSAR-2 interferometric pairs were used by the GEOS team at UNSW (2 Stripmap pairs and 1 ScanSAR pair) to deliver a suite of satellite remote sensing products, such as the differential interferometric SAR (DInSAR) interferogram, DInSAR ground displacement map, contour map of ground deformation, horizontal ground displacement based on the pixel offset tracking analysis, and damage map based on coherence difference analysis. This study shows that the mapping products can be released 6–8 hours after the post-event image is acquired using international ground receiving stations, with the direct mapping activities such as DInSAR and GIS processing typically taking 3–4 hours only. This study also discusses the urgent need for internationally coordinated development and deployment of SAR satellite constellations in order to greatly reduce the latency in NRT mapping of disasters, which will benefit a range of other satellite remote sensing applications as well. Moreover, it is suggested that the near real-time responses be coordinated across the globe in order to improve the effectiveness of rapid disaster mapping in order to mitigate the effects of earthquakes and other natural disasters.
Introduction
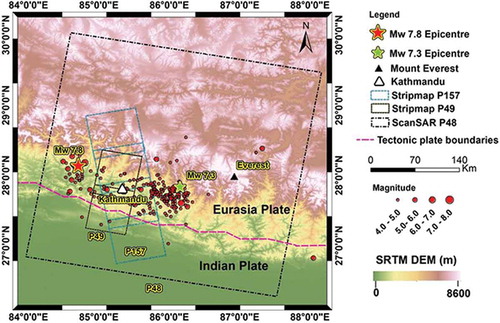
The Mw 7.8 Gorkha earthquake occurred at 06:11:26 UTC on 25 April 2015 (USGS Citation2015a). Its epicentre was 77 km North-West of Kathmandu, Nepal, and its hypocentre was at a depth of about 15 km. Following this large seismic event, hundreds of aftershocks have occurred, including the major aftershock with Mw 7.3 occurred at 07:05:19 UTC on 12 May 2015. The locations of the main shock and the aftershocks are shown in . As of 26 May 2015, it is estimated that over 8600 people were killed (ABC news Citation2015) and more than 21,900 injured (Government of Nepal Citation2015) as a result of the quake. Over 770,000 houses were damaged and hundreds of thousands were made homeless due to the collapse of many houses and public structures. The Gorkha earthquake was believed to be the most devastating natural disaster to strike Nepal since the 1934 Mw 8.0 Nepal–Bihar earthquake.
Figure 1. Locations of the Mw7.8 Gorkha earthquake and aftershocks (with magnitude greater than 4) overlaid on an elevation map, together with the coverage of ALOS-2 Stripmap (SM) and ScanSAR data used in this study. Path 48 is covered by ALOS-2 data in SM3 mode. Path 49 is covered by ALOS-2 data in SM1 mode. Path 49 is covered by ALOS-2 data in ScanSAR mode.
As known widely, victims trapped in the disastrous areas that are rescued within the first 24 to 72 hours may have a large chance to survive (Jang, Lien, and Tsai Citation2009). Hence, the number of survivors depends significantly on the number of victims that are being rescued in the ‘Golden 72 hours’. Remote sensing satellite data with large coverage has the potential to play an important role in supporting the post-disaster response and emergency management. However, there is a crucial requirement for satellite data to be used in near real-time response to the natural disaster: the satellite must be programed to capture images, these images must be delivered to a ground receiving station, and they must be analysed with results delivered to the relevant agencies, all within 72 hours after the disaster.
The main advantage for hazard mapping using satellite remote sensing is its large spatial coverage and cost effectiveness, especially for large-scale seismic events. While optical satellite data are often affected by the weather, SAR (Synthetic Aperture Radar) is capable of imaging anytime of the day under all-weather condition (except with exceptionally heavy rain when very short wavelength SAR is used). Because of its strengths, SAR is often the sensor of choice for hazard mapping over the optical sensor. Satellite interferometric SAR (InSAR) has been widely accepted as a powerful tool for mapping co-, post- and inter-seismic deformation since its successful application to the 1992 Landers Earthquake (Massonnet et al. Citation1994; Jonsson et al. Citation2002; Fialko et al. Citation2005; Matsuoka Citation2006; Miyagi et al. Citation2007; Wang, Xu, and Ge Citation2007). However, results have always been published months or even years after such events. InSAR processing software, ground-station capabilities, and real-time orbits (Scharroo and Visser Citation1998) have improved so much that ‘near real-time’ interferometry is now possible, that is, mapping results can be generated several hours after the post-event image acquisition.
Near real-time InSAR was first attempted with the European Remote Sensing Satellite-2 (ERS-2) data soon after the 1999 Mw 7.1 Hector Mine Earthquake (Sandwell et al. Citation2000). Using an in-house satellite ground receiving station, it took less than 20 hours to produce the results after the post-quake flight. The GEOS team at UNSW demonstrated that DInSAR analysis can be completed within 30 minutes in their response to the 2008 Sichuan earthquake, China (Ge, Chang, and Rizos Citation2007). They further demonstrated that flood extent maps based on InSAR coherence and SAR intensity can be automatically generated and delivered within 29 minutes when they responded to the 2010–2012 major floods across Australia in the states of Queensland, New South Wales, Victoria, and Western Australia if a local ground receiving station is available. Recently launched satellites, such as Radarsat-2, ALOS-2, and Sentinel-1A, are capable of capturing images with multiple imaging mode as well as shorter revisiting cycle. This allows greater chance to cover the area affected by the natural disaster in much shorter time and hence significantly increase the capability of near real-time applications of satellite remote sensing in response to natural disasters.
This article is organised as follows. The location of the Gorkha earthquake and the data used in this study are first presented. Next, the near real-time mapping activities that have been conducted at UNSW are demonstrated. The activities conducted by other institutions in response to the quake are then discussed. Subsequently, the current limitation and possible strategy for near real-time response to future quake are discussed. Finally, some concluding remarks are given.
UNSW response to the Gorkha earthquake
In this section, the near real-time mapping activities in response to the recent Gorkha Earthquake by UNSW are discussed. In particular, the rapid mapping of co-seismic deformation due to the Gorkha earthquake by InSAR using ALOS-2 data is reported.
Input data
The UNSW near real-time mapping activities were conducted using the Japanese ALOS-2 (Advanced Land Observing Satellite-2) PALSAR-2 (Phased Array type L-band Synthetic Aperture radar -2) data. ALOS-2 is a follow-on Japanese satellite mission to the ALOS-1 and was launched by the Japan Aerospace Exploration Agency (JAXA). It is able to capture SAR image in several imaging modes (Okada et al. Citation2013). This allows ALOS-2 to be used for different hazard mapping applications. For the purpose of damage assessment and pixel offset tracking, higher spatial resolution is essential. The ALOS-2 PALSAR-2 can acquire images with high spatial resolution (3–10 m) in Stripmap (SM) mode. In SM mode, the image swath is 55–70 km wide, variable look angles are employed, and the satellite revisit time is 14 days. On the other hand, in order to map the co-seismic displacement over the whole fault zone, wider coverage is required. The ALOS-2 PALSAR-2 can acquire images in ScanSAR (wide swath) mode with a swath width of 350 km. Although the image acquired in ScanSAR has lower spatial resolution, it is important for monitoring the Gorkha earthquake deformation for two reasons. First, the extent of the deformed area was over 150 km in length. It is necessary to cover the earthquake with multiple tracks if the SM data are used. However, the fringes of the differential interferograms between different tracks can be inconsistent due to aftershock displacement, orbit error, and atmospheric disturbances as these data are likely acquired with some time apart (Zhang et al. Citation2010). ScanSAR is able to cover the whole quake in one scene, so the co-seismic deformation map can be generated without suffering the inconsistency between different tracks. Second, ScanSAR is able to cover much larger area with one single observation, so the revisit time can be significantly shortened.
In order to map the co-seismic deformation, SAR images for each satellite path or overflight track acquired before the earthquake event must be available. As shown in , the locations of the main shock and aftershocks spread over such a wide area that it required ALOS-2 PALSAR-2 SM acquisitions from multiple paths and frames to cover the whole area. On the other hand, only one ALOS-2 PALSAR-2 ScanSAR scene is needed. shows the information of the 3 interferometric pairs used in this study. The first 2 pairs (IP1 and IP2) were acquired in SM mode, which covered only the major affected area, i.e. near Kathmandu. The last pair (IP3) was acquired in ScanSAR mode, which covered the whole seismic fault.
Table 1. Information for the ALOS-2 interferometric pairs used in this study (Processing level 1.1).
Due to the widespread devastation of the quake, the SAR coverage from SM mode appeared to be limited. Hence, several images from the same path (at different frames) are needed in order to include areas of least impact (stable area), which can be used as reference for phase unwrapping and pixel offset tracking. ALOS-2 data acquired in multiple frames of the same path were first mosaicked before the analysis, i.e. 3 frames from Path 157 and 2 frames from Path 49.
Results from differential SAR interferometry
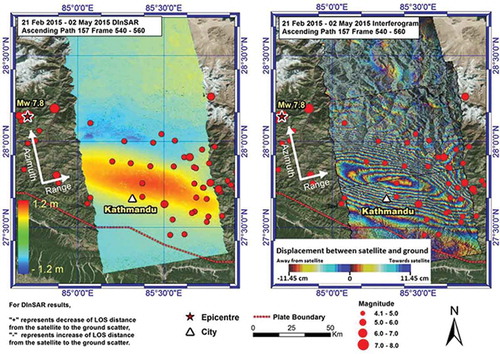
– show the differential InSAR (DInSAR) interferograms and displacement maps derived from ALOS-2 PALSAR-2 co-seismic pairs for paths 157, 49, and 48, respectively (as listed in ). The results were derived using the two-pass DInSAR technique (Massonnet et al. Citation1993; Ge et al. Citation2009). InSAR calculates interference patterns from the difference of two SAR images (Zebker and Goldstein Citation1986). During interferogram generation, the phase due to both the curvature of the Earth and the topography were removed from the full resolution interferogram on a pixel-by-pixel basis (Zebker et al. Citation1994a; Rosen et al. Citation2000). The resulting interferogram is a contour map of the ground displacement in the radar Line-of-Sight (LoS), given that the topographic phase component is properly removed (Ge et al. Citation2009; Zebker et al. Citation1994b; Ng et al. Citation2009). The one-arc-second Shuttle Radar Topography Mission (SRTM) DEM was used to remove the topographic phase components in the DInSAR analysis (Ge et al. Citation2009). The accuracy of range measurement is estimated to be better than 1 cm, based on comparisons with ground surveys reported in previous studies (Massonnet, Thatcher, and Vadon Citation1996; Ge et al. Citation2004; Ge, Chang, and Rizos Citation2007).
Figure 2. (Left) LoS ground displacement and (right) differential interferogram from ALOS-2 PALSAR-2 Stripmap InSAR pair IP1 (21 February 2015 and 2 May 2015). Positive LoS displacement represents the imaged pixel moving towards the satellite, while negative LoS displacement represents the movement away from the satellite.
Because the devastation was so widespread, long strip single polarization (HH) products of 3 frames (IP1) and 2 frames (IP2) with file sizes of 3.7 GB (IP1) and 11 GB (IP2), respectively, were generated before the analysis. shows the detail processing time required to deliver the DInSAR product after the image was captured. It can be seen that the total amount of time required to deliver the DInSAR results for Stripmap data is approximately 6–8 hours. The time required to deliver the ScanSAR data is about 5 times longer because there are 5 swaths in the ScanSAR data.
Table 2. Processing time to deliver the DInSAR results for the 3 ALOS-2 interferometric pairs.
Since the location of the quake is in the mountain range, strong atmospheric, foreshortening and layover effects were observed. The interferometric baselines of all pairs used in this study are reasonably short (less than 300 m), which kept the topographic induced error to minimal. However, strong decorrelation was observed at the upper part of the fault zone, which was likely caused by the snow or heavy vegetation. The coherence of the interferograms was generally high for the lower part of the fault zone (around Kathmandu) because of the infrastructures over the Kathmandu city and the relatively low elevation (hence no snow).
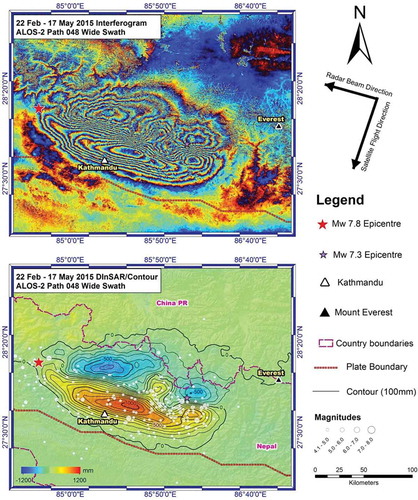
It can be seen from the LoS displacement maps in – that the displacement measurements obtained from both SM pairs and the ScanSAR pairs show consistent ground deformation. The advantage of the ScanSAR product for mapping co-seismic deformation using DInSAR can be clearly seen. While the SM pairs ( and ) can only cover parts of the fault zone, the ScanSAR pair () is able to cover the whole fault zone and provide the displacement measurement for the main shock and all major aftershocks in one scene. This is very important for near real-time co-seismic deformation mapping as it could took the SAR satellite more than a month to collect the data necessary to map the whole fault using SM mode (Ge et al. Citation2008). However, because of the relatively low spatial resolution, the ScanSAR data may not be as useful as the SM data for other applications such as pixel offset tracking and damage assessment. These applications can be significantly dependent on the spatial resolution of the input data. ALOS-2, which is capable for capturing image with different modes and look angles, can be a very powerful tool for hazard mapping.
Figure 3. (Left) LoS ground displacement and (right) differential interferogram from ALOS-2 PALSAR-2 Stripmap InSAR pair IP2 (7 November 2014 and 8 May 2015). Positive LoS displacement represents the imaged pixel moving towards the satellite, while negative LoS displacement represents the movement away from the satellite.
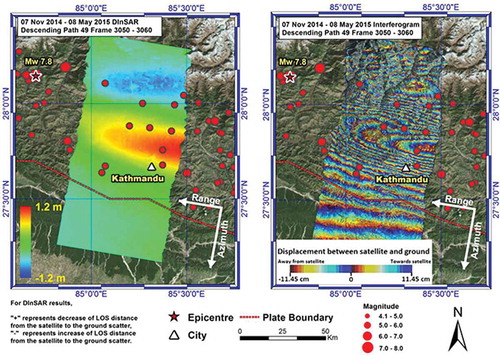
Figure 4. (Upper) Differential interferogram and (Lower) LoS ground displacement from unwrapping ALOS-2 PALSAR-2 ScanSAR InSAR pair IP3 (22 February 2015 and 17 May 2015). Positive LoS displacement represents the imaged pixel moving towards the satellite, while negative LoS displacement represents the movement away from the satellite.
From the displacement maps obtained from the 3 interferometric pairs, it is estimated that some locations were displaced by a maximum of 120 cm towards the satellites and some other locations moved 80 cm away from the satellite. There is a good agreement between the displacements observed from the ascending (IP1) and descending (IP2 and IP3) pairs, suggesting that the majority of the co-seismic displacement is in vertical direction instead of East-West direction. Assuming purely vertical motion, uplift of up to 1.5 m were observed at the lower part of the fault zone and the subsidence at the upper part of the zone was up to 1 m.
Because of the strong decorrelation at the upper part of the fault zone, the magnitude of the displacement over the area could be underestimated due to error in phase unwrapping. Therefore, pixel offset analysis was applied in order to resolve displacements along the fault, not only to estimate the horizontal displacement patterns, but also for validation purpose. Usually, InSAR is typically more accurate (~cm level) than pixel offset analysis (tens of cm), but InSAR is often limited by decorrelation noise as well as its dynamic range (~1–2 m) (Ge, Chang, and Rizos Citation2007).
Results from pixel offset analysis
In order to measure large ground displacement along the fault, pixel offset analysis (Wang et al. Citation2007; Tobita et al. Citation2001; Fialko, Simons, and Agnew Citation2001; Michel, Avouac, and Taboury Citation1999) was carried out in order to calculate the ground surface movement in both the azimuth and range directions (satellite radar scans an area of interest in both the satellite flight direction, i.e. the azimuth direction, and the slant range (LoS) direction). The azimuth and range offset were first estimated using the intensity cross-correlation method for each grid of 8 and 16 pixels, respectively. The correlation function between the images at each pixel was oversampled by 32 times in both directions in order to achieve sub-pixel level accuracy. The orbit induced offset was estimated using the orbit information and were removed from the pixel offset calculated from the cross-correlation method. The topography induced offset in slant range direction was estimated and removed. A quadratic polynomial was used to remove trends in the residual offsets (i.e. removal of orbital error or atmospheric effect). The refined offsets were then converted to ground surface displacement in both azimuth and range directions. and show the pixel offset tracking results for ALOS-2 PALSAR-2 Stripmap interferometric pairs IP1 and IP2, respectively. Since the resolution of interferometric pair IP2 (3 m) is approximately 3 times better than that of interferometric pair IP1 (10 m), the accuracy of the pixel offset results for IP2 is expected to be 3 times better.
Figure 5. Pixel offset results for ALOS-2 PALSAR-2 Stripmap InSAR pair IP1 (21 February 2015 and 2 May 2015) in (left) azimuth direction and (right) slant range direction. Positive azimuth offset represents imaged pixel moving along the satellite heading direction, while negative azimuth offset represents movement opposition to the satellite heading direction. Positive slant range offset represents the imaged pixel moving away from the satellite, while negative offset represents the movement towards to the satellite.
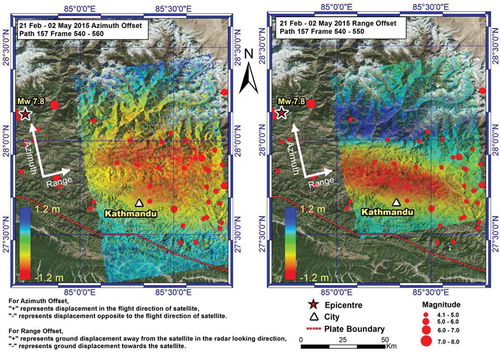
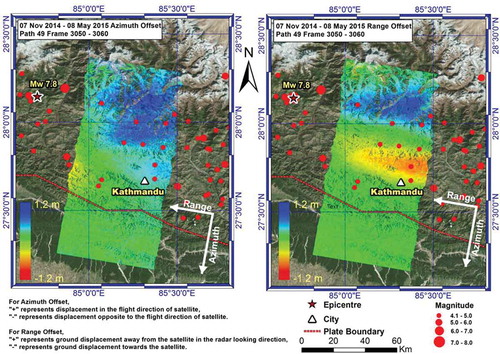
Figure 6. Pixel offset results for ALOS-2 PALSAR-2 Stripmap InSAR pair IP2 (7 November 2014 and 8 May 2015) in (left) azimuth direction and (right) slant range direction. Positive azimuth offset represents imaged pixel moving along the satellite heading direction, while negative azimuth offset represents movement opposition to the satellite heading direction. Positive slant range offset represents the imaged pixel moving away from the satellite, while negative offset represents the movement towards to the satellite.
Comparing the results of slant range offset and unwrapped DInSAR result, it can be seen that, in general, the two agree well with each other. However, pixel offset analysis reveals slightly larger ground displacement along the rupture zone, especially in the centre of the deformation zones as well as the area where strong decorrelation is observed in the DInSAR interferogram. The difference between the results might be because of the error in unwrapping process during DInSAR analysis. Hence, pixel offset analysis can be used to complement the InSAR results along the fault zone.
As can be seen from azimuth offset maps in and , the azimuth offsets obtained from IP1 (ascending pair) and IP2 (descending pair) are opposite in sign at the displacement zones. This suggested that there was a strong displacement in North-South direction beside the vertical displacement. The opposite azimuth offset patterns observed in the ascending and descending pairs suggested that the whole fault zone was moving towards south.
Results from coherence difference analysis
Three ALOS-2 PALSAR images over Kathmandu with the same path, frame, and looking angle were collected for coherence difference analysis, which was pioneered by the 1st author and his colleagues in 1997 when they studied the 1995 Kobe earthquake in Japan. Two of the images were acquired before the Nepal earthquake (collected on 4 October 2014 and 21 February 2015) and the other one was acquired after the earthquake (on 2 May 2015).
The coherence results from both the pre-seismic pair and the co-seismic pair were first generated, which were regarded as the master coherence and the slave coherence, respectively. To remove the bias caused by different imaging condition on different dates, both of the coherence results were subtracted by their mean pixel value of the whole image. After that, the coherence difference map was generated by differencing the two coherence results. With geo-coding and rectification, the map can be overlaid on the basemap and high-resolution optical images.
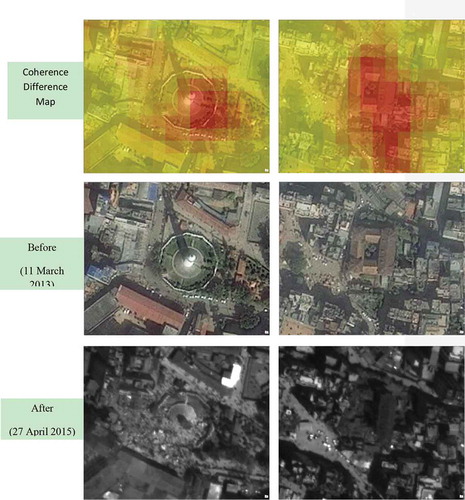
In the resulted damage map shown in , the higher value (red colour) represents relatively large ground cover change (e.g. severe damage) and the lower value (green and yellow colour) means the corresponding location is relatively stable during the earthquake. The principle behind this is that damage due to the quake will lead to low coherence for the co-seismic pair and hence a high positive value for the coherence difference, while the area with little damage will have similar coherence values between the co-seismic and pre-seismic pairs and hence a low for the coherence difference. From , we can find that some collapsed buildings in the urban area as seen in high resolution optical images can be identified, as indicated in the coherence difference map. The high-resolution reference images for before and after the earthquake were provided by DigitalGlobe.
Figure 7. Coherence difference map.
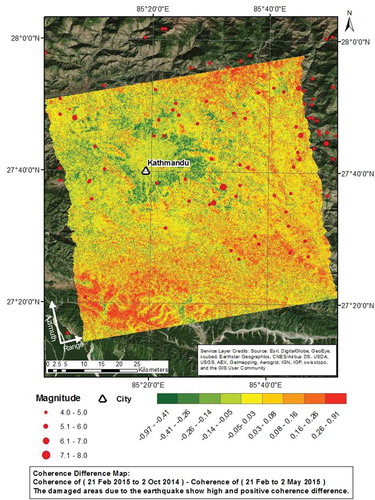
Figure 8. Damage affected areas: comparison between coherence result and optical images.
Therefore, the coherence difference between pre-seismic and co-seismic pairs can provide a quantitative measure of earthquake damage, which can be very helpful for first responders to identify the areas severely affected by the earthquake.
Significant impact of the UNSW near real-time response to the Gorkha earthquake
NRT satellite remote sensing results can play a range of significant roles in managing and mitigating natural disasters. For example, the epicentre of a quake is often not at the same location as the peak ground deformation. In the case of the Gorkha event, the epicentre is about 80 km from the zone of maximum ground displacement near Kathmandu. Without a NRT displacement map from InSAR, the search and rescue efforts would naturally be focussed around the epicentre based on intelligence from the seismic data. However, the worst damage occurs where the ground surface deforms the most. It would be ideal to use the NRT displacement map together with other intelligence such as co-seismic deformation inferred from seismic data, population distribution for effectively directing limited search and rescue resources to the most needed regions. Given the rugged terrain in Nepal and the severe damage to the surface transport network because of the quake, it would be a waste of precious time if the search and rescue teams were sent to the epicentre first and then had to be redirected to the worst hit area.
The NRT satellite maps can also play a crucial role in assessing the trends of aftershocks and the risk of secondary disasters such as avalanche, landslide, and flooding. For example, two strong aftershocks occurred in Nepal on 12 May 2015, the M7.4 event at 07:05:19 UTC and the M6.3 event at 07:36:53 UTC. It is so unfortunate that the Nepalese people had to experience these events after surviving the main shock of 25 April.
Though an unfortunate situation, the occurrence of these shocks was in line with our earlier assessment of strong aftershocks based on PALSAR-2 image collected on 2 May 2015, for example,
Nepal earthquake: Expert fears satellite mapping could point to more aftershocks (ABC Online published on 5 May 2015) http://www.abc.net.au/news/2015-05-05/satellites-shows-future-nepal-earthquake-likely/6446618
Nepal continues to count bodies as experts warn of another major earthquake (ABC Radio aired on 6 May 2015) http://www.abc.net.au/pm/content/2015/s4230806.htm
Experts predict more seismic stress yet to be released – increased seismic risk in South Tibet (China Science Daily published in Chinese on 10 May 2015) http://news.sciencenet.cn/htmlnews/2015/5/318565.shtm
The above assessments were based on the fact that the 2015 Mw 7.8 Nepal earthquake produced only 1.5 m displacement and about 120 aftershocks at that time. In comparison, the 1906 M 7.8 San Francisco earthquake induced ground movement of 4.5 m while the 2008 Ms 8.0 Sichuan earthquake produced 6.7 m displacement and about 740 aftershocks, although the difference in crustal geological conditions needs to be considered. Further, earlier studies show relative plate movement in the region at about 4 cm/year. Given the seismic cycle for the region is about 80 years, the expected ground displacement would be 3.2 m when the seismic stress is fully released.
It is a relief, however, to see that our scientific findings based on satellite radar remote sensing were able to reach not only the geosciences community, such as the Nepal Geological Society (NGS), Nepal’s home ministry, and the China Earthquake Administration (CEA), but also the general public in Nepal, China, Australia, and other countries, through the mainstream media such as the ABC (the Australian Broadcasting Corporation) and the China Science Daily. There is no doubt that people in the quake-affected regions had been warned of more strong aftershocks based on our findings and, as a result, had become more vigilant before the strong aftershocks.
Further, the UNSW NRT satellite maps were also used to direct ground survey activities by NGS and CEA. Further details will be published in future joint papers with these agencies.
Other near real-time mapping activities in response to the Gorkha earthquake
Apart from the near-real time mapping activities at UNSW, several other institutions around the world have also conducted similar activities. It is very hard to give a full comprehensive summary of all these near-real time activities so our apologies to any significant work which might be overlooked here, but the works conducted by a few selected institutions are described below.
NASA
NASA has been playing an important role in supporting search and rescue in Nepal as well as helping Nepal to recover from the earthquake.
Advanced Rapid Imaging and Analysis centre for Natural Hazards team at Jet Propulsion Laboratory and Caltech
Advanced Rapid Imaging and Analysis (ARIA) Centre is a joint centre between the California Institute of Technology (Caltech) and NASA Jet Propulsion Laboratory. The aim of ARIA Centre is to provide images on an operational level in near real-time through space-based geodetic techniques (e.g. GPS and InSAR) in response to disasters (e.g. earthquakes and volcanic eruptions) to local/international hazard response teams. ARIA is capable of providing automatically generated horizontal and vertical ground displacement maps from GPS and InSAR within 30 minutes and 4 hours, respectively (ARIA Products Citation2015). It is able to provide the damage proxy map (DPM) to estimate the damage due to earthquake based on the difference between the correlation maps before and after earthquake within 4 hours. These information are useful for recuse and recovery operation. In addition, ARIA is capable of generating and updating the static model of fault slip from GPS, InSAR, and seismic data automatically within 30 minutes (GPS) and 4 hours (InSAR) (ARIA Products Citation2015).
ARIA responded to the Gorkha Earthquake by generating rapid GPS and SAR products. ARIA released a 30 m resolution DPM (NASA/USAID Citation2015) with a coverage of 40 km x 50 km on 1 May 2015, 7 days after the quake and 4 days after the post-seismic images acquired. The DPM was generated using the X-band SAR satellites of the Italian Space Agency (ASI)’s COSMO-SkyMed constellation from 24 November 2014 to 29 April 2015. On 11 May 2015, 17 days after the quake, ARIA released a DPM with the same resolution but larger coverage (70 km x 180 km) that were derived from the ALOS-2 satellite data acquired on 21 February 2015 and 2 May 2015.
On 2 May 2015, ARIA released the co-seismic interferogram generated using the Sentinel-1A data acquired on 17 April 2015 and 29 April 2015 (NASA’s ARIA Project Citation2015). The result suggested that the land around Kathmandu has moved upward for more than 1 metre. However, the area near the displacement peak was incoherent, and hence the most interesting area has been masked. On 4 May 2015, ARIA released the co-seismic interferogram generated using the ALOS-2 data acquired on 21 February 2015 and 2 May 2015, suggesting the land around Kathmandu has uplifted by up to 1.6 meters if purely vertical motion is assumed. The unwrapped phase and the displacement maps were soon released on 7 May 2015, suggesting the area north of Kathmandu has subsidence as much as 1.2 m. These data have been integrated into the US Geological Survey ShakeMap (USGS Citation2015b).
The displacement results from ARIA have been used to build detailed models of the fault slip together with the teleseismic and GPS measurement (NASA/Caltech Citation2015). On 4 May 2015, a kinematic rupture model has been released by ARIA, which suggested that the peak fault slip exceeded 6 m.
Short-term Prediction Research and Transition Centre
The NASA Short-term Prediction Research and Transition Centre team at Marshall Space Flight Centre has generated the light emission reduced map, 5 days after the quake, using two Visible Infrared Imaging Radiometer Suite Sensor (VIIRS), one collected pre-earthquake (on 22 April 2015) and one post-earthquake (on 26 April 2015). The information obtained from the decrease in emitted light over the city of Kathmandu and surrounding areas can be useful for identifying the location of possible damaged electrical infrastructure and the regions that are seriously affected by electrical outages (SPoRT Satellite Citation2015). The major problem for the sensor is that it is sensitive to cloud where no information can be obtained at areas that were covered by cloud.
Jeffrey Kargel and Gregory Leonard research team
On 1 May 2015, Scientists Walter Immerzeel and Philip Kraaijenbrink, from Utrecht University, Netherlands, have used two Landsat 8 images to reveal the true extent of damage in Langtang Valley that was seriously affected by the earthquake (Landsat 8 Citation2015). The Landsat 8 images were acquired on 27 April 2014 and 30 April 2015, and the results were released on 1 May 2015. The image acquired on 30 April 2015 was used because it was the first largely cloud-free image for Langtang Valley after the quake. The results suggested that the eastern part of Langtang village was buried by the ice avalanche and large rocks due to the earthquake. Several other villages were also affected by the ice avalanches or landsides. However, the authors suggested that high resolution image is needed to identify the exact extent of these small settlements. These scientists are part of an international volunteer group of 35 members led by University of Arizona scientists Jeffrey Kargel and Gregory Leonard, which was launched soon after the earthquake.
InSARap (ESA)
The InSARap is an InSAR project of the Scientific Exploitation of Operational Missions (SEOM) programme, which is led by Norut in Norway, and includes Leeds University, UK, Dutch-based PPO.labs, the Polish Geological Institute, and the Geological Survey of Norway (Sentinel-1 Citation2015). The objective of the project is to exploit and validate the InSAR performance for the Sentinel-1A data acquired in Terrain Observation with Progressive Scan (TOPS) SAR mode.
On 29 April 2015, 5 days after the earthquake, the very first DInSAR product was generated using two Sentinel-1A images acquired on 17 April 2015 and 29 April 2015, respectively (Amos Citation2015), as part of the InSARap study. InSARap has demonstrated that the Sentinel-1A DInSAR product can be generated and released within 24 hours after the post-seismic images have been captured. The Sentinel-1A TOPS data (interferometric wide swath mode) is able to cover 250 km wide area at each data-take with spatial resolution of 5 m x 20 m, which is capable of covering the whole quake-affected region. The DInSAR result proved that an area 120 km by 50 km around Kathmandu has lifted up with a maximum displacement of at least 1 m. After the release of the preliminary differential interferogram product, the displacement map and pixel offset (range and azimuth) results derived from the two images acquired on 17 April 2015 and 29 April 2015 were released on InSARap’s website a few days later.
JAXA EORC
After the earthquake occurred, JAXA received the emergency observations request from Sentinel Asia and the International Charter. JAXA’s ALOS-2 PALSAR-2 has captured SAR images of Kathmandu and relevant area and provided them to the relevant organisations. The related works from JAXA were published on EORC (Earth Observation Research Center) website.
On 1 May 2015, JAXA released the change detection results over Kathmandu generated using the dual polarization images obtained from the pre- and post-seismic observation acquired on 13 March 2015 and 26 April 2015, respectively (JAXA/EORC Citation2015a). On the same day, JAXA has released the ALOS-2 ScanSAR interferogram generated using the data acquired on 31 March 2015 and 28 April 2015 (JAXA/EORC Citation2015b). The results suggested that the extent of the deformation were as far as 170 km east-southeast from the epicentre.
On 3 May 2015, JAXA released the damage detection results obtained based on the comparison between ALOS-2 data (26 April 2015) and ALOS-1 PRISM and AVNIR-2 data (12 October 2008) over the Langtang village. JAXA also released landslide, avalanche, and river damage detection analysis results generated using the image provided from Digital Globe, Inc. and ALOS PRISM image (JAXA/EORC Citation2015c).
On 7 May 2015, JAXA released the ALOS-2 interferomeric analysis results obtained from two SM data acquired on 21 February 2015 and 2 May 2015 (JAXA/EORC Citation2015d). The results showed that the extent of the affected area was more than 100 km from north to south with about 1 m land movement around the central Kathmandu. JAXA identified several local displacement zones around Kathmandu and suggested the damage of roads and buildings over these zones were caused by the land displacement. The detailed analysis of building and road damage assessments were conducted using the difference of coherence images obtained from pre-seismic and co-seismic pairs.
Geospatial information authority of Japan
Geospatial information authority of Japan (GSI) is the national institution which conducts surveying and mapping for the national land of Japan. GSI also offers InSAR derived crustal movement measurements for major global and local earthquake events.
On 30 April 2015, GSI released the ALOS-2 ScanSAR co-seismic interferogram derived from images acquired on 31 March 2015 and 28 April 2015 that covered part of the seismic area (GSI Citation2015). GSI showed that a major displacement area with greater than 10 cm movement can be found at about 160 km in the east-west direction. On 5 May 2015, GSI released the ALOS-2 co-seismic interferogram generated using the SM data acquired on 21 February 2015 and 2 May 2015. The result showed that a maximum displacement (>1.2 m) moving toward the satellite was observed at around 30 km east from Kathmandu. GSI later released the ALOS-2 ScanSAR co-seismic interferogram (based on the 5 April 2015–03 May 2015 pair), which covered the whole seismic fault. On 20 May 2015, GSI released ScanSAR co-seismic interferogram (based on the 03 May 2015 – 17 May 2015 pair), which showed that the affected area due to the Mw 7.3 aftershock occurred on 12 May 2015. GSI suggested that a maximum displacement of over 70 cm toward the satellite was observed as a result of the large aftershock. The aftershock occurred at the area where no large slip for main shock was found (GSI Citation2015).
UCSD
A research group in University of California, San Diego, USA (UCSD) derived the co-seismic displacement maps using ALOS-2 SM and ScanSAR pairs (same data as those used in GSI) acquired at different paths and published their research results (Lindsey et al. Citation2015). The co-seismic interferogram and LoS displacement maps were provided for download free-of-charge on 7 May 2015. The LoS data were available in Google Earth KMZ format as well as ASCII file format. On 20 May 2015, the LoS displacement map for the Mw7.3 aftershock was released together with the sum of displacement for the Mw7.8 and Mw7.3 quakes.
Discussion
In this section, the current limitations for near real-time mapping of natural disasters and the possible improvements for responding to future events are discussed.
Data availability for near real-time response
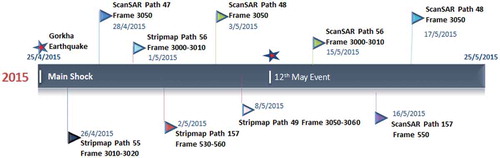
For this Gorkha earthquake event, most institutions were able to respond and release the results in 1 to 3 days once the satellite data were made available. These studies have clearly demonstrated the great potential of satellite data to be used in near real-time response to natural disasters. If there are sufficient satellite data available within the first 48 hours of the disaster, the use of satellite data for near real-time response to the natural disaster within the ‘Golden 72 hours’ is possible, i.e. to generate the hazard mapping product and to deliver the results to the relevant agencies. Unfortunately, there were only limited satellite data available within the first 72 hours of the disaster for the Gorkha earthquake. The availability of co- and post-seismic data has become the current major bottleneck for emergency response using satellite data. For example, shows a timeline of all ALOS-2 observations covering the area near Kathmandu since the Gorkha earthquake (until 1 month after the event). As can be seen, there was only one image collected on 26 April 2015 within the window of the first 72 hours of the quake. In fact, there was no pre-seismic image available to pair up with this image for interferometric analysis. The first ScanSAR image collected on 28 April 2015 was available just after the first 72 hours, covering only part of the quake-affected region. That was the similar case for Sentinel-1A, with the first available acquisition for co-seismic displacement mapping being acquired on 29 April 2015.
Figure 9. ALOS-2 observations in the first month after Gorkha earthquake.
Space agencies have been working hard to shorten the revisit time of radar satellites. In the past, the revisit times for SAR satellites were between 24 and 46 days (e.g. Radarsat-1, ERS-1/2, ENVISAT, JERS-1, and ALOS-1). In recent years, the revisit time for the SAR satellites have already been shorten significantly. Most current SAR satellites are able to provide repeat pass interferometric data within 15 days. For example, TerraSAR-X revisit time is 11 days, COSMO-SkyMed has 12 hours minimum revisit time, Sentinel-1A’s revisit time is 12 days and ALOS-2’s revisit time is 14 days. The revisit time for Sentinel-1 will be further shortened to 6 days after the realisation of Sentinel-1 constellation, which will be launched in 2016 (ESA Citation2015). It is expected that there will be increasing number of SAR satellites (some will be in the form of SAR satellite constellations) with even shorter revisiting time available in the future.
While it is yet to see that start-ups to embrace SAR technologies as they do with optical satellite remote sensing (e.g. https://www.planet.com/story/), it might be more realistic for spaces agencies from different countries to work together in order to deploy dozens of SAR satellites in constellations. This means close cooperation in both the SAR sensor development and satellite deployment.
Although researches have been undertaking repeat-pass DInSAR measurements of land deformation using unmanned aerial vehicles (Wheeler et al. Citation2004), satellite SAR constellations with global coverage are urgently needed for near real-time response to future natural hazards, such as earthquakes, because we simply do not know which country and region they will strike the next. The realisation of ‘InSAR everywhere, anytime’ and extensive mapping of such events globally will eventually lead to better understanding, management, and ultimately prediction of these events. Moreover, a wide range of other applications will also benefit from such SAR satellite constellations, such as oil spill monitoring, ship detection, sea wave and wind monitoring, coastal erosion assessment, island mapping, and cyclone monitoring and forecast.
Accessing the satellite SAR data by end user
Recently launched satellites such as ALOS-2 and Sentinel-1 are able to provide higher resolution SAR data with similar coverage to the past satellites. As a result, the data size has become much larger. For example, the data size of a single polarization ALOS-1 PALSAR-1 data acquired in SM mode is around 1 GB and its ALOS-2 PALSAR-2 counterpart ranges between 1 GB and 5.2 GB. With the dramatic increase in data size, the time required to download the data has become an issue for near real-time mapping activities. As can be seen in , the time spent for downloading the data contribute significantly to the total processing and delivery time.
Currently, the most common delivery arrangement for satellite SAR data is to download through Internet. In most cases, a single satellite SAR scene acquired with multiple polarizations is compressed into one single file together with the scene’s metadata. The users are not able to prioritise the file to be downloaded within the scene and are often forced to download the whole compressed file. This can significantly delay the response for delivering the hazard mapping products. For example, the interferometric pairs IP1 and IP3 used in this study were acquired in dual polarization (HH + HV). Since the near real-time product obtained from DInSAR and pixel offset analysis only require the data acquired in a single polarization (i.e. HH), half of the data downloaded are not necessary (i.e. HV). This means that if the users are able to download the HH and HV data separately, the time required to download the data for near real-time response can be shorten by 50%. In fact, similar concept has already been applied to the Landsat Data on Amazon Web Services (AWS). AWS makes each band of each Landsat scene available as a stand-alone file for download (AWS Citation2015). The users are able to download the specific band required for analysis. Hence, the user can largely reduce the time spent on downloading the data that may not be needed.
Further reduction of latency in NRT satellite remote sensing can be achieved in several ways. The first approach is to co-locate ground receiving, processing, and analysing facilities so that intelligence about the disaster can be derived from satellite images and disseminated automatically. This will remove the need to transfer large volume of satellite imagery from the ground receiving and processing centre to the data analysis centre. For example, the USGS Earthquake Hazards Program has been disseminating automatically seismic information in near real-time with a similar configuration (http://earthquake.usgs.gov/earthquakes/feed/).
The 2nd approach is to use ground receiving station local to the disaster-hit area or data relay communication satellite. This will remove the waiting time between image collection and satellite visible at an international ground receiving station, which can be quite significant depending on the relative positions of the area of interest and the receiving station location(s).
The 3rd approach is to deploy satellite onboard DInSAR processing and analysing capabilities so that the SAR satellites will broadcast ‘maps’, not downlink ‘images’.
Coordination between institutions
In the last section, several institutions that have conducted the near real-time mapping activities in response to the quake were introduced. It can be seen that there were a lot of overlap in products released from these institutions. This means that many resources were wasted on the repeated works. In order to maximise the efficiency for near real-time mapping activities in response to future disasters, a coordinated approach should be developed.
There were a number of associations (partnerships) which were involved in generation of scientific products for the Gorkha earthquake events. These partnerships bring together groups of scientists around the world, which aimed to provide coordinated and comprehensive earth observations and information for disaster rescue and recovery management. For example, (1) Group on Earth observations (GEO) is a voluntary partnership of governments and organisations that has been involved in a number of earthquake events. GEO has created an Event Supersite for the Nepal Gorkha earthquake. The registered scientists in the Nepal Event Supersite scientific community can access to a wide range of spaceborne and in-situ geophysical data, provided by participating organisations such as ESA, DLR, ASI, UNAVCO, and WInSAR, for the generation of scientific products. The registered scientists are also able to access the scientific products generated by the community; (2) Earthquake without Frontiers (EwF) is a partnership which brings together a group of earth and social scientists that are experts in earthquake science and the disaster recovery. EwF has ongoing blogs posting updates about their efforts to map infrastructure, damage, and hazards following this major earthquake, including the Gorkha earthquake. These partnerships have demonstrated that the scientists from different research fields are able to benefit from the coordinated approach. However, the global distributions of members in these associations are often limited to several countries. Therefore, an earthquake authority that is able to coordinate the emergency response for future earthquake event is necessary. The authority should coordinate the image acquisition plan between satellites and between space agencies over the active fault area. When the earthquake event happens, it should coordinate the relevant associations and the volunteers in responding to the disaster for rescue and recovery management in a more effective and efficient way.
Concluding remarks
From the above discussions, it is possible to conclude that satellite radar interferometry can be used as a powerful tool in near real-time to deliver ground surface deformation and damage extent maps based on InSAR and pixel offset tracking analysis, which can be used for mitigation of the effects of earthquake disasters. In particular, the NRT products can be used to direct search and rescue efforts, assess trends of aftershocks and other secondary disasters, and guide field surveys.
Several institutions involved in delivering near real-time disaster mapping products have been discussed, including NASA, JAXA, GSI, InSARap, and UCSD. It was found that there was significant overlap in scientific products delivered from these institutions. More coordinated efforts are needed to enhance the efficiency for near real-time response to earthquake disasters. Other possible strategies to enhance the near real-time activities in response to future earthquakes include (1) to develop new data delivery approaches, and (2) to increase the number of SAR satellite constellations to shorten the revisiting time, through cooperation among space agencies from different countries.
Disclosure statement
No potential conflict of interest was reported by the authors.
Acknowledgement
The authors thank JAXA for rapid acquisition and distribution of the ALOS-2 PALSAR-2 data. The data were provided under PI investigation project 1419 – Automated interferometric analysis of L-band SAR satellite data for operational earthquake and volcano monitoring. METI and JAXA retain ownership of the original ALOS-2 PALSAR-2 data.
Additional information
Funding
References
- ABC news. 2015. “Nepal Earthquake: Hundreds Gather in Kathmandu to Mark One Month since Devastating Quake.” May 26. http://www.abc.net.au/news/2015-05-26/hundreds-gather-nepal-capital-memorial-one-month-since-quake/6496562
- Amos, J. 2015. “Sentinel Satellite Reveals Nepal Quake Movement.” May 27. http://www.bbc.com/news/science-environment-32515059
- ARIA Products. 2015. “Advanced Rapid Imaging and Analysis (ARIA) Center for Natural Hazards.” May 27. http://aria.jpl.nasa.gov/products
- AWS. 2015. “Landsat on AWS.” June 5. http://aws.amazon.com/public-data-sets/landsat/
- ESA. 2015. “Earth Online - Sentinel 1.” June 5. https://earth.esa.int/web/guest/missions/esa-operational-eo-missions/sentinel-1
- Fialko, Y., D. Sandwell, M. Simons, and P. Rosen. 2005. “Three-Dimensional Deformation Caused by the Bam, Iran, Earthquake and the Origin of Shallow Slip Deficit.” Nature 435 (7040): 295–299. doi:10.1038/nature03425.
- Fialko, Y., M. Simons, and D. Agnew. 2001. “The Complete (3-D) Surface Displacement Field in the Epicentral Area of the 1999 M W 7.1 Hector Mine Earthquake, California, from Space Geodetic Observations.” Geophysical Research Letters 28 (16): 3063–3066. doi:10.1029/2001GL013174.
- Ge, L., H.-C. Chang, and C. Rizos. 2007. “Mine Subsidence Monitoring Using Multi-Source Satellite SAR Images.” Photogrammetric Engineering & Remote Sensing 73 (3): 259–266. doi:10.14358/PERS.73.3.259.
- Ge, L., X. Li, C. Rizos, and M. Omura. 2004. “GPS and GIS Assisted Radar Interferometry: Insar Application.” Photogrammetric Engineering & Remote Sensing 70 (10): 1173–1177. doi:10.14358/PERS.70.10.1173.
- Ge, L., A. H.-M. Ng, H. Wang, and C. Rizos. 2009. “Crustal Deformation in Australia Measured by Satellite Radar Interferometry Using ALOS/PALSAR Imagery.” Journal of Applied Geodesy 3 (1): 47–53. doi:10.1515/JAG.2009.005.
- Ge, L., K. Zhang, A. H.-M. Ng, Y. Dong, H. C. Chang, and C. Rizos. 2008. “Preliminary Results of Satellite Radar Differential Interferometry for the Co-Seismic Deformation of the 12 May 2008 Ms8.0 Wenchuan Earthquake.” Geographic Information Sciences 14 (1): 12–19.
- Government of Nepal. 2015. “Nepal Disaster Risk Reduction Portal.” May 26. http://drrportal.gov.np/
- GSI. 2015. “Crustal Deformation Observed by Synthetic Aperture Radar (SAR).” May 26. http://www.gsi.go.jp/cais/topic150429-index-e.html
- Jang, H.-C., Y.-N. Lien, and T.-C. Tsai. 2009. “Rescue Information System for Earthquake Disasters Based on MANET Emergency Communication Platform,” Presented at the Proceedings of the 2009 International Conference on Wireless Communications and Mobile Computing: Connecting the World Wirelessly, Leipzig, Germany.
- JAXA/EORC. 2015a. “ALOS-2/PALSAR-2 Observation Results of the 2015 Nepal Earthquake (1).” May 26. http://www.eorc.jaxa.jp/ALOS-2/en/img_up/dis_pal2_npl-eq_20150426.htm
- JAXA/EORC. 2015b. “ALOS-2/PALSAR-2 Observation Results of the 2015 Nepal Earthquake (2).” May 26. http://www.eorc.jaxa.jp/ALOS-2/en/img_up/dis_pal2_npl-eq_20150428.htm
- JAXA/EORC. 2015c. “ALOS-2/PALSAR-2 Observation Results of the 2015 Nepal Earthquake (3).” May 26. http://www.eorc.jaxa.jp/ALOS-2/en/img_up/dis_pal2_npl-eq_20150426.htm
- JAXA/EORC. 2015d. “ALOS-2/PALSAR-2 Observation Results of the 2015 Nepal Earthquake (4).” May 27. http://www.eorc.jaxa.jp/ALOS-2/en/img_up/dis_pal2_npl-eq_20150426.htm
- Jonsson, S., H. Zebker, P. Segall, and F. Amelung. 2002. “Fault Slip Distribution of the 1999 M-W 7.1 Hector Mine, California, Earthquake, Estimated from Satellite Radar and GPS Measurements.” Bulletin of the Seismological Society of America 92 (4): 1377–1389. doi:10.1785/0120000922.
- Landsat 8. 2015. “Landsat 8 Reveals Extent of Earthquake Disaster in Langtang Valley.” May 27. http://mountainhydrology.org/category/nepal-quake/
- Lindsey, E., R. Natsuaki, X. Xu, M. Shimada, H. Hashimoto, and D. Sandwell. 2015. “Line of Sight Deformation from ALOS-2 Interferometry: Mw 7.8 Gorkha Earthquake and Mw 7.2 Aftershock.” In Seismological Research Letters, in prep. http://topex.ucsd.edu/nepal
- Massonnet, D., K. Feigl, M. Rossi, and F. Adragna. 1994. “Radar Interferometric Mapping of Deformation in the Year after the Landers Earthquake.” Nature 369 (6477): 227–230. doi:10.1038/369227a0.
- Massonnet, D., M. Rossi, C. Carmona, F. Adragna, G. Peltzer, K. Feigl, and T. Rabaute. 1993. “The Displacement Field of the Landers Earthquake Mapped by Radar Interferometry.” Nature 364: 138–142. doi:10.1038/364138a0.
- Massonnet, D., W. Thatcher, and H. Vadon. 1996. “Detection of Postseismic Fault-Zone Collapse following the Landers Earthquake.” Nature 382 (6592): 612–616. doi:10.1038/382612a0.
- Matsuoka, M. 2006. “Use of ALOS/PALSAR Imagery for Monitoring Areas Damaged Due to Recent Natural Disasters.” Proceedings of SPIE 6412: 641204.
- Michel, R., J.-P. Avouac, and J. Taboury. 1999. “Measuring near Field Coseismic Displacements from SAR Images: Application to the Landers Earthquake.” Geophysical Research Letters 26 (19): 3017–3020. doi:10.1029/1999GL900524.
- Miyagi, Y., Y. Nishimura, H. Takahashi, and M. Shimada. 2007. “Crustal Deformation Caused by Earthquake Detected by InSAR Technique Using ALOS/PALSAR Data.” In American Geophysical Union, Fall Meeting 2007, abstract: G51C-0619. Washington, DC: American Geophysical Union (AGU).
- NASA/Caltech. 2015. “PIA19384: NASA/Caltech Team Images Nepal Quake Fault Rupture, Surface Movements.” May 27. http://photojournal.jpl.nasa.gov/catalog/pia19384
- NASA/USAID. 2015. “NASA/USAID SERVIR Initiative Responds to Earthquake in Nepal.” May 27. http://www.nasa.gov/mission_pages/servir/nasa-usaid-servir-initiative-responds-to-earthquake-in-nepal.html
- NASA’s ARIA Project. 2015. “NASA’s ARIA Project Maps Deformation of Earth’s Surface from Nepal Quake.” May 27. http://www.nasa.gov/jpl/nasas-aria-project-maps-deformation-of-earths-surface-from-nepal-quake
- Ng, A. H.-M., H. C. Chang, L. Ge, C. Rizos, and M. Omura. 2009. “Assessment of Radar Interferometry Performance for Ground Subsidence Monitoring Due to Underground Mining.” Earth, Planets and Space 61 (6): 733–745. doi:10.1186/BF03353180.
- Okada, Y., S. Nakamura, K. Iribe, Y. Yokota, M. Tsuji, K. Hariu, Y. Kankaku, S. Suzuki, Y. Osawa, and M. Shimada. 2013. “System Characteristics for Wide Swath L-Band SAR Onboard ALOS-2/PALSAR-2.” In Asia-Pacific Conference on Synthetic Aperture Radar (APSAR), 2013, 141–143. New York: Institute of Electrical and Electronics Engineers (IEEE).
- Rosen, P. A., S. Hensley, I. R. Joughin, F. K. Li, S. N. Madsen, E. Rodriguez, and R. M. Goldstein. 2000. “Synthetic Aperture Radar Interferometry.” Proceedings of the IEEE 88 (3): 333–382. doi:10.1109/5.838084.
- Sandwell, D. T., L. Sichoix, D. Agnew, Y. Bock, and J.-B. Minster. 2000. “Near Real-Time Radar Interferometry of the Mw 7.1 Hector Mine Earthquake.” Geophysical Research Letters 27 (19): 3101–3104. doi:10.1029/1999GL011209.
- Scharroo, R., and P. Visser. 1998. “Precise Orbit Determination and Gravity Field Improvement for the ERS Satellites.” Journal of Geophysical Research 103 (C4): 8113–8127.
- Sentinel-1. 2015. “Sentinel-1 - INSAR Performance Study with TOPS Data.” May 27. http://seom.esa.int/page_project007.php
- SPoRT Satellite. 2015. “SPoRT Satellite Image as Detected by the Visible Infrared Imaging Radiometer Suite Sensor of the Post Kathmandu Earthquake.” May 27. http://www.nzhealthtec.com/sport-satellite-image-as-detected-by-the-visible-infrared-imaging-radiometer-suite-sensor-of-the-post-kathmandu-earthquake/
- Tobita, M., M. Murakami, H. Nakagawa, H. Yarai, S. Fujiwara, and P. A. Rosen. 2001. “3-D Surface Deformation of the 2000 Usu Eruption Measured by Matching of SAR Images.” Geophysical Research Letters 28 (22): 4291–4294. doi:10.1029/2001GL013329.
- USGS. 2015a. “Magnitude 7.8 Earthquake in Nepal & Aftershocks.” May 26. http://www.usgs.gov/blogs/features/usgs_top_story/magnitude-7-8-earthquake-in-nepal/
- USGS. 2015b. “USGS ShakeMap: Nepal.” June 2. http://earthquake.usgs.gov/earthquakes/eventpage/us20002926#impact_shakemap
- Wang, H., L. Ge, C. Xu, and Z. Du. 2007. “3-D Coseismic Displacement Field of the 2005 Kashmir Earthquake Inferred from Satellite Radar Imagery.” Earth, Planets, and Space 59 (5): 343–349. doi:10.1186/BF03352694.
- Wang, H., C. Xu, and L. Ge. 2007. “Coseismic Deformation and Slip Distribution of the 1997 Mw7.5 Manyi, Tibet, Earthquake from Insar Measurements.” Journal of Geodynamics 44 (3–5): 200–212. doi:10.1016/j.jog.2007.03.003.
- Wheeler, K., S. Hensley, Y. Lou, T. Miller, and J. Hoffman. 2004. “An L-Band SAR for Repeat Pass Deformation Measurements on a UAV Platform.” In Radar Conference, 2004. Proceedings of the IEEE, Toulouse, 317–322. New York: Institute of Electrical and Electronics Engineers (IEEE).
- Zebker, H. A., and R. M. Goldstein. 1986. “Topographic Mapping from Interferometric Synthetic Aperture Radar Observations.” Journal of Geophysical Research 91 (85): 4993–4999.
- Zebker, H. A., P. A. Rosen, R. M. Goldstein, A. Gabriel, and C. L. Werner. 1994a. “On the Derivation of Coseismic Displacement Fields Using Differential Radar Interferometry: The Landers Earthquake.” Journal of Geophysical Research 99 (B10): 19617–19634.
- Zebker, H. A., C. Werner, P. A. Rosen, and S. Hensley. 1994b. “Accuracy of Topographic Maps Derived from ERS-1 Interferometric Radar.” IEEE Transactions on Geoscience and Remote Sensing 32 (4): 823–836. doi:10.1109/36.298010.
- Zhang, K., A. H.-M. Ng, L. Ge, Y. Dong, and C. Rizos. 2010. “Multi-Path PALSAR Interferometric Observations of the 2008 Magnitude 8.0 Wenchuan Earthquake.” International Journal of Remote Sensing 31 (13): 3449–3463. doi:10.1080/01431161003727804.