
ABSTRACT
Microwave radiations below say 1250 MHz penetrate forests, dry ice and rocks. The use of airborne or satellite borne microwave sensors to image the subsurface with significant penetration is thus of high interest to analyse wide areas or even to make global surveys. Due to the large distance from the targets, the antenna has to be synthesized using a progressive scan and illuminating the targets from different positions. The radar returns are then properly combined using a computer. The position of the sensor has to be known to a fraction of a wavelength. This is rather easy to obtain if the sensor flies along a well-characterized track (synthetic aperture radar (Bamler and Hartl, 1998)). The creation of the across track aperture is much more difficult. It can be done by using many flights or orbits, which positions, however, need to be extremely well known. We show that this can be obtained by exploiting the characteristics of the targets. We will present the results obtained with airborne campaigns using polarimetric radars on boreal and tropical forests, which were carried out in order to estimate the above ground biomass. Campaigns have also been carried out over glaciers, to estimate the structure of the subsurface. We will then introduce two new satellites, Biomass and SAOCOM companion, planned to be deployed by the European Space Agency in the forthcoming years. Exploiting the results of the ad hoc airborne campaigns, the results to be obtained with these systems are simulated and presented.
1. Introduction
Microwave radiations at low frequencies (L or P bands, namely from 1250 to 435 MHz) penetrate different kinds of media like forests, dry ice, rocks and then are reflected at the interface with other layers, like humid earth or the water table. Ground penetrating radars make use of this property to probe the subsurface up to depths that could be more than 20 m of dry sands in the case of 60–200 MHz carrier frequencies. The use of airborne or satellite borne microwave sensors to achieve similar penetrations is of utmost interest to make wide areas or even global surveys. In this case, however, as the sensor is far from the target, the directivity of the antenna has to be enhanced in order to achieve a reasonable spatial resolution. However, for the very same low frequencies that penetrate the terrain, the dimensions of the antenna would immediately go out of size. Thus, the antenna has to be synthesized: supposing that the target stays still during the survey, the antenna is progressively scanned and the terrain is illuminated from different positions (Pasquali et al. Citation1995). Finally, the antenna output is synthesized by using a computer to properly combine the radar returns (Synthetic Aperture Radar). Notice that the resolution in range (i.e. along the Line of Sight (LOS) that joins radar and targets) is provided by the short duration τ of the pulse that illuminates the target.
Hence, using airborne sensors, it is possible to achieve 3D studies (microwave tomography) of forests and glaciers (Reigber and Moreira Citation2000). This can be done in preparation of further studies to be carried out by satellites, to be able to extend these investigations to the entire earth surface. In this article, we will briefly describe the efforts in airborne SAR tomography that have been sponsored by the European Space Agency in preparation of two satellites, namely Biomass and SAOCOM Companion. The first should be launched in 2020 and the second, if properly financed, should be launched in 2018, in connection with the Argentinean satellite SAOCOM, for which it will constitute a secondary receiver located in a separate position (bistatic radar).
We will see how the above ground biomass (AGB) can be sensed and measured using microwave tomography, and how glaciers can be probed, penetrating at times down to the bedrock. In Section 2 we will see how the synthetic antenna has to be sampled along the two directions and we will shortly motivate the precision (to the millimetre, about) with which the flight coordinates have to be recovered. The resolution along the so-called azimuth (along track) direction, which corresponds to the flight direction of the sensor, is achieved by creating a synthetic array just with repeated pulse emissions during the flight. More expensively, N parallel flights have to be carried out to achieve sampling in the orthogonal, across track, direction (Tebaldini Citation2010; Frey and Meier Citation2011; Tebaldini and Rocca Citation2012; Nannini et al. Citation2012). This acquisition is N times more expensive in the case of airplanes, but in the case of satellites, exploiting the stationarity of the target, one can inexpensively profit of the many possible successive satellite passes. We will also relate N to the number of layers in which the target can be fractioned. In Section 3, we will introduce AGB estimates, and in Sections 4 and 5, we will show examples of studies of the boreal and the tropical forests, respectively, relating to AGB the radar returns from the different layers. In Section 6, we will discuss the ground-based radar tomographic experiment that was carried out in French Guyana to monitor the temporal stability of the tropical forest, as a satellite target. Then, we will refer of the glacier studies and the implications for satellites sensors. The conclusions will follow.
2. Microwave tomography: generalities
The concept of microwave tomography is indeed easy to understand and the unique problem would appear initially to be the cost relative to the multiplicity of the N passes needed to generate the across track directivity.
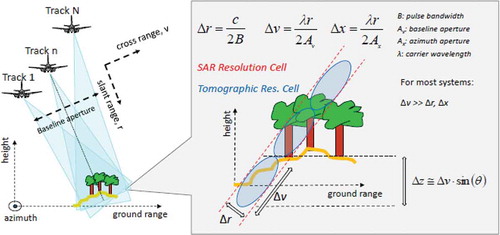
A cross-track antenna has to be synthesized. The overall cross-track width of the antenna, which is the baseline aperture Av in , is the component orthogonal to the LOS of the vector distance between the external flight lines. This width Av has to be related to the wavelength with the well-known relation:
where r is the distance sensor-target and is the across track resolution. However, to use a limited number of passes N corresponds to sample this antenna and that provokes replications of the target along the across track direction at a distance δr. The distance of the replicas should be larger than the target’s height H, so that we get the relation
Hence, given the height of the target H and the desired across track resolution ∆v we get the minimum number of passes, necessary to avoid replication. However, this is not the unique requisite: the received data should be properly calibrated in phase, as if they were received by a precisely machined antenna. This is not so, as the position of the airplane is surely not known to a subwavelength precision. The precision of the calibration could be appreciated if considering the case of a non-reflective layer in the middle of an uniform target distribution. To make the case simple, let us hypothesize that each reflector (corresponding to a layer) that shares the same range and the same azimuth cell is represented by a single complex number Ai (i being the layer index), and let us suppose that the rms value σA is the same for all the N layers but one. After range and azimuth focusing, if the combination of the reflections is phased to estimate the missing layer, then the reflectors should theoretically add to zero, but only in the case that their phases are properly recovered and refocused. But let us now suppose that there are phase errors ±i due to positioning errors di. It is immediate to see that in order to reduce the summation error say 15 dB below the average amplitudes of the layers σA, the positioning error σd should be below a few millimetres, in the case of λ = 68 cm and N = 7. In fact,
This is well beyond what is obtainable with the usual positioning techniques, so that data-based phase calibration should be used. This can be done in several ways: say, by exploiting the limited extent of the target using compressive sensing, or using the ground as a reference reflector (provided it is visible) or similar methodologies. Typically, vertical trunks on a flat ground appear as bright point scatterers due to their double bounce. The long experience in phase tracking point scatterers proves that phase errors as low as a few degrees can then be obtained. Anyway, the problem of phase calibration has indeed hindered the rapid development of tomographical methods that, however, are now beyond the learning phase and are rapidly expanding (Reigber, Prats, and Mallorqui Citation2006, Guarnieri and Tebaldini Citation2008; Tebaldini et al. Citation2015b).
Figure 1. Generation of the cross track antenna using repeated flights.
3. Above ground biomass estimates
AGB estimation is a very important element to evaluate the carbon balance of the planet. Several methods have been considered for the determination of the global AGB estimates, mostly based on radar satellites, as many forests are quasi perennially shrouded by clouds.
Polarimetric radar has been adopted for that, as the branches of the trees, slanting with respect to the ground, contribute to the conversion of polarimetric channels say from H to V and reciprocal. Thus, the HV response has mostly been related to the AGB even if external factor as terrain slopes, soil moisture, etc. can also contribute to the reflectivity and thus corrections are needed. Several studies have been made on this topic and statistical formulas have been obtained relating the polarimetric response of the forests to the AGB (Hensley et al. Citation2014; Soja, Persson, and Ulander Citation2015). However, even if these relations can be made unbiased, they are certainly characterized by the so-called saturation effect. Indeed the reflectivity could increase with the forest coverage and thus with the AGB. Very tall forest though, if no guarantee can be given of the penetration of the radiation to the ground, and if the attenuation (extinction) in the upper layers is significant, can yield a response that is progressively not increasing with AGB. This saturation effect becomes less significant by lowering the centre frequency of the radiations.
To improve on this methodology, the so-called PolInsar (Cloude and Papathanassiou Citation1998; Papathanassiou and Cloude Citation2001; Tebaldini Citation2009) method has been proposed in which two (or more) polarimetric radar images are taken over the same forest, with suitable across track baselines. Then, the full covariance matrix W between the three channels and the N passes [3N × 3N] can be determined. From this, a Kronecker decomposition into the combination of two scattering mechanisms, one for the ground and the other for the canopy can be adopted.
The polarimetric character is represented by the two [3 × 3] matrixes Cv, Cg, whereas the behaviour with the baselines is represented by the two [N × N] matrixes Rv, Rg (Tebaldini Citation2009). The behaviour of the phases of the two scattering mechanisms with the baselines, expressed by the matrixes Rv, Rg, allows to identify separately the ground elevation and the canopy height, profiting of their different polarimetric characters. From the canopy height then, using allometric relations that connect height and AGB, the estimation of the latter can be carried out. However, even if this methodology operates satisfactorily, forests exist where the height is less related to AGB, typically in the tropics. For these forests, tomography proves to be irreplaceable.
4. Airborne experiments on boreal forests
The first tomographical campaign carried out in P band was over the boreal forest of Remningstorp in southern Sweden ( (Tebaldini Citation2009)). A German airplane run by the DLR (the German Aerospace Center) and carrying a P band sensor was used to trace 9 passes horizontally spaced of 10 m horizontally, to achieve the tomographical analysis of the boreal forest. The results are visible in Figure 3. In we see an image of the forest and a cartoon representing the components contributing to a range and azimuth resolution cell. The reflection from the ground is quite visible mostly due to the so-called double bounce effect.
Figure 2. The Remingstorp forest (left) and at right a cartoon representing the components of a cross range resolution cell: the double bounce (down) and the canopy reflection (up) are clearly indicated.
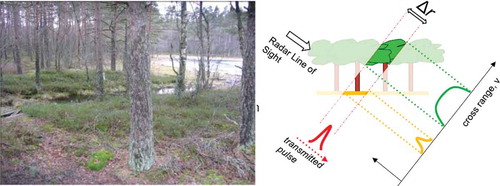
Namely, a vertical tree on a horizontal reflecting terrain acts as a corner reflector, as all the specular reflections plane-tree-ground-plane have the same delay correspondent to that at the base of the tree, that then appears as the site of a very strong reflection. In other words, as visible in , most of the reflectivity appears to be ground locked, and only the backscatter from the vegetation appears to be located off ground in the vertical section. Nonetheless, the height of the trees appears to be well distinguishable and well agreeing with the LIDAR data (). This happens if the measured data are back projected to the 3D positions in SAR geometry and the side lobes are then minimized using the so-called Capon spectral estimate. This estimate is equivalent to minimize the extent of the side lobes, whatever could be their cause. In effect, any radar return measured on the airplane at any given time is equivalent to the measurement of one sample of the Fourier spectrum of the across track distribution of the reflectance. Given the N spectral measurements correspondent to the N passes, one should anti-transform to get the across track reflectivity. The anti-transformation is subject to side lobes, if carried out using Fourier techniques, due to the sampling and the truncation of the spectral measurements.
Figure 3. A vertical section from the Capon tomographical spectra of a transect of the Remningstorp forest; channels HH and HV.
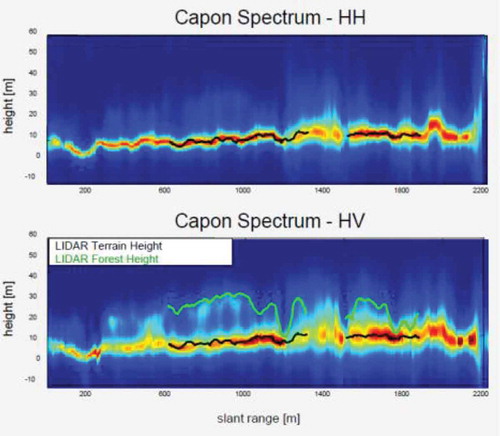
The side lobes are minimized if the Capon technique is used to anti-transform. Notice that full polarimetry was used for the campaign as indeed the different polarimetric channels behave differently: the ground reflections are more visible in the HH polarization, whereas the random directions of the reflecting branches of the trees made the canopy more visible in the HV channel. However, ground reflections appear also in this channel, correspondent to the airplane branches (where the polarization changes from H to V or vice versa) - ground airplane reflections.
The campaign results convinced of the opportunity of another campaign to study boreal forests, this time in the site of Krycklan, where the terrain was also sloping so that the double bounces would be avoided. It was also decided to use a racetrack path for the plane to be able to see the same forest in the near and the far range and also from left and from right and also in P as well as in L band. The results of the tomographic part of this campaign are summarized in Tebaldini and Rocca (Citation2012).
5. Airborne experiments on a tropical forest
It was then decided to carry out an experimental campaign in French Guyana, using this time a French airplane operated by ONERA (Dubois-Fernandez et al. Citation2010, Citation2012; Minh et al. Citation2014). Again 6 passages were carried out, this time along vertically spaced flight lines, thus reducing the change with the range of the width of the across track synthetic antenna.
A result of the campaign is visible in . At right we see the four layers in which the 60 m tall forest has been split and a crossing CO2 flux tower (imaged at left), Guyaflux, as it is seen in the four layers. The red pixel corresponds to the tower and also the path is quite visible leading to the antenna hut, under the vegetation. The vertical sections for different layer heights are visible in . What was most relevant in this campaign has been the relation found between the measured AGB and the layers reflectivity, shown in (Albinet et al. Citation2012; Tong Minh Dinh et al. Citation2013, Minh et al. Citation2015).
Figure 4. Ground (down) and canopy (up) heights.
Figure 5. The Guyaflux tower in Paracou (French Guyana) and its trace through the 4 tomographic layers.
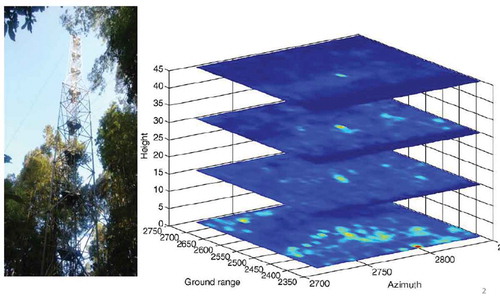
Figure 6. The reflectivities of the 4 layers in French Guyana.
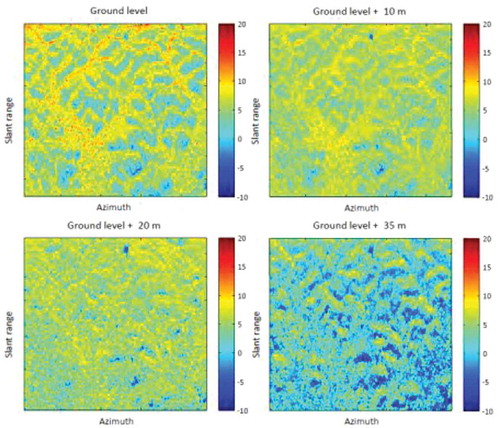
Figure 7. Relation between above ground biomass and reflectivity of each tomographic layer.
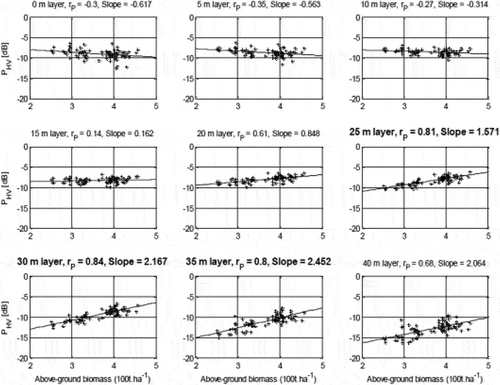
As reasonable, the reflections from the ground layer, even if with the highest amplitude, are not really related to the biomass. In fact, the double bounce is dependent on many local effects like the presence of undergrowth, the terrain slope, the non-verticality of the tree, etc., so that this very strong contribution to the total reflectivity has practically no relation with the AGB. The layers with the best relation with the biomass appear to be the intermediate ones, right within the vegetation thickness. Here the relation is quite satisfying, and a good estimate of the ABG can be found. One likely important explanation for this is that the largest trees substantially control forest AGB.
6. The BIOMASS satellite and the tower experiment
Once it was established that the AGB could be recovered using tomography, then the satellite tool to globalize the survey had to investigate. The use of P band is mandatory, to be able to penetrate down to the ground even in the tallest tropical forests. But two basic problems appear: the first is the available bandwidth in P band, allowed by ITC international rules, that limits it to 6 MHz (Heliere et al. Citation2009). This entails limiting the vertical resolution to about 20 m, making it a valid instrument mostly for the tropical forest. Then, the satellite is only able to carry out single passes in a polar sun synchronous orbit. Two new questions appear: the total time needed for the tomographical experiment, correspondent to N − 1 times the interval between two successive passes on the same orbit, and the time of the day to be used for the pass. The revisit time has to be an integer number of days, as it is related to the orbit height and its period. A 3-day revisit was found possible but then, for a total of 7 passes, the target stability had to be tested for a total duration of 18 days. In order to check this stability, and in order to determine the best time of the day, a ground-based tomographical radar experiment was set up in French Guyana (Tong Minh Dinh et al. Citation2013). On the 55-m-tall Guyaflux tower a set of 10 H and 10 V polarized P band antennas was set (, left). The forest was illuminated continuously, and using some of the antennas as transmitters and the others as receivers, a 20-element vertical array was made feasible.
Figure 8. The Tropiscat antenna on the Guyaflux tower, and the tomographic views in the 4 polarimetric channels.
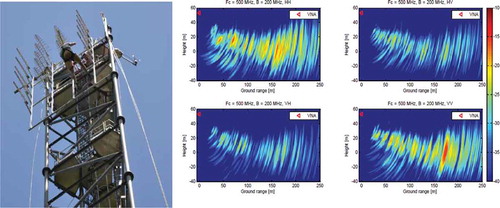
Every 15 minutes the targets were irradiated and their returns recorded. The vertical array allowed to separate the forest along the vertical axis (, right) (Tong Minh Dinh et al. Citation2013). It was also possible to check the long-term stability of the targets (visible in ) and also the daily change of the reflectivity (Minh et al. Citation2015).
Figure 9. 17 days coherence of the tomographic data shown in Figure 8.
The best time for the overpass was found to be before the dawn breezes, at 6.30 AM. Finally, it was possible, combining the data gathered with the airborne experiment and their temporal stability recovered with the tower experiment, to simulate the outcome of the biomass satellite on a tropical forest and to check that indeed AGB could be well estimated, notwithstanding the severe smoothing due to the limited bandwidth available.
7. The L band tomographical experiment: SAOCOM companion
A higher frequency, namely L band at 1.2 GHz, is better fit to investigate the boreal forests. The lower height of the forest allows the use of a higher frequency that otherwise, in the case of the tropical forest, would not be able to systematically penetrate to the bottom. However, the branches that make the targets are now thinner, and thus less stable with time. The tomographic experiments have to be carried out in zero time.
The available bandwidth in L band is larger and a much better spatial resolution in the 3 dimensions can be gained. The solution found in this case was a bistatic experiment, using as illuminator one of the two Argentinean satellites SAOCOM, in L band, which should be orbited in 2017–18. Then, a third satellite, receiving only, named SAOCOM CS (companion) (Gebert et al. Citation2014), has been designed. It would be receiving returns from one of the SAOCOM satellites, measuring at any time one spectral component of the vertical distribution of the forest reflectivity, with zero time delay. So, the whole spectrum of the vertical reflectivity could be progressively determined and the vertical as well as the horizontal averaged square value of the reflectivity could be estimated.
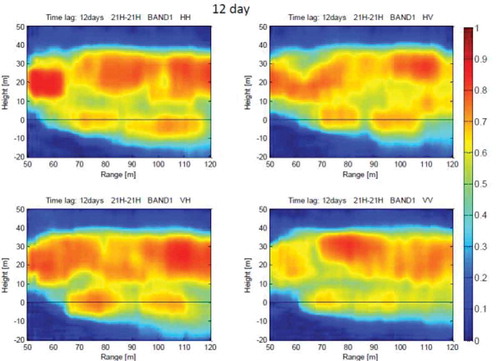
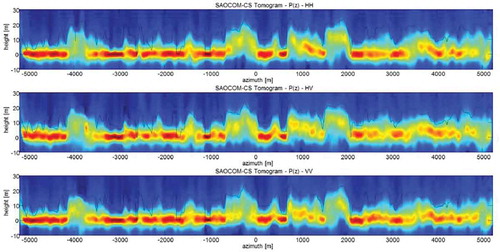
The finalization of the satellite will be decided in 2016. Meanwhile, experiments in L band over boreal and tropical forests too have been organized in Africa as well as in French Guyana, in order to identify the possibilities of such a system. The outcome looks quite favourable, even for the tropical forests, where the ground will be visible not continuously, but in patches. Then, the ground level would be interpolated extending its estimate to those areas where it becomes invisible, similarly to what is done for LIDAR surveys. Favourable simulations of the behaviour of SAOCOM CS in the case of a boreal forest are shown in and .
Figure 10. Simulation of the SAOCOM CS results: LIDAR (top) and tomographic (bottom) vegetation heights.
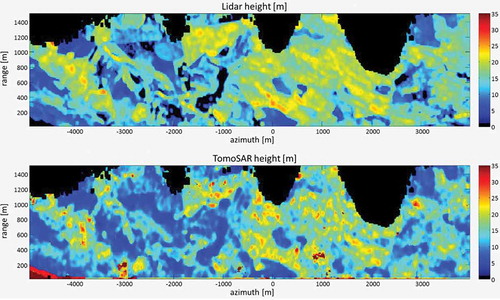
Figure 11. Simulation of the SAOCOM CS results: a transect in the three polarimetric channels.
8. Glaciers
Glaciers are further targets that could be of interest for tomographical applications. Microwave radiations penetrate dry snow and ice, as sounder data prove very well. The advantage of SAR tomographic experiments stays in the horizontal resolution that is much higher than that reachable with sounders. In order to measure the possible results, after preliminary tests in Greenland (Banda et al. Citation2013), a survey was carried out over the Mittelbergferner glacier in Austria (), to check the possibilities of the methodology (Tebaldini et al. Citation2015a).
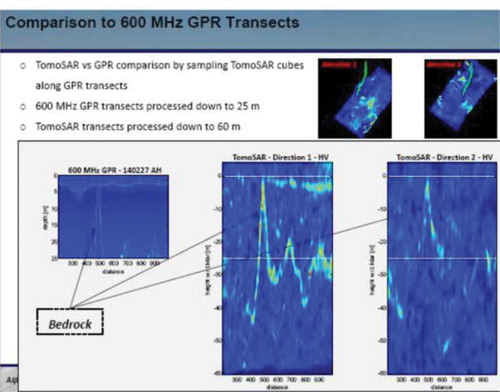
A general-purpose airplane, namely a CASA 212C, was used to carry an L band radar manufactured by Metasensing (Meta and Trampuz Citation2010). The glacier () is at a height of 3570–2250 m, has a length of about 6 km, and a surface of about 9.9 km2. The noticeable height made it necessary to fly at a low height (about 1000 m) above the target. Further, the neighbouring mountains induced strong wind gusts that made quite difficult to the pilot to maintain a straight flight path. Hence, in no way was it feasible to control the flight path with the precision requested. The decision was then taken of a flying on a race track course around the glacier, but increasing the total number of rounds to 20 so that the across track sampling of the tomographic antenna, even if random, was very likely to be dense enough to allow a good interpolation of the reflected field on the desired positions. Indeed, out of 20 passages, 15 were chosen and the data that could be measured following 7 hypothetical flight lines were interpolated from all the available data. The results were quite favourable, in that it was possible to check a penetration into the glacier up to depths of the order of 60–70 m reaching at times the bedrock. Further, a comparison with a ground penetrating Radar survey, carried out at the same time, allowed to control the results, as visible from .
Figure 12. The Mittelbergferner glacier (Austrian Alps).
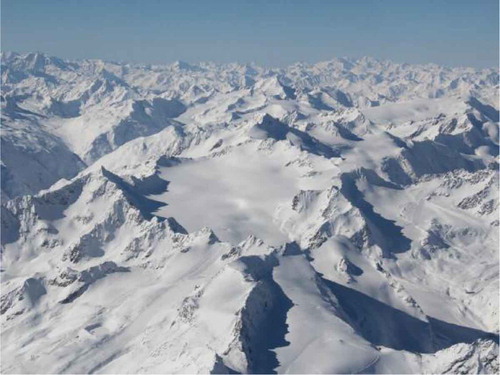
Figure 13. Tomographic results of the two airborne passes (right) compared with the 600MHz GPR data (left).
This experiment allowed to appreciate the SAOCOM CS potential to monitor glaciers all around the world up to a quite noticeable depth. However, this does not entail the possibility of monitoring their motion coherently, as only the vertical distribution of the mean square reflectivity would be measured, and this only in the hypothesis of no significant temporal variations. This would render uncertain the measurement of the change of the glaciers speed with the depth.
9. Conclusions
The experiment and the campaigns carried out up to now, sponsored by the European Space Agency, have demonstrated the advantages of microwave tomography in P and L bands to investigate tropical and boreal forests, respectively, and it will be possible to estimate the AGB with good precision. In the case of glaciers, the use of L band radiations will allow penetration and, in the case of stationarity of the 3D structure, it will allow its separation in multiple layers.
Disclosure statement
No potential conflict of interest was reported by the authors.
References
- C. Albinet, P. Borderies, T. Koleck, F. Rocca, S. Tebaldini, L. Villard, T. Le Toan, A. Hamadi, and D. Ho Tong Minh. 2012. “Tropiscat: A Ground Based Polarimetric Scatterometer Experiment in Tropical Forests.” Selected Topics in Applied Earth Observations and Remote Sensing, IEEE Journal of PP (99): 1–7.
- Bamler, R., and P. Hartl. 1998. “Synthetic Aperture Radar Interferometry.” Inverse Problems 14: R1– R54. doi:10.1088/0266-5611/14/4/001.
- Banda, F., S. Tebaldini, F. Rocca, and J. Dall. 2013. “Tomographic SAR Analysis of Subsurface Ice Structure in Greenland: First Results.” In Geoscience and Remote Sensing Symposium (IGARSS), 2013 IEEE International.
- Cloude, S., and K. Papathanassiou. 1998. “Polarimetric SAR Interferometry.” IEEE Transactions on Geoscience and Remote Sensing 36 (5, Sep): 1551–1565. doi:10.1109/36.718859.
- Dubois-Fernandez, P., H. Oriot, C. Coulombeix, H. Cantalloube, O. Ruault Du Plessis, T. L. Toan, S. Daniel, et al. 2010. “Tropisar: Exploring the Temporal Behavior of P-Band SAR Data,” In Geoscience and Remote Sensing Symposium (IGARSS), 2010 IEEE International, July, 1319–1322.
- Dubois-Fernandez, P., T. L. Toan, S. Daniel, H. Oriot, J. Chave, L. Blanc, L. Villard, M. Davidson, and M. Petit. 2012. “The Tropisar Airborne Campaign in French Guyana: Objectives, Description, and Observed Temporal Behavior of the Backscatter Signal.” Geoscience and Remote Sensing, IEEE Transactions on 50 (8): 3228–3241.
- Frey, O., and E. Meier. 2011. “Analyzing Tomographic SAR Data of a Forest with respect to Frequency, Polarization, and Focusing Technique.” IEEE Transactions on Geoscience and Remote Sensing 49 (10, October): 3648–3659. doi:10.1109/TGRS.2011.2125972.
- Gebert, N., B. Carnicero Dominguez, M. W. J. Davidson, M. Diaz Martin, and P. Silvestrin. 2014. “SAOCOM-CS - A Passive Companion to SAOCOM for Single-pass L-Band SAR Interferometry EUSAR 2014.” Proceedings of 10th European Conference on Synthetic Aperture Radar.
- Guarnieri, A. M., and S. Tebaldini. 2008. “On the Exploitation of Target Statistics for SAR Interferometry Applications.” IEEE Transactions on Geoscience and Remote Sensing 46 (11, Nov): 3436–3443. doi:10.1109/TGRS.2008.2001756.
- Heliere, F., C. C. Lin, F. Fois, M. Davidson, A. Thompson, and P. Bensi. 2009. “BIOMASS: A P-band SAR Earth Explorer Core Mission Candidate.” In Radar Conference, 2009 IEEE, 1–6.
- Hensley, S., S. Oveisgharan, S. Saatchi, M. Simard, R. Ahmed, and Z. Haddad. 2014. “An Error Model for Biomass Estimates Derived From Polarimetric Radar Backscatter.” IEEE Transactions on Geoscience and Remote Sensing 52 (7): 4065–4082. doi:10.1109/TGRS.2013.2279400.
- Meta, A., and C. Trampuz. 2010. “Metasensing Compact, High Resolution Interferometric SAR Sensor for Commercial and Scientific Applications.” In Radar Conference (EuRAD), 2010 European, 30 2010-oct. 1, 21–24.
- Minh, D., T. L. Toan, F. Rocca, S. Tebaldini, M. d’Alessandro, and L. Villard. 2014. “Relating P-Band Synthetic Aperture Radar Tomography to Tropical Forest Biomass.” IEEE Transactions on Geoscience and Remote Sensing 52 (2): 967–979. doi:10.1109/TGRS.2013.2246170.
- Minh, D. H. T., S. Tebaldini, F. Rocca, and T. Le Toan. 2015. “The Impact of Temporal Decorrelation on BIOMASS Tomography of Tropical Forests.” IEEE Geoscience and Remote Sensing Letters 12 (6): 1297–1301. doi:10.1109/LGRS.2015.2394235.
- Nannini, M., R. Scheiber, R. Horn, and A. Moreira. 2012. “First 3-D Reconstructions of Targets Hidden beneath Foliage by Means of Polarimetric SAR Tomography.” IEEE Geoscience and Remote Sensing Letters 9 (1, Jan): 60–64. doi:10.1109/LGRS.2011.2160329.
- Papathanassiou, K., and S. Cloude. 2001. “Single-Baseline Polarimetric SAR Interferometry.” IEEE Transactions on Geoscience and Remote Sensing 39 (11, Nov): 2352–2363. doi:10.1109/36.964971.
- Pasquali, P., C. Prati, F. Rocca, M. Seymour, J. Fortuny, E. Ohlmer, and A. J. Sieber. 1995. “A 3-D SAR Experiment with EMSL Data, Geoscience and Remote Sensing Symposium, 1995.” Igarss ‘95 1: 784–786.
- Reigber, A., and A. Moreira. 2000. “First Demonstration of Airborne SAR Tomography Using Multi-Baseline L-Band Data.” IEEE Transactions on Geoscience and Remote Sensing 38 (Sep): 2142–2152. doi:10.1109/36.868873.
- Reigber, A., P. Prats, and J. J. Mallorqui. 2006. “Refined Estimation of Time Varying Baseline Errors in Airborne SAR Interferometry.” IEEE Geoscience and Remote Sensing Letters 3 (1, Jan): 145–149. doi:10.1109/LGRS.2005.860482.
- Soja, M. J., H. J. Persson, and L. M. H. Ulander. 2015. “Estimation of Forest Biomass From Two-Level Model Inversion of Single-Pass InSAR Data.” IEEE Transactions on Geoscience and Remote Sensing 53 (9): 5083–5099. doi:10.1109/TGRS.2015.2417205.
- Tebaldini, S. 2009. “Algebraic Synthesis of Forest Scenarios from Multi-Baseline Polinsar Data.” IEEE Transactions on Geoscience and Remote Sensing 47 (12, Dec): 4132–4142. doi:10.1109/TGRS.2009.2023785.
- Tebaldini, S. 2010. “Single and Multi Polarimetric SAR Tomography of Forested Areas: A Parametric Approach.” IEEE Transactions on Geoscience and Remote Sensing 48 (5, May): 2375–2387. doi:10.1109/TGRS.2009.2037748.
- Tebaldini, S., T. Nagler, H. Rott, and A. Heilig. 2015a. “L-Band 3d Imaging of an Alpine Glacier: Results from the Alptomosar Campaign.” In Geoscience and Remote Sensing Symposium (IGARSS), 2015 IEEE International.
- Tebaldini, S., and F. Rocca. 2012. “Multi-Baseline Polarimetric SAR Tomography of a Boreal Forest at P- and L-Bands.” IEEE Transactions on Geoscience and Remote Sensing 50 (1, Jan): 232–246. doi:10.1109/TGRS.2011.2159614.
- Tebaldini, S., F. Rocca, M. Mariotti d’Alessandro, and L. Ferro-Famil. 2015b. “Phase Calibration of Airborne Tomographic SAR Data via Phase Center Double Localization.” Geoscience and Remote Sensing, IEEE Transactions on PP (99): 1–18.
- Tong Minh Dinh, D., S. Tebaldini, F. Rocca, T. Koleck, P. Borderies, C. Albinet, L. Villard, A. Hamadi, and T. L. Toan. 2013. “Ground Based Array for Tomographic Imaging of the Tropical Forest in P-Band.” IEEE Transactions on Geoscience and Remote Sensing 51 (8): 4460–4472. doi:10.1109/TGRS.2013.2246795.