
ABSTRACT
This paper reconstructs the spatial phenomena of Chinese temples in Beijing city during the Republican period (1912–1937). The research that informs the reconstruction is based on a Republican Beijing GIS data set that is focused on the transition of urban culture at that time. Spatial analytical methods based on GIS, including Standard Deviational Ellipse (SDE) and Geographically Weighted Regression (GWR), are used to demonstrate the distribution and change of Chinese temples in the 1920s and 1930s, and explore their interactions with population, industry-commerce, guild and church patterns. Overall, the Chinese temples have declined slightly during the period. The relations between Chinese temples and the selected factors exhibit spatial non-stationary across the city. This study highlights the importance of employing spatial and quantitative methods to yield a better understanding of the religious culture in Republican Beijing. Beijing is one of the top-tier political capitals of the world. Uncovering its historical geography is important to an understanding of the resilience of religion in a time where some religious revival is evident.
1. Introduction
Temples are the main architectural edifices of religious society. There have long been a number of Chinese temples scattered around Beijing city. Affiliated to various religious schools and lineages (e.g. Confucianism, Buddhism, Daoism), these traditional temples have become centres for disseminating religious culture to the general public in the city. There were Taoist and Buddhist shrines in the Inner Court of the Forbidden City during the Qing Dynasty (Yu Citation1984). The Imperial Ancestral Temple and the Imperial Shrine of State were situated to the south of the Forbidden City. These were important centres that linked Heaven, through the person of the Emperor, to Earth through the person of the Empress, and the nation. Symbolically the Hall of Heavenly Purity (associated with the Emperor) was linked to the Palace of Earthly Tranquility (associated with the Empress) by the Hall of Union (Yu Citation1984).
Indeed, temples were important venues for the unfolding of ‘religious continuity from the emperor to the village [that] was the major cause for the cohesion of the empire and this connection ceased to exist with the abdication of the emperor in the early twentieth century’ (Goossaert and Palmer Citation2011). Western religion and commercial ventures had their principle focus in areas conceded to Western powers during the empire. Leading up to the Republican period, several factors may be viewed as having been contributed to the disruption of religious continuity. The main destabilizing force was the ‘large-scale dissent, which could become violent, of supralocal religious movements’ such as ‘Taiping Heavenly Kingdom, Christianity and the Boxers’ (Goossaert and Palmer Citation2011). This, of course, had something to do with the Western presence. The ensuing power struggle and the abdication of the emperor ended the religious continuity represented by the emperor, a figure who was characterized as ‘Son of Heaven’ and was an integral link in the chain ‘subject–priest–temple–emperor–heaven’.
The academic study of Beijing’s temples has been greatly advanced over the past few decades. Naquin (Citation2000) used temples as an entry point to examine Beijing’s varied public arenas, the city’s transformation over five centuries, the social interaction it hosted and its rich cultural imprint. Dong and Lü (Citation2011) studied the temples and inscriptions in the inner city of Beijing, in an attempt to better understand the role played by temples and the temples’ relationship with citizens. Rather than focusing on religious establishments of all persuasions, Goossaert’s (Citation2007) work focused on Taoist temples – examining in particular the professional religious activities of Taoist clerics in Beijing during a period of dramatic modernization. Nevertheless, much of the research on temples in Beijing draws mainly on archival documents and field reports with limited application of any spatial and quantitative methods.
The burgeoning of GIS technique and its ever-widening application over the past few years has greatly impacted on scholarship in the fields of history, Chinese religious studies and other branches of the humanities. Historical GIS and the application of its approach have become an increasingly attractive area of research. The GIS approach is one that makes use of the spatial, attributional and temporal components of the data to look explicitly at how spatial patterns vary across the Earth’s surface (Gregory and Ell Citation2007). The use of GIS not only allows large amounts of data from different sources to be integrated but also lends itself to quantitative analysis. Regarding the application of GIS in Chinese religious studies, there have been some good examples. Taiwan Dharma Drum Buddhist College has launched a Buddhist GIS project that integrates temporal and spatial information about Buddhism in Taiwan, especially the spread and distribution of Buddhist temples and centres of worship.Footnote1 The University of Arizona has recently proposed a project that envisages using GIS to build a searchable database of Buddhist monasteries in China.Footnote2 Additionally, the China Data Centre (CDC) at University of Michigan has collected and integrated official religious data extracted from the 2004 China Economic Census and the ZIP maps of Mainland China. However, while these projects have focused on the visualization of religious data, the application of advanced spatial analytical-statistical methods that not only focus on spatial dimension but also quantitative analysis has not been sufficiently explored in the study of urban religious and cultural phenomenon.
The major objective of the paper is to provide a clear visual depiction of the spatial pattern and change of Chinese temples in Beijing in the republican period, and offer a holistic view of Chinese temples in the city by showing their relationships with population, industry-commerce, church and guild patterns through the application of spatial analytical-statistical methods. Three assumptions will be tested in this research: (1) the Chinese temples become less concentrated as time passes, (2) the relations between Chinese temples and the selected factors exhibit spatial non-stationary in the city and (3) there is north–south spatial distinction in the pattern of Chinese temples.
In this article, Section 2 is an introduction of the study area. Section 3 describes the sources of data used in this study, and briefly reviews the analytical tools chosen to study the religious cultural phenomena. Section 4 presents the spatial patterns of Chinese temples in Beijing in the 1920s and 1930s (the middle segment of the Republican period), and meanwhile demonstrates the relationships between Chinese temples and other variables such as population size, and institutions like industrial-commercial organizations, guilds and churches. The last section is a summary of major findings of our research on Beijing’s temples.
2. Study area
Republican Beijing refers to Beijing city from 1912 to 1937. Beijing was renamed as Beiping during the period between 1928 and 1949 when the Nationalist government relocated the nation’s capital to Nanjing. The study area is Beijing city, not including the suburban districts and countryside. As shown in , the north, appearing as a square-like form, is the inner city (referred to here as Inside). The south city, that appears to be rectangular, is the outer city (referred to here as Outside). The imperial palace, Forbidden City is located in the very centre of the inner city (District Inside No.6) and the Temple of Heaven, a large architectural complex reserved for imperial use is in the outer city (District Outside No.5). The residents in the city had been divided into two categories since the Qing dynasty: Manchu Bannermen residing in the inner city and Han people living in the outer city. This pattern was maintained until 1949 when the People’s Republic of China was established. The Bannermen did not engage in business, merchants were to be found only in the outer city where they had formed into a number of guilds (Dong and Lü Citation2011).
Figure 1. Boundaries of the 11 police districts of Republican Beijing (1935).
In the analysis of Chinese temples in Republican Beijing, we attempt to reveal the spatial patterns of Chinese temples in different periods and explore their correlations with population, industry-commerce, guild and church patterns. The research enquiries are addressed based on the four-indicator theory in the study of Chinese temples in the city that has been proposed by Eberhard (Citation1964). It was argued that the count of temples could be an indication of economic development, population change, urbanization and religious preference in the region. Lai (Citation2012) has applied this approach to study the correlations of the Daoist temples with economy, population and urban development in Guangzhou city and its eight surrounding counties during the Song dynasty. Nevertheless, both of the articles basically investigated the issues through qualitative narratives; quantitative methods were not applied to examine the relationships among the variables.
As an important aspect of social life, Chinese temples in Republican Beijing are supposed to be interacting with other social aspects such as economy, population, urban development and so on. These relationships should be reflexed by their spatial locations to some extent. A commonly used analytical method for modelling relationships among variables is regression models which assume that strengths and directions of relationships are consistent throughout the study area. However, spatial non-stationary should be considered in the analysis of spatial data, especially in the case of Republican Beijing. Given the spatial characteristic of the layout of Beijing as a former imperial capital as well as the residential segregation of population, we assume that there is spatial non-stationary in the data and that the relationships between Chinese temples and selected factors vary over space.
3. Data and methods
3.1. Sources
The data used in this study were from our Republican Beijing GIS data set that is actually an outcome of the research project entitled ‘Beijing in Transition: A Historical GIS Study of Urban Cultures, 1912–1937’. There are six cultural spheres: urban morphology, market culture, education, public health, legal culture and religious culture. The data were mainly collected from Beijing Municipal Archive. These data were in various formats such as official census data, statistics, registries, private surveys, guidebooks, maps, accounts, books and so on. In terms of these six cultural spheres, nearly 300 shape file layers of GIS have been built. The data set is open to the public for academic purposes and is accessible on the internet.Footnote3
When using 20 or 11 police districts to conduct spatial analysis, it would be like facing the problem of lacking degree of freedom in statistics. In order to have a higher spatial resolution and provide larger observations, the 20 police districts were reconstructed into 80 subdistricts according to main streets and regular polygons on the base map. Meanwhile, a novice approach was adopted to estimate the population in smaller areal units under each police district (Wong, So, and Zhang Citation2012). The main idea of this approach is to identify the buildings that were not for residential use and calculate the population density of each police district excluding those non-residential buildings. This population density level was used to estimate population for each residential area or polygon. The populations of 80 subdistricts reconstructed can be derived from aggregating population estimates from residential units. Regarding the reasonableness and limitation of this approach, they have been discussed in the first authors’ other publications, and the readers are invited to read them for more details (Wong, So, and Zhang Citation2012; Zhang et al. Citation2012).
Data on Chinese temples, population, industrial and commercial buildings, guilds and churches were mainly derived from archival materials. For instance, the temple data are derived from The Historical Materials of Temples in Beijing compiled by Beijing Municipal Archive in 1997, which included temple registrations of 1928, 1936 and 1947. The 1928 (638 entries) and 1936 (576 entries) temple data are utilized in this study. Temples located in the city are found to be Buddhist and Daoist temples and these are the Chinese temples referred to in this study. The population data is from the Statistical Graph of Registered Residences of Beiping Police Department published by the Beiping Police Department in 1937. The report contains household and demographic data for the 11 police districts. The industrial-commercial organization data (3191 entries) is derived from A Summary of Commerce and Industry in Beiping published by Beijing Municipal Bureau of Social Affairs in 1932, containing general information about commercial and industrial organizations such as their names and addresses. The 1929 guild data (499 entries) come from The Tour Guide of Beiping compiled by Beiping Democratic Socialist, which provided information about geography, politics, economic matters and local customs of Beiping.
3.2. SDE
The technique we adopted in this study to explore spatial distributions of Chinese temples in different periods is the SDE (Furfey Citation1927). This technique has been used to analyse the spatial distributions of various phenomena in urban studies. For example, Levine, Kim, and Nitz (Citation1995a, Citation1995b) used SDE to describe spatial patterns of Honolulu motor vehicle accidents in 1990. Wong (Citation1999, Citation2005) applied SDE to reveal the spatial characteristics of different population groups. Johnson and Wilson (Citation2009) used SDE to examine the relationship between the spatial distribution of vulnerable populations, satellite-detected urban heat island (UHI) and heat-related mortality distributions in Philadelphia, PA. It has been shown that SDE is simple and easy to implement in GIS software. More importantly, this kind of technique is effective in exploring the spatial distributions of geographic events, especially the patterns of point features. It is of course a good choice of use of SDE in the study of spatial patterns of Chinese temples in different times.
To calculate the SDE of a point set, we can follow the four steps shown as below (Wong and Lee Citation2005).
First, calculate the mean centre of the point set .
Second, transform the coordinates of each point into a discrete metric pace referenced from the mean centre.
Third, Calculate the angle of rotation, such that
Finally, with acquired from the last step, the deviation along the x- and y-axes can be calculated respectively.
and
When running SDE on all the temples of Beijing city as a whole, this approach is inherently crippled; it is not suitable for uncovering any change in the spatial pattern of Chinese temples that might have occurred within a short eight-year period. One possible solution to this problem is to group the temples and compute the SDE separately so that it can reveal change that occurred on a local scale. Since many of these large architectural compounds like the Forbidden City and the Temple of Heaven are concentrated in the police districts of Inner No.6 and Outside No.5, the boundaries of the 11 police districts would be a reasonable and effective way of grouping them. The case field in Arc/GIS software also makes it easy to implement.
3.3. Geographically weighted regression (GWR)
GWR that extends an ordinary linear regression (OLR) model is a useful tool to examine the spatial non-stationary in the relationships between variables. GWR has been applied in a wide range of research areas in the last few years. One of the most popular applications is in the landscape-use-related topics. For instance, Ogneva-Himmelberger, Pearsall, and Rakshi (Citation2009) employed GWR to model the relationships between different indicators of income and land use. Tu (Citation2011) used GWR to evaluate how relationship between land use and water quality varies over space. GWR can serve as a useful tool in the investigation of regional economic development and public health issues as well. Li and Wei (Citation2010) applied GWR to understand the regional economic disparity within China. Grillet et al. Fortin (Citation2010) used GWR to determine the spatial pattern of malaria incidence and persistence in northeastern Venezuela. In the empirical studies, GWR has shown its capacity for modelling spatially varying relationships between variables and has frequently offered better results than those offered by a global model. Apparently, the GWR technique would be useful in the exploration of relationships between Chinese temples and the selected variables that might be varying across the city.
An ordinary linear regression model can be expressed as
where is the estimated value of the dependent variable for observation i,
is the intercept,
is the parameter estimate for variable k,
is the value of the kth variable for i and
is the error term.
GWR extends the ordinary linear regression model by allowing the parameters to be estimated by a weighted least squares procedure. GWR equation can be expressed as
where captures the coordinate location of i. The assumption is that observations nearby one another have a greater influence on one another’s parameter estimates than observations further apart. The weighting function can be stated using the exponential distance decay form:
where is the weight of observation j for observation i,
is the distance between observation i and j, b is the kernel bandwidth. In this formula, the calculation of kernel bandwidth is important. We can choose both fixed and adaptive kernel bandwidth. If the fixed kernel bandwidth is adopted, it is likely to face the problem of having great estimated variance in the locations where data are sparse and small and ignoring the subtle difference in the locations where data are dense and large. We choose adaptive kernel bandwidth in our study because it can avoid such problem by automatically adjusting bandwidths within the study area. Bandwidths would be larger in the data-sparse areas and smaller in the data-dense areas. The optimal bandwidth was determined by minimizing the corrected Akaike Information Criterion (AICc) as described by Fortheringham et al. (Citation2002).
4. Results and discussion
4.1. Spatial distributions of Chinese temples in the 1920s and 1930s
Using the data on Chinese temples in 1928 and 1936, we can compute a deviational ellipse for temples of each police district for the two periods. shows the spatial distributions of temples in 1928 and 1936. Results of the SDE measures for Chinese temples in these two periods are shown in , while the corresponding ellipses are plotted in . The mean centres of the Chinese temples are also computed and their locations are identified in .
Table 1. Standard deviational ellipse measures for Chinese temples in the 1920s and 1930s.
Figure 2. Spatial distributions of Chinese temples in 1928 and 1936.
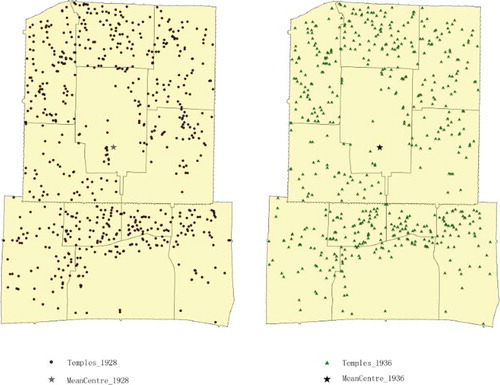
Figure 3. Standard deviational ellipses for Chinese temples in 1928 and 1936.
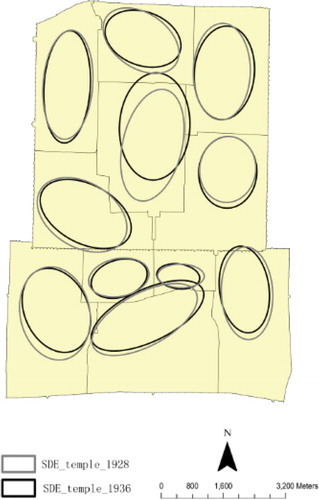
The geographical distributions of Chinese temples in the Republican period exhibit several different patterns across the city. The Chinese temples in District Inside No.2, and No.5, and Outside No.5 were oriented in a northwest–southeast direction. Districts of Inside No. 6 and Outside No. 2, No.3 and No. 5 exhibit a clear southwest–northeast orientation. Districts of Inside No. 1, 3 and 4 were close to be oriented in a south–north direction and District Outside No. 2 exhibits an east–west orientation. From 1928 to 1936, the spatial pattern of temples for each police district did not change much except district Inside No.6. As seen in and , the standard deviation along the y-axis for district Inside No.6 was larger in the 1920s and along the x-axis was larger in the 1930s. The spatial centre moved northward and eastward with the passage of time. The spatial centres of Chinese temples in the city for the two periods were both located in the heart of the imperial city, coinciding with the residence of the ‘Son of Heaven’ until the abdication of Emperor Pu Yi in 1912.
4.2. Relationships between Chinese temples and factors of population, industry-economy, church and guild
4.2.1. Relationships between Chinese temples and related factors obtained by OLS
The correlations between Chinese temples and other factors, such as population, industrial-commercial establishments, churches and guilds, obtained from OLS model are shown in . The count of Chinese temples for each sub-district is treated as the dependant variable and population size as well as counts of industrial-commercial establishments, churches and guilds in each sub-district are treated as independent variables in the model. The results suggest that the presence of Chinese temples is positively related to population sizes, the presence of industrial-commercial establishments, churches and guilds. We see that only the relationship with population is statistically significant at the 95% confidence level.
Table 2. Results of global regression model.
The R2 of the global model is 41.58%, and the adjusted R2 is 38.46%. This indicates that the population, industry-commerce, church and guild factors only explain 38.46% (less than 50%) of the variance in Chinese temples, which is relatively low. While a uniform relationship between the abundance of Chinese temples and other factors did not exist across all sub-districts, relationships of varying degree may still be present. Thus, we are expecting to use GWR to show if such relationships exist and how they vary across observations. The results are shown and discussed in the following sections.
4.2.2. Comparison of model performance between OLS and GWR
In this study, R2 and AICc values of OLS and GWR are compared and used to evaluate whether GWR model has better model performance than the corresponding OLS model. AICc is a measurement of model performance that is useful for comparing different regression models. A lower AICc value indicates a closer approximation of the model to reality (Wang, Ni, and Tenhunen Citation2005). A drop of AIC value by 3 or larger indicates that the model with the lower AICc performs better (Fotheringham, Charlton, and Brunsdon Citation1997).
shows the global R2 of GWR with comparison of R2 of OLS for the dependent variable (i.e. Chinese temples) and independent variables (i.e. population, industrial-commercial establishments, churches and guilds). We see that GWR performs better than OLS, characterized by a significant improvement in R2 value as well as AICc value of GWR. The R2 value is increased from 41.58% to 75.45%, and the AIC is dropped from 460.13 to 447.34. The local model enhances the relationships observed by the global model, meaning that the performance of the local model represents a complex mix of the model’s overall performance and the relative degree of non-stationarity. Thus, in our study of relationships between Chinese temples and related factors in Republican Beijing, the local model is regarded to be performing better than the global model.
Table 3. Comparison of coefficient of determination (R2) between OLS and GWR models.
In addition to R2 values and AICc values, it is recommended to compare the ability to deal with spatial autocorrelation between OLS and GWR models. Autocorrelation is an ecological data expression for the lack of independence between pairs of observations at given distances apart from each other, both in time and space (Legendre Citation1993). Statistically significant spatial autocorrelation in an OLS model suggests that the model does not satisfy the assumption of residual independence and random distribution in regression models; thus, results from the model are unreliable. It almost always indicates some important variables that are not included in the model and the residuals may provide clues about the missing variables (Clark Citation2007).
Moran indices (Moran’s I) of residuals of OLS and GWR models were computed to evaluate their abilities to deal with spatial autocorrelation. The results are shown in . Significant positive spatial autocorrelation is found for the OLS model (Moran’s I = 0.137452, p < 0.01), while the corresponding GWR model has no significant spatial autocorrelation in its residuals (Moran’s I = −0.016046, p = 0.930239). These results indicate that the OLS model is less effective for identifying the relationships between Chinese temples and the related factors due to fact that the spatial dependences in those factors are not well considered and the assumption of residual independence is not satisfied. GWR improves the reliabilities of the relationships by reducing the spatial autocorrelation in residuals.
Table 4. Comparison of Moran’s I of the residuals from OLS and GWR models.
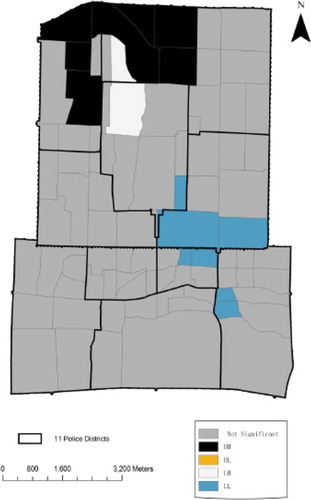
The spatial autocorrelations of residuals from OLS might be caused by the spatial distributions of Chinese temples. The results of the global Moran’s I statistics and local indicators of spatial association (LISA) analysis are illustrated in . As shown in , significant positive spatial autocorrelations are found for Chinese temples (Moran’s I = 0.160142, p = 0.000005). The cluster maps show several significant spatial clusters and clear spatial distribution patterns of the clusters. The high–high clusters, which indicate that high counts of Chinese temples are surrounded by high counts, were concentrated in the sub-districts of Inside No.4 and 5. Low–low clusters, meaning that low values are surrounded by low values, were largely located in the sub-districts of Inside No. 1 and Outside No.1. A low–high cluster, the area with the mix of low and high counts of Chinese temples, was found in the adjacent sub-districts of Inside No.5 and 6.
Figure 4. Cluster map of Chinese temples in 1936.
The results shown earlier indicate that the GWR model performs better than OLS model in our case and the ability to handle spatial autocorrelation can be another measure to evaluate the efficiency of models. However, Tu and Xia (Citation2008) suggested that the application of GWR requires a careful use of diagnostic parameters such as Moran’s I statistics. If an OLS model has spatial autocorrelation problem, GWR can help reduce it. Otherwise, an application of GWR may increase spatial autocorrelation.
4.2.3. Spatial varying relationships between Chinese temples and related factors captured by GWR
With the help of the visualization tools of GIS, we are able to map out the spatial varying relationships between Chinese temples and variables of population, industry-commerce, church and guild. shows the spatial distribution of the population parameter estimates. From the result of OLS model, we see that a significant positive correlation exists between population and temples. As shown in the result of GWR model, most areas of the city still had positive correlations, indicating that higher count of Chinese temples was related to higher count of population. There were a few districts in the southeast having negative correlations, which indicates that higher count of Chinese temples was related to lower count of population. However, the absolute values of the population parameter estimates were very small in both cases, which indicates that their impacts on Chinese temples in the city were small.
Figure 5. (a–e) Parameter estimates of population, industry-commerce, church, guild and R2.
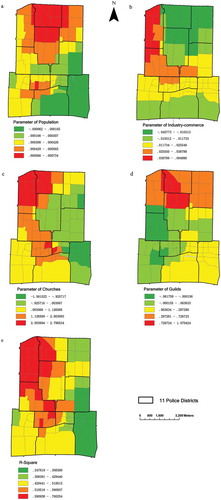
shows the spatial distribution of the commerce-industry parameter estimates. Industry-commerce was positively correlated with Chinese temples in the OLS model. However, the GWR model shows significant negative correlations clustered in the northern part of the inner city. The northern part of the city had larger commerce-industry parameter estimates while the southern part had lower parameter estimates. Significant positive correlations are observed in the western side of north city. The southern part of south city as well as some areas around imperial city had lowest parameter estimates. Industry-commerce seemed to have greater impacts on Chinese temples in the north than in the south.
shows the spatial distribution of church parameter estimates. Based on the results of OLS model, we see that churches had a positive correlation with Chinese temples, indicating that higher count of Chinese temples was related to higher count of churches. Similarly, negative correlations are also observed for the eastern side of the city, especially the southeast corner where low value clusters were located, from the GWR model. High value clusters are observed in the northwestern part of the Inner City and central area of the Outer City, indicating that churches had greatest impacts on Chinese temples in these areas.
shows the spatial distribution of the guild parameter estimates. Guilds had a positive correlation with Chinese temples in the OLS model. However, we see that the northern part of the city had larger guild parameter estimates and the south-eastern part had medium parameter estimates in the result of GWR model. The central to southwest had the lowest parameter estimates. Negative correlations are mainly observed in the central-western areas of the city.
shows the spatial distribution of the R2. The R2 value ranges from 0.247819 to 0.700254. The largest parameter estimates are observed in the northwestern section of the city, indicating that the relationships between Chinese temples and the selected variables are much better captured by GWR in the northwest than the other parts of the city. The relatively poor performance of GWR in the eastern side of the city may indicate that some factors important to the existence and development of Chinese temples in this part are not included in the model. Whether there are some more factors that are important to the development of Chinese temples requires further investigations.
4.3. Discussion
As shown by SDE, the 1928 and 1936 temples for each police district exhibit very similar spatial patterns in general. A more complete picture of Chinese temples could have been reconstructed and dramatic change might have been observed if the data before the year of 1928, when the Guomingdang regime was established, were available. Despite the limitations, with the quantitative analysis and visualization of data available for different periods, the trend of development of Chinese temples in the city could be revealed to some extent and a more in-depth understanding of the pattern of temples could be gleaned.
District Inside No.6 had relatively greater change than the other police districts with the geographical centre of temples moving northward and eastward as time progressed. The city had 638 Chinese temples in 1928, and 576 temples in 1936. Obviously, there was a decrease in the total count of Chinese temples. This trend of declining Chinese religions might be caused by the fact that the Guomingdang government, that had jurisdiction over Beijing at the time, adopted religious policies restricting the development of Chinese traditional religions. It could also be related to the pinnacle of the Chinese Buddhist order, the ‘Son of Heaven’, no longer being resident in the Forbidden City. But even so, Chinese traditional religions were still active in the city and continued to spread throughout civil society as major religions (Xi Citation2006).
In spite of the small impact, population was positively correlated to Chinese temples in most parts of the city, meaning that areas with larger population sizes had more Chinese temples. The investigation of the existence and distribution of Chinese temples in Beijing should include a tracing of the history of those temples. Mostly these temples had been established in Ming or Qing Dynasty; many were located in more suburban areas far away from the city centre. This perhaps explains the phenomenon that there was a relatively high count of Chinese temples in the southeastern corner where the population size was not large.
For the industry-commerce factor, the data captured in this data set represented the newly emerged section of the urban market economy in Republican Beijing. We see that they had the greatest impact on the location of Chinese temples in the western side and northern part of the Inner City. However, in the southern part of the city, belonging to the more traditional and low-end types of economic life, the industry-commerce factor appeared to have a lesser impact on Chinese temples. And it is interesting to observe that guilds had little effect on the locations of Chinese temples (even registering as being slightly negative) in the central part of the Outer City where a number of guilds were located.
Beijing had been the centre for the dialogue between Western and Chinese traditional cultures since the seventeenth and eighteenth centuries. The churches, incorporating missionaries’ residences in addition to being religious locations, are synthesized carriers of various western cultures. From the GWR result, we see that the relationship between churches and Chinese temples was mixed; the western part of the city frequently had a positive relationship and the eastern part had a negative one. This pattern may suggest that the competition between these two types of religious establishments still existed in some areas (e.g. the eastern part) in spite of Western churches having become part of Beijing urban culture in the republican period pursuant to long-term interaction with Chinese traditional culture.
5. Conclusion
In this study, the historical GIS approach, focusing on the spatial dimension as well as quantitative methods, was employed to explore the spatial pattern and change of Chinese temples in Beijing from 1912 to 1937. Based on the data of religious culture derived from the BJGIS, some important findings have been acquired.
The geographical distributions of Chinese temples had similar spatial patterns in the 1920s and 1930s; they were close to being oriented in a north–south direction. The spatial centre moved slightly eastward as time passed. Although there was a decrease in the total count of Chinese temples, Chinese traditional religions continued to play an important role in civil life and were the major faiths. Regarding the relationships between Chinese temples and other socio-economic variables, it is shown that population had little impact on Chinese temples in general. Industry and commerce had a great impact on Chinese temples in the western and northern parts of the Inner City. Could this be viewed as a physical expression of the tension between ‘church’ and commerce that persists in China today as tension between spiritual values and values of commerce? Churches had a strong spatial relationship with Chinese temples all over the city and the negative correlation in the western part may indicate that Western and Chinese religions continued to be in competition in some districts. Alternatively, churches and temples may be seen as gravitating away from profane precincts. The nature of their relationships and how they interacted with each other deserves further investigation. There is the need to plot movements over time against non-geographical data series relating to social conditions such as poverty, mortality, violence, education in the various areas. Additionally narrative data, from diaries maintained in the period, may also yield complementary information that will allow for the depiction of the transformation of religious culture in Republican Beijing – a transformation which our data suggest was one that was characterized by a few important features:
Survival of traditional Chinese religious culture
Introduction of new religious culture
Contestation and co-existence between various religious cultures
Contraction of traditional Chinese religious culture
The application of spatial analytical tools such as SDE and GWR does enhance our understanding of the spatial pattern of Chinese temples and its correlation with other socio-economic variables, proving that spatial analysis can serve as a useful tool in the investigation of religious culture in Republican Beijing. The significance of this study is that it has attempted to socio-historically illuminate the picture of Beijing that has emerged through spatial analysis. Nevertheless, this study of Chinese temples from a spatial perspective uncovers but one aspect of religious culture in republican Beijing. It throws light on how Chinese traditional religions declined and transformed gradually in Republican Beijing. Transformation at such a liminal moment is a complicated process and this needs to be further studied from a broader academic perspective.
The study also provides the opportunity to compare the 1912–1937 GIS maps with a contemporary GIS map. This will allow an invaluable comparison to be made between important moments set a century apart, the first when the old imperial order and spiritual values were crumbling in China and the second when China, with a rising middle class, is taking on an increasingly important geopolitical role and looking anew at the question of spiritual values.
Disclosure statement
No potential conflict of interest was reported by the authors.
Notes
References
- Clark, S. D. 2007. “Estimating Local Car Ownership Models.” Journal of Transport Geography 15: 184–197.
- Dong, X., and M. Lü. 2011. Beijing Neicheng Shimiao Beikezhi 北京內城寺廟碑刻志 [Beijing Temples and Inscriptions]. Beijing: Guojia tushuguan chubanshe.
- Eberhard, W. 1964. “Temple-Building Activities in Medieval and Modern China: An Experimental Study.” Monumenta Serica 23: 267.
- Fotheringham, S. A., M. Charlton, and C. Brunsdon. 1997. “Measuring Spatial Variations in Relationships with Geographically Weighted Regression.” In Recent Developments in Spatial Analysis, edited by Fischer, M. Manfred, and A. Getis. Berlin: Springer.
- Fotheringham, S. A., C. Brunsdon, and M. E. Charlton. 2002. Geographically Weighted Regression, the Analysis of Spatially Varying Relationships. UK: Wiley.
- Furfey, P. H. 1927. “A Note on Lefever’s ‘Standard Deviational Ellipse’.” The American Journal of Sociology 33: 94–98. doi:10.1086/214336.
- Goossaert, V. 2007. The Taosits of Peking 1800–1949, A social History of Urban Clerics. Cambridge: Harvard University Asia Centre.
- Goossaert, V., and D. A. Palmer. 2011. The Religious Question in Modern China. Chicago: Chicago University Press.
- Gregory, I. N., and P. S. Ell. 2007. Historical GIS: Techniques, Methodologies and Scholarship. Cambridge: Cambridge University Press.
- Grillet, M.-E., R. Barrera, J.-E. Martinez, J. Berti, and M.-J. Fortin. 2010. “Disentangling the Effect of Local and Global Spatial Variation on a Mosquito-Borne Infection in a Neotropical Heterogeneous Environment.” American Journal of Tropical Medicine and Hygiene 82 (2): 194–201. doi:10.4269/ajtmh.2010.09-0040.
- Johnson, D. P., and J. S. Wilson. 2009. “The socio-spatial Dynamics of Extreme Urban Heat Events: The Case of Heat-related Deaths in Philadelphia.” Applied Geography 29: 419–434. doi:10.1016/j.apgeog.2008.11.004.
- Lai, C. 2012. “Songdai Diqu Daojiaode Gean Yanjiu——Guangzhou Daoguan, Daotang Ji Daoyuan.” 宋代地區道教的個案研究--廣州道觀、道堂及道院[[A Case Study of Regional Daoism in Song Dynasty--Guangzhou’s Daoist Temples]]. Paper presented in the Modern Chinese Religion: Value Systems in Transformation Part 1: Song-Liao-Jin-Yuan, organized by Centre for East Asian Studies, Chinese University of Hong Kong, Hong Kong. June 25–28.
- Legendre, P. 1993. “Spatial Autocorrelation: Trouble or New Paradigm?” Ecology 74 (6): 1659–1673. doi:10.2307/1939924.
- Levine, N., K. E. Kim, and L. H. Nitz. 1995a. “Spatial Analysis of Honolulu Motor Vehicle Crashes: I. Spatial Patterns.” Accident Analysis & Prevention 27: 663–674. doi:10.1016/0001-4575(95)00017-T.
- Levine, N., K. E. Kim, and L. H. Nitz. 1995b. “Spatial Analysis of Honolulu Motor Vehicle Crashes: II. Zonal Generators.” Accident Analysis & Prevention 27: 675–685. doi:10.1016/0001-4575(95)00018-U.
- Li, Y., and Y. H. D. Wei. 2010. “The Spatial-Temporal Hierarchy of Regional Inequality of China.” Applied Geography 30: 303–316. doi:10.1016/j.apgeog.2009.11.001.
- Naquin, S., 韓書瑞. 2000. Peking – Temples and City Life, 1400–1900. Berkeley: University of California Press.
- Ogneva-Himmelberger, Y., H. Pearsall, and R. Rakshi. 2009. “Concrete Evidence & Geographically Weighted Regression: A Regional Analysis of Wealth and the Land Cover in Massachusetts.” Applied Geography 29 (4): 478–487. doi:10.1016/j.apgeog.2009.03.001.
- Tu, J. 2011. “Spatially Varying Relationships between Land Use and Water Quality across an Urbanization Gradient Explored by Geographically Weighted Regression.” Applied Geography 31 (1): 376–392. doi:10.1016/j.apgeog.2010.08.001.
- Tu, J., and Z.-G. Xia. 2008. “Examining Spatially Varying Relationships between Land Use and Water Quality Using Geographically Weighted Regression I: Model Design and Evaluation.” Science of the Total Environment 407: 358–378. doi:10.1016/j.scitotenv.2008.09.031.
- Wang, Q., N. Jian, and J. Tenhunen. 2005. “Application of a Geographically-Weighted Regression Analysis to Estimate Net Primary Production of Chinese Forest Ecosystems.” Global Ecology and Biogeography 14: 379–393. doi:10.1111/j.1466-822X.2005.00153.x.
- Wong, D. W. 1999. “Geostatistics as Measures of Spatial Segregation.” Urban Geography 20 (7): 635–647. doi:10.2747/0272-3638.20.7.635.
- Wong, D. W. 2005. “Formulating a General Spatial Segregation Measure.” The Professional Geographer 57 (2): 285–294. doi:10.1111/j.0033-0124.2005.00478.x.
- Wong, D. W., B. K. L. So, and P. Zhang. 2012. “Addressing Quality Issues of Historical GIS Data: An Example of Republican Beijing. ” Annals of GIS 18: 17–29. doi:10.1080/19475683.2011.647074.
- Wong, D. W. S., and J. Lee. 2005. Statistical Analysis of Geographic Information with ArcView GIS and ArcGIS. 2nd ed. Hoboken, NJ: John Wiley.
- Xi, W. Y. 2006. “The analysis of the type and structure of Beijing’s Temples in the modern times.” [ Jindai Beijing Simiaode Leixinghe Jiegou Jiexi 近代北京寺廟的類型結構解析]. Studies in World Religions [ Shijie Zongjiao Yanjiu 世界宗教研究]. 1: 34–45.
- Zhang, P., D. W. Wong, B. K. L. So, and H. Lin. 2012. “An Exploratory Spatial Analysis of Western Medical Services in Republican Beijing.” Applied Geography 32: 556–565.
- Yu, Z. 1984. Palaces of the Forbidden City. New York, NY: Viking.