
ABSTRACT
The Nanjishan Wetland National Nature Reserve (NWNNR) encompasses the southern part of Poyang Lake and is the largest wetland reserve on Poyang Lake. Few systematic and specific studies to map the Nanjishan wetland and assess wetland changes have been conducted. Therefore, this paper discusses methods of wetland classification mapping and an analysis of wetland seasonal changes in the flood and dry seasons in the Nanjishan wetland, providing a qualitative description of the causes of seasonal wetland changes. In this paper, two remote sensing images (Gaofen One [GF-1]) typical of the flood and dry seasons were collected and preprocessed. Decision trees (DCs) are computationally fast, make no statistical assumptions and can handle data that are represented on different measurement scales. In this study, a decision tree was proposed to extract wetlands from GF-1 images of the Nanjishan wetland. The decision tree classification (DTC) method yielded the highest overall accuracies, which were 96.12% and 92.76%. The change detection results indicated that the water, marsh and low-density meadow areas changed significantly in conjunction with remarkable transformations between the other wetland cover types. The results discussed in this paper will provide fundamental information to local governments for the protection and restoration of the ecosystem of the Nanjishan wetland.
1. Introduction
Wetlands are transitional zones between terrestrial and aquatic environments and play a significant role in maintaining environmental stability, water purification, biodiversity preservation, minimal flooding and erosion, and other services (Mitsch and Gosselink Citation2000; Tiner Citation2003; Detenbeck et al. Citation1999). However, due to intensive anthropogenic activities, climate change and decreasing biodiversity, the ecological functions of wetlands are retrogressing and triggering numerous environmental and social problems (Gong et al. Citation2010; Han, Chen, and Feng Citation2015). Therefore, the effective management and protection of wetlands is urgently needed, and accurate and comprehensive wetland classification maps and spatio-temporal change information are very important for ecological protection and local government decisions.
The basis of wetland ecological conservation is to first identify a wetland’s location, distribution, size and type. However, traditional measurements of wetlands, that is, field investigations or the manual visual interpretation of aerial photographs, have limited spatial or temporal coverage, consume a large amount of human resources and are difficult to undertake. Because satellite images are multi-temporal and multispectral and provide repeated and extensive coverage for monitoring changing conditions (Ozesmi and Bauer Citation2002), they can be used to facilitate research for mapping wetlands and can yield information on wetland changes over time (Han, Chen, and Feng Citation2015). Currently, with the rapid development of remote sensing technology, abundant remote sensing data are available for wetland mapping, including the freely available Landsat images, which have a primary spatial resolution of 30 m, and the moderate resolution imaging spectroradiometer data, which have a spatial resolution ranging from 250 to 1000 m (Rundquist, Narumalani, and Narayanan Citation2001). These types of remote sensing images can provide relatively accurate results for mapping large- or medium-scale wetlands or monitoring wetland changes; however, they are not suitable for small-scale wetland mapping due to their limited spatial resolutions. Considering the different scales of individual research regions and to guarantee the accuracy of wetland classifications, it is crucial to choose an appropriate remote sensing data source.
In addition, remote sensing technology has increasingly provided improved tools and methods to acquire wetland maps and change information. Diverse approaches have been applied to discriminate and map wetland cover; in early studies, the visual interpretation of satellite images or aerial photographs, which is inefficient and labour intensive, was used to acquire wetland information (Johnston and Barson Citation1993). However, improvements in computer algorithms have created various classifiers that can automatically classify wetland cover types according to different data sources and research requirements. Currently, the primary methods used to classify and identify wetlands are unsupervised/supervised classifications, including supervised maximum likelihood classifiers (MLCs) (Ozesmi and Bauer Citation2002). Support vector machine (SVM) is a supervised classification method that can characteristically process high-dimensionality data using a few training samples (Foody and Mathur Citation2004; Congalton Citation1991, Gualtieri and Cromp Citation1999, Wang et al. Citation2012; Tax and Duin Citation2004). However, decision tree classification (DTC) has been the preferred method because it enables users to classify wetland cover types from multiple sources of data at different measurement scales without considering distribution assumptions (Michishita, Xu, and Gong Citation2008; Pal and Mather Citation2003). The general hierarchical structure and simplicity of decision trees can also be a valuable asset to both experienced and inexperienced users for interpretation, algorithm testing and analysis. Decision trees have been shown to provide accuracies better than those of other, more traditional classifiers (Wright and Gallant Citation2007; Baker et al. Citation2006; Davranche, Lefebvre, and Poulin Citation2010).
The Nanjishan Wetland National Nature Reserve (NWNNR) encompasses the south-western part of Poyang Lake, which is the largest wetland reserve in the Poyang Lake region, encompassing an area of nearly 33,300 hm2 (Liu, Fan, and Hu Citation2006). The waterbody and meadows vary greatly as the water level fluctuates. Nevertheless, the Nanjishan wetland has a completely estuarine wetland ecosystem, which serves as a very important international wintering habitat for waterfowl and a relay station for East Asia–Australia waterfowl. Although many researchers have analysed the Poyang Lake wetland using remote sensing approaches (Ji et al. Citation2007; Dronova, Gong, and Wang Citation2011; Chan and Xu Citation2013), few researchers have focused on the Nanjishan wetland. In this study, we selected the Nanjishan wetland as the research region and separately examined wetland classification methods using Gaofen One (GF-1) data at two typical dates in the dry and flood seasons, that is, 21 December 2013 and 17 September 2014. This study had the following two objectives: (1) assess the feasibility of using GF-1 data for wetland mapping and choose a reliable method for classifying the major wetland cover types in the Nanjishan wetland and (2) analyse the changes in the Nanjishan wetland cover types and qualitatively analyse the causes and relationships to other climate factors.
2. Study area and data set
2.1. Study area and environmental settings
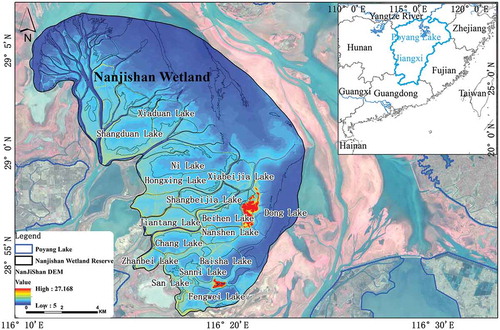
The Nanjishan wetland (28°52′21″N–29°06′46″N and 116°10′24″E–116°23′50″E, ) encompasses the southern part of Poyang Lake. It is the outer part of a delta formed by the deposition of sediments into Poyang Lake from three (south, middle and north) tributaries of the Ganjiang River. The lake is well known for its ecological and economic importance and for the rapid changes in its inundation area (Feng et al. Citation2012). The average annual temperature is 17.3°C and the average annual rainfall is 1378–1823 mm. Due to the typical subtropical monsoon climate in the region, precipitation exhibits large seasonal variability, and the waterbody and meadows vary greatly as the water level fluctuates during the flood and dry seasons. During the wet season, that is, from April to September, nearly all of the Nanjishan sub-lakes are connected and form a large lake. Only two occupied islands, which have a total area of 4 km2 (Nanshan Island and Jishan Island), are not inundated. However, during the dry season, that is, from October to March (in the following year), the entire wetland is divided into many connected and disconnected segments separated by exposed floodplains (http://www.njnr.org/html/kyjc/cgsq/100.html).
Figure 1. Location of the Nanjishan Wetland National Nature Reserve in China. The false colour image is a Gaofen One image collected on 21 December 2013.
The Nanjishan wetland has a completely estuarine wetland ecosystem; it provides a comprehensive habitat for numerous species with an extremely rich biodiversity. Every year, nearly 90 species of waterfowl migrate to the Nanjishan wetland for wintering or transiting, and the total number of waterfowl exceeds 80000, which accounts for approximately 58% of the total number of wintering or transiting waterfowl in Poyang lake. There are numerous species that have received global attention and are endangered, such as Ciconia boyciana, C. nigra, Grus monacha and Platalea leucorodia; the habitats of 16 species in the waterfowl population have reached the standard of internationally important wetlands. The Nanjishan wetland is considered among the most well-conserved wetlands at similar latitudes (http://www.njnr.org/html/kyjc/ssyd/97.html).
2.2. Data sets
Various types of data sets were used in this study. The primary data sets were GF-1 satellite images and the vector boundaries of the NWNNR, and unmanned aerial vehicle aerial photography and a 5-m digital elevation model (DEM) were used to validate the wetland classification results and perform auxiliary analyses.
In the context of current remote sensing data used in wetland mapping and wetland change detection studies, the main data sources are Landsat series data with 30-m spatial resolutions; these data are feasible for medium- and large-scale wetland mapping. However, in this study, we selected the Nanjishan wetland as the research area, which has a relatively small spatial scale; thus, higher-resolution remote sensing data were selected to obtain more precise wetland mapping information. Therefore, we chose GF-1 2-m fused data for the primary analysis to obtain more accurate and realistic wetland cover type spatial distribution information, which was beneficial for obtaining higher-precision information on changes to the wetlands of the Nanjishan wetland.
GF-1 is the first Chinese satellite in the High-resolution Earth Observation System, which employs important breakthrough technologies focusing on high spatial resolutions, optical remote sensing techniques, integrated multispectral and high-spatiotemporal resolutions, and fusion and mosaic technologies using images captured by multiple payload, high-precision and high-stability attitude control technologies (Bai Citation2013). The GF-1 satellite was equipped with two panchromatic/multispectral (PMS) cameras and four wide field of view (WFV) cameras (http://www.cresda.com/n16/n1130/n188475/188494.html). The PMS data have four bands at 8-m spatial resolution and a 2-m panchromatic (PAN) band from 450 to 900 nm. The GF-1 primary cameras and their parameters are shown in . The dynamic range of the data is 16 bits.
Table 1. Spectral, temporal and spatial resolutions of GF-1 imagery.
To cover the entire Nanjishan wetland, four GF-1 image scenes are needed. We selected eight scenes of narrow-coverage PMS images (4-day revisit time and 60-km swath) captured on 21 December 2013 and 17 September 2014. The scenes used in this study are listed in . The GF-1 data were downloaded from the China Centre for Resources Satellite Data and Application (http://www.cresda.com/n16/index.html). The GF-1 data were collected on 21 December 2013 which represented the typical image recorded the distribution of all wetland cover types in dry season, the range of water was smallest for the reason of the lowest water level, and in this season, the wetland landscape was quite diverse and it provided abundant food and habitat for wintering birds. On 17 September 2014, Nanjishan wetland was still in the flood period. Water covered the whole region of Nanjishan wetland, meanwhile it began recession with the water level descended and the start of marsh emergence. Then, in this study, the two dates of GF-1 images were meaningful for Nanjishan wetland classification and dynamic change detection.
Table 2. GF-1 image data sets.
Auxiliary data: The shape file of the Nanjishan wetland boundary was provided by the NWNNR Administration. The unmanned aerial vehicle (UAV) aerial photographs were taken at a time similar to those of the GF-1 images on 12 September and 27 September 2014. The aerial photographs were used to collect the training samples and verify the classification results.
3. Methodology
3.1. GF-1 data preprocessing
In this study, we primarily examined wetland changes; therefore, we used a previously gathered two-season archive of GF-1 data covering the study area in different seasons in 2013 and 2014. Because four PMS GF-1 image scenes can cover the entire Nanjishan wetland, four GF-1 PMS images were mosaicked together to provide complete coverage of the Nanjishan wetland. Before building the mosaic, we used the rational polynomial coefficient file contained in the GF-1 data to ortho-rectify the images to eliminate the effects of terrain distortion and sensor errors. Then, we made mosaics for all of the multispectral and PAN images. The multispectral and PAN images were then fused using the Gram–Schmidt Pan sharpening method (Laben and Brower Citation2000). This fusion method was used because the spectral information in the fused images is highly consistent with that in the original images. Three single-factor indexes (mean, standard deviation and entropy) were used to evaluate the quality of the fused images. Based on the evaluation results shown in , the statistical values (mean, standard deviation and entropy) of the original GF-1 data agreed well with those of the Gram–Schmidt Pan sharpening data. This finding indicates that the fusion and original GF-1 data were highly consistent. Therefore, two high-fidelity 2-m GF-1 fusion images were produced.
Table 3. Fusion image quality evaluation.
Atmospheric correction is not suitable for all image preprocess, for instance, the processed images were applied to wetland classification and change detection, provided training data and the data to be classified are in the same relative scale, even though conducting the atmospheric correction, the result of classification cannot be promoted (Kawata et al. Citation1990; Song et al. Citation2001). Considering there is no ideal atmospheric correction model for GF-1 images, in order to maintain the original spectrum characteristic information, the GF-1 images were not processed by the atmospheric correction. Simultaneously, accurate geometric rectifications of multi-temporal images are essential for change detection (Gong, Ledrew, and Miller Citation1992). Misregistrations between two different data images can lead to spurious detections of change areas. Therefore, to improve spatial positioning accuracy, a geometric correction was performed on the two fused GF-1 images. The images were geo-referenced to the Universal Transverse Mercator zone 50°N projection, with reference to the World Geodetic System 1984 (WGS84) ellipsoid. Image-to-image registration was then performed; the image dated 21 December 2013 was registered to the image dated 17 September 2014. The image was resampled using a nearest-neighbour technique, and the root mean square error (RMSE) of the geo-correction image was 0.42 pixels, which satisfied the maximum tolerable RMSE limit of 0.5 pixels for change detection. Finally, we used the Nanjishan vector layer provided by the Administration Bureau of NWNNR as a mask to extract the study area. This work was performed using the Environment for Visualizing Images (ENVI) 5.1 software programme ()
Figure 2. GF-1 data preprocessing workflow.
3.2. Image classification
3.2.1. Reference data selection
Based on several field experiences in the Nanjishan wetland, five major wetland cover types were identified: water, high-density meadow, low-density meadow, marsh and bare land; there are a few shrub, pond, farmland and construction areas sporadically distributed on Nanshan and Jishan Islands. For the supervised classification, reference samples should be collected for training or validation. Generally, the reference data should be collected in the field. However, rapid inundation changes and the relatively shallow water in the wetland make it difficult to collect effective field observations (Han, Chen, and Feng Citation2015). In this study, we obtained reference data from Google Earth (), which provided concurrent Google images on 21 December 2013; in these images, different wetland cover types could easily be visually interpreted and could be used as ground truth for the land cover classifications. More than 400 random samples were generated from the Google and GF-1 images and were visually classified as bare land, high-density meadow, low-density meadow, marsh, water, farmland, construction, shrub and pond; 40% of the random samples were used as training samples for the supervised classification and the remaining samples were used to validate the 21 December 2013 wetland classification results. Moreover, the quasi-synchronous UAV images obtained near 17 September 2014, which can be considered as reference data, were applied for classification training or verification. These high-resolution images were used as an independent reference to test and validate the maps obtained from the satellite classification procedure. However, the UAV images covered only a small range near Jishan Island, and we needed to combine the visual interpretation of the GF-1 image and UAV images for acquiring samples. For each class, 100 samples were distributed throughout the scene to obtain a representative characterization of each class.
The means of the GF-1 spectra for the training samples were estimated and are plotted (), which clearly display that the nine wetland cover types are distinguishable in the Red-to-Near Infrared (NIR) regions. Additionally, according to a separability analysis using the training samples generated for each class, the pair separation of different cover types are greater than 1.8, suggesting that the selected training samples could adequately represent the spectral features for each class. Thus, a valid classifier could be expected from these carefully selected samples. Spectral separability analyses compare the spectral signatures of classes and determine the degree to which those classes can be distinguished. Spectral separability analysis is a commonly used exploratory analysis approach for selecting classes and training data for classification. The spectral separability was calculated using the Jeffries–Matusita (J–M) distance, which measures the divergence between spectral means (Richards and Richards Citation1999). The J–M distances in the ENVI are squared so that the distance values range from 0 to 2, where values greater than 1.9 are highly separable, whereas value less than 1.0 require class combing or new training data for traditional mean-based classification methods.
Figure 3. Distribution of samples.
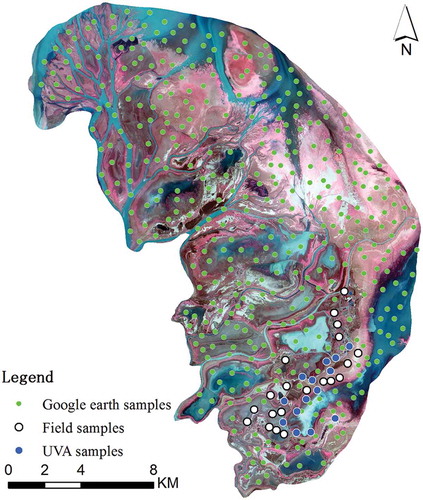
Figure 4. Mean spectral shapes of the selected training samples on the Gaofen One images for different wetland cover types in the Nanjishan wetland.
3.2.2. Wetland classification
From the perspective of migratory birds habitat protection, analysis of the Nanjishan wetland wintering birds foraging range and the characteristics of the choice of habitat to comprehensively consider the classification standard of traditional wetland classification system, habitat characteristics of migratory, suitable for remote sensing survey indicators, etc. The wetland landscape classification system was constructed based on the formation, hydrology, geomorphology and protection of migratory birds. In this study, we established a three-level classification system (). The major wetland cover types include water, marsh, high-density meadow, low-density meadow and bare land, and also few areas of construction, shrubs, farmlands and ponds concentrated distributed on Nanshan and Jishan Islands.
Table 4. Classification system of the Nanjishan wetland.
Depending on the spectral statistical values of the different cover types, we selected the best empirical value by trial and manual–computer interaction as a threshold for each decision tree node. Determining and adjusting process node thresholds by comparing the different thresholds to various target classes to determine the selection of thresholds may or may not be reasonable.
The Normalized Difference Water Index (NDWI) (McFeeters Citation1996) is an efficient model for waterbody extraction. In this study, using statistics on the NDWI values of the water and non-water samples, we determined that an NDWI greater than 0.2364 can accurately distinguish water from non-water regions. On Nanshan and Jishan Islands, there are a few fish ponds; a shape index > 0.18 and water area < 9000 m2 were assigned to these ponds. Due to construction, there are obvious reflection characteristics in the band 4 performance; these activities are mainly distributed on Nanshan and Jishan Islands (DEM > 16.7). By setting the value of the DEM and Band 4, we were able to extract constructions. By researching the spectral responses of the various wetland cover types based on the visible red (R) and green (G) band spectral responses, we found that the soil vegetation and water have opposite spectral characteristics, and the Normalized Differential Soil Index (NDSI) (Xu, Zhao, and Liu Citation2002) was utilized to differentiate bare land and marshes. The Normalized Differential Vegetation Index (NDVI) is an effective model that was used to distinguish vegetation, non-vegetation, shrub and farmland distributed in the region of DEM > 17.5. The red band (band 3: 0.63–0.69) of GF-1 is the primary chlorophyll absorption band, and it can be used to discriminate different vegetation types and estimate growth status. The NDVIs of shrub and farmland exhibit large differences in winter. Higher NDVI values indicate high-density vegetation and better growth conditions. By setting an NDVI threshold value, high-density meadow and low-density meadow were easy to distinguish. The final decision for wetland mapping is presented in . The various indices used in this analysis are as follows:
Figure 5. Decision tree classification on 21 December 2013 and 17 September 2014; all tree nodes with subscripts represent the month of different images; all thresholds in each decision tree node were decided by training and calculating samples.
B2, B3 and B4 represent green, red and NIR bands of the GF-1 images, respectively. A is the area of each water fragment extracted using the NDWI threshold and P is the perimeter of each fragment. For water that is nearly circular, the shape index exceeds 0.25. The shape index of a square is equal to 0.25, and the shape index decreases as the waterbody becomes more irregular, which is generally the case for rivers and lakes smaller than fish ponds.
In this study, MLC and SVM supervised methods were compared with the DTC method. The 200 random training samples were selected from concurrent Google Earth and GF-1 images and were used to train the classifiers; the accuracy measures were estimated using the validation samples. The results () show that the DTC method achieved much better performance than the other classification methods, and it demonstrated higher overall accuracy based on both the producer accuracy and the kappa coefficients, with overall accuracies of over 92%.
Table 5. Accuracy assessment of the classification results for each wetland cover type derived from MLC, SVM classifiers and DTC.
3.3. Dynamic change detection
Currently, two basic approaches are commonly utilized in change detection: bi-temporal change detection and temporal trajectory analysis methods (Coppin et al. Citation2004). Bi-temporal techniques, which are the most common change detection techniques, utilize images taken at two different periods to assess changes in land cover. Most wetland change detection studies are bi-temporal in nature (Ramsey and Laine Citation1997; Rebelo, Max Finlayson, and Nagabhatla Citation2009).
We adopted a post-classification comparison for this study. In standard post-classification change detection, the two co-registered maps are compared on a pixel-by-pixel basis using a change detection matrix. Thematic change workflow embedded in ENVI 5.1 was applied to wetland change detection; this thematic change detection takes two classification images of the same scene at different times and identifies differences between them. Using this workflow, we obtained the wetland types’ areas and percentage transfer matrix during the change period; we also obtained the transition maps of the different wetland cover types. By analysing all of the above output results, we could quantitatively analyse variations in the Nanjishan wetland. The wetland dynamic change detection process is presented in .
Figure 6. The workflow of dynamic change detection.
4. Results
4.1. Classification results
To quantify the wetland distribution of the Nanjishan wetland from December 2013 to September 2014, the areas and percentages of the major land cover types were calculated for each GF-1 classification map (). and show the classification results of the GF-1 images on 21 December 2013 and 17 September 2014. The spatial distributions of different wetland cover types are clearly demonstrated within each panel. On 21 December 2013, in the typical dry season, the entire Nanjishan area was mainly covered by water, meadows and marshes. Moreover, according to the characteristics of the vegetation phenology in the Nanjishan wetland, the meadow could be categorized into two types: high-density meadow and low-density meadow. The areas of high-density meadow and low-density meadow were 8814.45 and 5340.38 hm2, respectively. These wetland cover types comprised more than 40% of the total area of the Nanjishan reserve. The wetland meadow area was primarily distributed throughout the Nanjishan wetland, especially the north-eastern part of the reserve, which is close to the core region of Poyang Lake. The marshes were distributed adjacent to the water, exhibiting annular or strip characteristics. The water was primarily distributed in small deep-inner lakes (Zhanqiu Lake) and narrow watercourses for the reason of water level declined and artificial control the water level of Zhanqiu lake.
Figure 7. The classification maps of the Nanjishan wetland: (a) wetland map on 21 December 2013 and (b) wetland map on 17 September 2014.
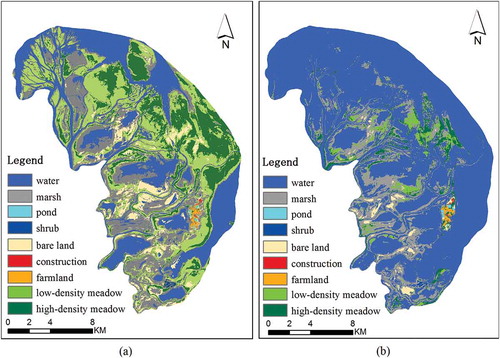
In the flood season of the Nanjishan wetland on 17 September 2014, water occupied the entire reserve, especially in the northern and eastern parts of the region, which is the estuary area where Gan River joins Poyang Lake. In addition, in September, the Nanjishan wetland was at the end of the flood season, and in part of the region, the water was beginning to recede. Because the water was receding, the marsh area was also very large and occupied more than 16% of the entire region. Many small inner lakes were distributed in the area, especially in the south-western part of the reserve, and their water levels were significantly influenced by anthropic activity. However, the meadow region was completely covered by water and only accounted for less than 10% of the entire region.
4.2. Wetland dynamic change detection
As shown in the classification maps (), the five wetland cover types (water, high-density meadow, low-density meadow, marsh and bare land) were primarily distributed in the entire Nanjishan wetland. In addition, the construction, farmland, pond and shrub areas were relatively small and indicated no change. Therefore, only the five wetland features were analysed in this study. From December 2013 to September 2014, significant variabilities in their spatial distributions and total areas were observed in the Nanjishan wetland.
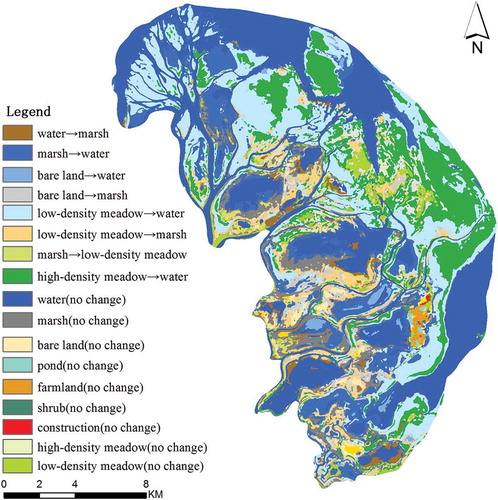
To better understand the spatial distributions of the transformational information between different wetland cover types in the Nanjishan wetland, the transformation map during the period of December 2013 to September 2014 is shown in . Specifically, the coverage of bare land in the Nanjishan wetland decreased because a portion of the bare land was transitioned to marshes. In addition, large areas of high-density meadows, low-density meadows and marsh were transformed into water in the north-eastern part of the reserve. In the eastern part of the Nanjishan wetland, that is, near the estuary of Gan River to Poyang Lake, the wetland changes were characterized by a transition from meadows to water. Meanwhile, in the southern part of the Nanjishan wetland, low-density meadows and bare land were transformed into marsh. For the entire reserve, the dominant changes were also transformations between meadows and water.
Figure 8. Wetland cover type change map from 21 December 2013 to 17 September 2014. The legend displays only the wetland cover types that experienced relatively significant changes during the study period.
A synthetic analysis of the water, marsh and high-density meadow is provided in and , and the data of transfer matrix presented that these three wetland cover types changed conspicuously. The expansion of the coverage of water was most obvious, whereas the marshes and high-density meadows were converted to water. In contrast, the high-density meadow coverage shrank substantially, and the high-density meadows were mainly converted to marshes and water throughout the study period. Meantime, the coverage areas of bare land and low-density meadow did not change substantially and remained small. The most complicated transformation occurred in the central and southern parts of the Nanjishan wetland, which contained relatively diverse wetland cover types.
Table 6. Areas and percentages of the different wetland cover types on 21 December 2013and 17 September 2014.
Table 7. The transfer matrix of all wetland cover types in the Nanjishan wetland from 21 December 2013 to 17 September 2014.
Figure 9. The wetland change information (containing change or no-change types). LM: low-density meadow; HM: high-density meadow; BL: bare land.
The meadow and marsh coverage of the Nanjishan wetland exhibited a significant decreasing tendency during the entire study period. In contrast, an increasing trend was observed for water. The coverage of meadow and water exhibited out-of-phase variability during the research period. The bare land area remained relatively consistent in the Nanjishan wetland, having only a negligible decrease. The mean rainfall and temperature from December 2013 to September 2014 were significantly correlated with the distribution of meadow in the Nanjishan wetland. Natural factors were the primary causes of the significant changes. Moreover, variations in rainfall had a critical effect on the changes in the wetland feature types.
5. Conclusions
This paper reports in a case study on the analysis of flood and dry season changes in wetland cover types in the NWNNR. First, two remote sensing images from typical flood and dry seasons dates were collected and preprocessed. We then obtained GF-1 fused images with 2-m spatial resolution by utilizing the GF-1 data to automatically acquire comprehensive wetland distribution and seasonal change information. Second, we adopted the DTC method to classify the Nanjishan wetland. We also extracted wetland distribution information separately in the flood and dry seasons according to phenological and seasonal features of the wetlands in the study area. In addition, we evaluated the feasibility of the DTC method and compared it with two other classifiers (MLC and SVM) for wetland mapping using GF-1 images. Finally, we calculated two classification results, determined the wetland transformation matrix and analysed the spatial conversion of all the wetland patterns.
To our knowledge, this paper represents the first quantitative exploration of temporal changes in the major wetland cover types in the Nanjishan wetland area. We attribute the success of this effort to the following factors: (1) access to the GF-1 data, the fortunate availability of the two typical date images and the reference samples to validate the accuracy; (2) the availability of a flexible and reliable method for preprocessing the GF-1 data and (3) the use of the empirical DTC method to obtain consistent classification results from the remote sensing images collected by the GF-1 satellite. The results in this work provide baseline information on wetland changes in the Nanjishan wetland that can be used in the future for wetland investigation of the Nanjishan. In general, this approach can be easily extended to similar wetlands to document and explore their seasonal and long-term changes.
Given the restricted acquisition of GF-1 data sources, only two dates of GF-1 data that we obtained were applied to analyse the changes in the wetlands. And due to the lack of local meteorological data, we were unable to complete a seasonal time series analysis and quantify the effects of precipitation and temperature on the changes in the wetland cover types. Moreover, no quantitative analyses of the causes of the seasonal changes to the Nanjishan wetland landscape were undertaken. Additionally, in the Nanjishan wetland, we should pay increased attention to community-scale wetland change research in future studies.
Acknowledgements
Thanks to the Institute of Space and Earth Information Science, the Chinese University of Hong Kong, which organized ‘The 2nd International Conference on Remote Sensing Applications in Tropical and Subtropical Areas on 8-10 December 2015’. In addition, Professor Lin Hui and Dr. Zhang Hongsheng are especially thanked for their useful comments and assistance.
Disclosure statement
No potential conflict of interest was reported by the authors.
Additional information
Funding
References
- Bai, Z. G. 2013. “GF-1 Satellite - the First Satellite of CHEOS.” Aerospace China 4: 11-16 (in Chinese).
- Baker, C., R. Lawrence, C. Montagne, and D. Patten. 2006. “Mapping Wetlands and Riparian Areas Using LANDSAT ETM+ Imagery and Decision-Tree-Based Models.” Wetlands 26 (2): 465–474. doi:10.1672/0277-5212(2006)26[465:MWARAU]2.0.CO;2.
- Chan, K., and B. Xu. 2013. “Perspective on Remote Sensing Change Detection of Poyang Lake Wetland.” Annals of GIS 19 (4): 231–243. doi:10.1080/19475683.2013.843589.
- Congalton, R. G. 1991. “A Review of Assessing the Accuracy of Classifications of Remotely Sensed Data.” Remote Sensing of Environment 37 (1): 35–46. doi:10.1016/0034-4257(91)90048-B.
- Coppin, P., I. Jonckheere, K. Nackaerts, B. Muys, and E. Lambin. 2004. “Review Article Digital Change Detection Methods in Ecosystem Monitoring: A Review.” International Journal of Remote Sensing 25 (9): 1565–1596. doi:10.1080/0143116031000101675.
- Davranche, A., G. Lefebvre, and B. Poulin. 2010. “Wetland Monitoring Using Classification Trees and SPOT-5 Seasonal Time Series.” Remote Sensing of Environment 114 (3): 552–562. doi:10.1016/j.rse.2009.10.009.
- Detenbeck, N. E., S. M. Galatowitsch, J. Atkinson, and H. Ball. 1999. “Evaluating Perturbations and Developing Restoration Strategies for Inland Wetlands in the Great Lakes Basin.” Wetlands 19 (4): 789–820. doi:10.1007/BF03161785.
- Dronova, I., P. Gong, and L. Wang. 2011. “Object-Based Analysis and Change Detection of Major Wetland Cover Types and Their Classification Uncertainty during the Low Water Period at Poyang Lake, China.” Remote Sensing of Environment 115 (12): 3220–3236. doi:10.1016/j.rse.2011.07.006.
- Feng, L., C. Hu, X. Chen, X. Cai, L. Tian, and W. Gan. 2012. “Assessment of Inundation Changes of Poyang Lake Using MODIS Observations between 2000 and 2010.” Remote Sensing of Environment 121: 80–92. doi:10.1016/j.rse.2012.01.014.
- Foody, G. M., and A. Mathur. 2004. “Toward Intelligent Training of Supervised Image Classifications: Directing Training Data Acquisition for SVM Classification.” Remote Sensing of Environment 93 (1–2): 107–117. doi:10.1016/j.rse.2004.06.017.
- Gong, P., E. F. Ledrew, and J. R. Miller. 1992. “Registration Noise Reduction in Difference Images for Change Detection.” International Journal of Remote Sensing 13 (4): 773–779. doi:10.1080/01431169208904151.
- Gong, P. Z., Niu, X., Cheng, K., Zhao, D., Zhou, J., Guo, L., Liang, et al. 2010. “China’s Wetland Change (1990-2000) Determined by Remote Sensing.” Science China Earth Sciences 53 (7): 1036–1042. doi:10.1007/s11430-010-4002-3.
- Gualtieri, J. A., and R. F. Cromp. 1999. “Support Vector Machines for Hyperspectral Remote Sensing Classification.” In The 27th AIPR Workshop: Advances in Computer Assisted Recognition. SPIE, 221–232. doi:10.1117/12.339824.
- Han, X., X. L. Chen, and L. Feng. 2015. “Four Decades of Winter Wetland Changes in Poyang Lake Based on Landsat Observations between 1973 and 2013.” Remote Sensing of Environment 156: 426–437. doi:10.1016/j.rse.2014.10.003.
- Ji, W., N. Zeng, Y. Wang, P. Gong, B. Xu, and S. Bao. 2007. “Analysis on the Waterbirds Community Survey of Poyang Lake in Winter.” Geographic Information Sciences 13 (1–2): 51–64. doi:10.1080/10824000709480632.
- Johnston, R. M., and M. M. Barson. 1993. “Remote Sensing of Australian Wetlands: An Evaluation of Landsat TM Data for Inventory and Classification.” Australian Journal of Marine and Freshwater Resources 44 (2): 235–252. doi:10.1071/MF9930235.
- Kawata, Y., A. Ohtani, T. Kusaka, and S. Ueno. 1990. “Classification Accuracy for the MOS-1 MESSR Data before and after the Atmospheric Correction.” IEEE Transactions on Geoscience and Remote Sensing 28 (4): 755–760. doi:10.1109/TGRS.1990.573015.
- Laben, C. A., and B. V. Brower 2000. Process for Enhancing the Spatial Resolution of Multispectral Imagery Using Pan-Sharpening. Eastman Kodak Company, Rochester, patent no. 6011875.
- Liu, X. Z., S. B. Fan, and B. H. Hu. 2006. Comprehensive and Scientific Survey of Jiangxi Nanjishan Wetland Nature Reserve. Beijing: China Forestry Press (in Chinese).
- McFeeters, S. K. 1996. “The Use of the Normalized Difference Water Index (NDWI) in the Delineation of Open Water Features.” International Journal of Remote Sensing 17: 1425–1432. doi:10.1080/01431169608948714.
- Michishita, R., B. Xu, and P. Gong. 2008. “A Decision Tree Classifier for the Monitoring of Wetland Vegetation Using ASTER Data in the Poyang Lake Region, China.” The International Archives of the Photogrammetry, Remote Sensing and Spatial Information Sciences 37B8: 315–321.
- Mitsch, W. J., and J. G. Gosselink. 2000. Wetlands. 3rd ed. New York: John Wiley and Sons.
- Ozesmi, S. L., and M. E. Bauer. 2002. “Satellite Remote Sensing of Wetlands.” Wetlands Ecology and Management 10 (5): 381–402. doi:10.1023/A:1020908432489.
- Pal, M., and P. M. Mather. 2003. “An Assessment of the Effectiveness of Decision Tree Methods for Land Cover Classification.” Remote Sensing of Environment 86 (4): 554–565. doi:10.1016/S0034-4257(03)00132-9.
- Ramsey, E. W., and S. C. Laine. 1997. “Comparison of Landsat Thematic Mapper and High Resolution Aerial Photography to Identify Change in Complex Coastal Wetlands.” Journal of Coastal Research 13 (2): 281–292. http://www.jstor.org/stable/4298625.
- Rebelo, L.-M., C. Max Finlayson, and N. Nagabhatla. 2009. “Remote Sensing and GIS for Wetland Inventory, Mapping and Change Analysis.” Journal of Environmental Management 90 (7): 2144–2153. doi:10.1016/j.jenvman.2007.06.027.
- Richards, J. A., and J. A. Richards. 1999. Remote Sensing Digital Image Analysis. Berlin: Springer-Verlag.
- Rundquist, D., S. Narumalani, and R. Narayanan. 2001. “A Review of Wetlands Remote Sensing and Defining New Considerations.” Remote Sensing Reviews 20 (3): 207–226. doi:10.1080/02757250109532435.
- Song, C., C. E. Woodcock, K. C. Seto, M. P. Lenney, and S. A. Macomber. 2001. “Classification and Change Detection Using Landsat TM Data: When and How to Correct Atmospheric Effects?” Remote Sensing of Environment 75 (2): 230–244. doi:10.1016/S0034-4257(00)00169-3.
- Tax, D. M. J., and R. P. W. Duin. 2004. “Support Vector Data Description.” Machine Learning 54 (1): 45–66. doi:10.1023/B:MACH.0000008084.60811.49.
- Tiner, R. W. 2003. Correlating Enhanced National Wetlands Inventory Data with Wetland Functions for Watershed Assessments: A Rationale for Northeastern US Wetlands. Hadley, MA: US Fish and Wildlife Service, National Wetlands Inventory Program, Region, 5.
- Wang, L., I. Dronova, P. Gong, W. Yang, Y. Li, and Q. Liu. 2012. “A New Time Series Vegetation–Water Index of Phenological–Hydrological Trait across Species and Functional Types for Poyang Lake Wetland Ecosystem.” Remote Sensing of Environment 125: 49–63. doi:10.1016/j.rse.2012.07.003.
- Wright, C., and A. Gallant. 2007. “Improved Wetland Remote Sensing in Yellowstone National Park Using Classification Trees to Combine TM Imagery and Ancillary Environmental Data.” Remote Sensing of Environment 107 (4): 582–605. doi:10.1016/j.rse.2006.10.019.
- Xu, J. C., Y. S. Zhao, and Z. H. Liu. 2002. “Research on Ecological Environment Change of Middle and Western Inner-Mongolia Region Using RS and GIS.” Journal of Remote Sensing 6 (2): 142-150 (in Chinese).