
ABSTRACT
Colorectal cancer (CRC) interventions can be more precisely targeted geographically if locations of high-risk population groups can be detected and risk factors at these locations can be identified. This study aims to detect small geographic areas where CRC late-stage diagnosis and mortality rates were disproportionally high among racial/ethnic minorities (i.e., non-Hispanic African Americans and Hispanics) in Texas using non-Hispanic Whites as a reference group. The analysis used data about CRC cases diagnosed between 1995 and 2003 in Texas with follow-up data up to 2008. In addition, this study identifies neighborhood-level factors that are associated CRC mortality disparities in the identified geographic areas using a logistic regression analysis. Analysis results indicate that CRC mortality disparities existed in the Austin-San Antonio, the Dallas-Fort Worth, and the Houston metropolitan areas for both non-Hispanic African Americans and Hispanics. Additionally, for non-Hispanic African Americans, census tracts with significant CRC mortality disparities concentrated mostly in the eastern part of Texas. For Hispanics, census tracts with significant CRC mortality disparities scattered in different parts of Texas. Results from this study suggest that CRC intervention programs may benefit from providing additional assistance to African Americans and Hispanics with a low socioeconomic status in the identified areas.
Introduction
Colorectal cancer (CRC) is the third most common cancer and third leading cause of cancer mortality among both males and females in the United States (Siegel, DeSantis, and Jemal Citation2014). Although both incidence and mortality rates of CRC have declined because of changes in risk factors and the uptake of CRC screening tests (Jemal et al. Citation2004), significant CRC burdens still remain. It is expected that about 134,490 cases would be diagnosed and 63,670 would die from CRC in 2016 in the United States (American Cancer Society Citation2016). Moreover, these burdens are not evenly distributed among all segments of the population in the United States. A number of studies have shown that racial/ethnic minorities in the United States, including African Americans, Hispanics, and other minority groups, experience a disproportionally higher burdens of CRC incidence, late-stage diagnosis, and mortality compared with non-Hispanic whites (Chien et al. Citation2005; Wan et al. Citation2012a, Citation2013; Siegel, DeSantis, and Jemal Citation2014). The disproportional burdens are called disparities. The disparities must be reduced. A significant challenge in reducing these disparities is the development of cost-effective intervention programmes and target deliver these programmes to people in areas where disparities exist.
Prior studies suggested that geographically targeted interventions may be more cost-effective (Cooper et al. Citation1999). However, the exact geographic areas of most current intervention programmes aiming to promote CRC screening among racial/ethnic minorities could be more specific to increase the effectiveness of the intervention programmes. We argue that not everyone from minority groups is at higher risk. Some geographic areas have a disproportionally higher CRC mortality rate in minorities. Minorities and low-income households in these areas are the ones who need the most assistance in CRC intervention. Therefore, it is first important to detect small geographic areas where disparities exist to enhance targeted intervention.
Another important aspect is the identification of both individual-level and neighbourhood-level factors that may be associated with the disparities in the detected areas. Results from previous studies suggested that several individual-level factors, including race/ethnicity, age, socio-economic status, insurance, access to healthcare, health behaviours, and tumour characteristics (e.g. stage at diagnosis and tumour grade) may be associated with CRC disparities (Chien et al. Citation2005; Wan et al. Citation2012a; Vernon Citation1997; Cooper et al. Citation1999; Lin and Wimberly Citation2016). Traditional targeted intervention programmes on CRC screening have adopted these individual-level characteristics as a guide for the delivery of intervention programmes. For example, the age of a person who is 50 years old or older is generally considered an eligibility requirement for participating in CRC screening (Vernon Citation1997; Myers et al. Citation2007).
In addition, neighbourhood-level factors (e.g. neighbourhood-level socio-economic factors, racial/ethnic composition, and social-environmental factors) also play an important role in shaping disparities (Lin and Zhan Citation2014; Lin, Schootman, and Benjamin Zhan Citation2015; Zhan and Lin Citation2014; Lin and Wimberly Citation2016). Some studies found that minorities residing in census tracts with lower socio-economic status or high racial segregation bear a higher cancer risk compared with minorities from census tracts with higher socio-economic status (Coughlin et al. Citation2008; Lim and Ashing-Giwa Citation2011). Because neighbourhood-level factors can vary significantly across different population groups at different geographic scales, the development and delivery of intervention materials should be tailored to the needs of specific population groups in targeted geographic areas if these neighbourhood-level factors can be identified.
The availability of geographically referenced cancer register data, socio-economic data, as well as social-environmental data covering large geographic areas over a long time period, and the analytical power of GIS and spatial analysis methods make it possible for health researchers to gain additional insights about cancer disparity and risk factors associated with cancer disparity at both the individual and neighbourhood levels.
This study first aims to detect geographic areas where racial/ethnic disparities of CRC mortality exist in minorities (e.g. African Americans and Hispanics) in Texas using non-Hispanic whites as a reference group. In addition, it attempts to identify neighbourhood-level factors that are associated with the presence of CRC disparities in the detected geographic areas. These factors include socio-economic factors reflecting socio-economic status, demographic factors, and geographic access to healthcare. Results from this study will provide valuable information for developing geographically targeted intervention programmes that may help reduce CRC minorities in African Americans and Hispanics in Texas. This study contributes to the field of spatial analysis and GIS through a demonstration of how GIS and spatial analysis methods may be used to gain insights about cancer disparity. These insights can be used to develop more effective strategies in cancer intervention.
In a related study, we examined whether late-stage CRC diagnosis or CRC survival is associated with geographic access to healthcare in Texas (Wan et al. Citation2012a, Citation2013). That study investigated late-stage CRC diagnosis and CRC survival using the entire population in Texas. The focus of this present study reported in this article is on minority disparities with an emphasis on African Americans and Hispanics in Texas. The focus on these minority groups will help gain insights about the areas of disproportionally higher burdens of CRC in minorities in Texas. It is hoped that the detection of small geographic areas and the identification of neighbourhood-level factors associated with CRC disparities will help develop more cost-effective geographically targeted intervention programmes aiming to reduce CRC disparities in Texas. In the rest of this discussion, we will use African Americans to refer to non-Hispanic African Americans.
Material and methods
Data sources
Colorectal cancer data
CRC cases diagnosed between 1995 and 2003 were collected from the Texas Cancer Registry (TCR). Data items related to each case included gender, race/ethnicity, stage at diagnosis, age at diagnosis, date of diagnosis, vital status, cause of mortality, follow-up information, and residential address at the time of diagnosis. Information about mortality status and cause of mortality was derived from the Texas vital status data set. The last day of follow-up of this cohort was 31 December 2008, which allows at least a 5-year observation of each case. Cases were geocoded based on their residential addresses in ArcGIS 9.3. The use and analyses of the CRC case data have been approved by the Institutional Review Board (IRB) of Texas Department of State Health Services (DSHS).
There were 77,667 CRC cases in Texas during the period from 1995 to 2003. The geocoding successfully located 69,701 CRC cases. The rest of the cases were not geocoded due to either incomplete or unmatched residential addresses. The study cohort included 35,731 (51.3%) late-stage (regional or distant stage) cases. There were 27,219 CRC-specific deaths in Texas during the study period. presents the distributions of CRC cases by gender, age, race/ethnicity, and stage at diagnosis. Cases (n = 9403) with missing or unclear information about age, race/ethnicity or stage at diagnosis were excluded from the analyses. Asian/Pacific Islanders and Native Americans (n = 775) were also excluded in the analysis because of their relatively smaller numbers.
Table 1. Characteristics of colorectal cancer cases in Texas, 1995–2003.
Healthcare data
Healthcare data of this study included: CRC screening facilities, primary care physicians (PCPs), and oncologists. Data of CRC screening facilities were collected from the Cancer Prevention Research Institute of Texas, including 111 hospitals/clinics that offered CRC-screening services in 2000 (e.g. traditional colonoscopy, virtual colonoscopy, flexible sigmoidoscopy, fecal-occult blood test, helical CT scanning, and double contrast barium enema). PCPs data were provided by the Center for Health Statistics in Texas DSHS. There were 14,268 PCPs working at 6372 practicing addresses in Texas in 2000. Oncologists data were collected from the Health Professional Resource Center of Texas DSHS. There were 205 oncologists at 121 practicing addresses in Texas in 2000.
The addresses of the CRC screening facilities, PCPs, and oncologists were geocoded using ArcGIS 9.3. All of the addresses of CRC screening facilities were successfully geocoded. About 97% of PCPs practicing addresses were successfully geocoded, and 204 out of the 205 oncologists were successfully geocoded.
Neighbourhood-level demographic and socio-economic data
The demographic and socio-economic data were extracted from the Summary File 1 and Summary File 3 of census 2000 data sets in the United States. The data included census tract level poverty rate, unemployment rate, percentage of population with complete college education, percentage of population with complete high school education, median household income, median home value, percentage of linguistically isolated households, percentage of households without vehicles, percentage of households with more than one person per room, percentage of non-Hispanic African Americans, percentage of Hispanics, and population density.
Methods
Measurement of geographic access to healthcare
We first measured geographic access to CRC screening facilities using the shortest travel time in ArcGIS 9.3. We then evaluated geographic access to PCPs and oncologist using the relative spatial access assessment method (Wan et al. Citation2012b; Zhan and Lin Citation2014; Lin and Zhan Citation2014). This method estimates the accumulative supply-to-demand ratio of available PCPs and oncologists based on travel time. Details of this method can be found elsewhere (Wan et al. Citation2012b). We used the above two different methods because access to PCPs/oncologists are more likely to be affected by both medical supply and population demand (Wan et al. Citation2012b).
Measurement of racial/ethnic disparities
The population-weighted risk difference (RD) was used to measure racial/ethnic disparities. Details of this method can be found in an article by Goovaerts and his colleagues (Goovaerts, Meliker, and Jacquez Citation2007). The RD statistic was calculated based on the following equation:
where denotes the risk difference,
is census tract i,
and
represent the CRC rate in question and population size of African Americans or Hispanics in census tract i,
and
are the CRC rate in question and population size of non-Hispanic whites in census tract i,
is the population-weighted average CRC rates under consideration in census tract i defined by the following equation:
We first calculated age-adjusted CRC rates of late-stage diagnosis and mortality in each census tract for African Americans, Hispanics, and non-Hispanic whites. Then we calculated the RD of CRC late-stage diagnosis and mortality for each of the two pairs: African Americans and non-Hispanic whites; Hispanics and non-Hispanic whites. Based on these results, we tested the null hypothesis that RD equals zero to identify census tracts exhibiting statistically significant disparities. A positive RD with a statistically significant p-value indicates that either African Americans or Hispanics have higher rates than non-Hispanic whites.
Statistical analysis
Factor analysis was used to reduce the dimension of neighbourhood-level socio-economic, demographic, and geographic accessibility variables under consideration. After factor analysis, a logistic regression was applied to identify whether any of these neighbourhood-level factors are associated with the presence of significant racial/ethnic disparities in census tracts selected by the RD analysis. In the logistic regression model, the dependent variable has a value of 1 (when RD of a census tract was significantly greater than 0 or 0 (when RD of a census tract was not significant). We excluded census tracts with RD values significantly less than 0 from the analysis. The logistic regression model estimates odds ratio (OR) to measure the association between a census tract exhibiting disparities and neighbourhood-level factors reflecting the characteristics of these census tracts.
Results
Geographic access to healthcare services
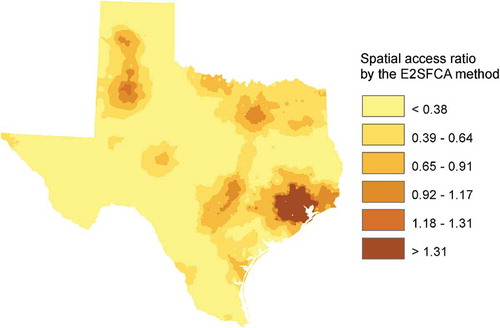
– illustrated the different levels of geographic accessibility for people residing in different census tracts in Texas to PCPs, CRC screening facilities, and oncologist, respectively. As expected, people in urban areas had better geographic access to PCPs and CRC screening facilities. Results from this study suggest that western and southern tips of Texas had a lower level of geographic accessibility to PCPs compared with the rest of Texas. Most areas in Texas were within 1 h of driving to CRC screening facilities based on the shortest travel time. However, people living in certain areas of Western Texas had to travel more than 90 min to access CRC screening services. This study also found that people living in major metropolitan areas (e.g. Dallas–Fort Worth, Austin-San Antonio, and Houston) in Texas had a high level of geographic accessibility to oncologists, while most of the areas in Texas had a low level of geographic access to oncologists.
Figure 1. Geographic access to primary care physicians in Texas, 2000. (Note: The map was obtained and modified from Wan et al. (Citation2012b) with removal of health district boundaries for better visual effect in the map. The map is reprinted with permission from Elsevier. A higher value of spatial access ratio means better accessibility; E2SFCA—Enhanced Two-Step Floating Catchment area method (Wan et al. Citation2012b).)
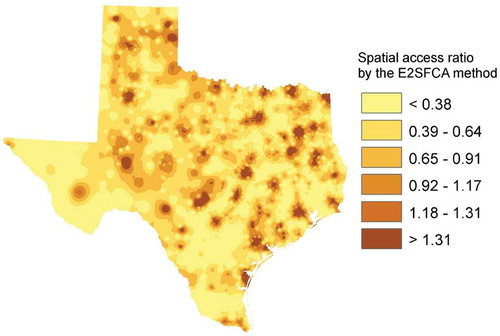
Figure 2. Geographic access to colorectal cancer screening facilities in Texas, 2000. (Note: The map was obtained and modified from Wan et al. (Citation2012b) with removal of health district boundaries for better visual effect in the map. The map is reprinted with permission from Elsevier.)
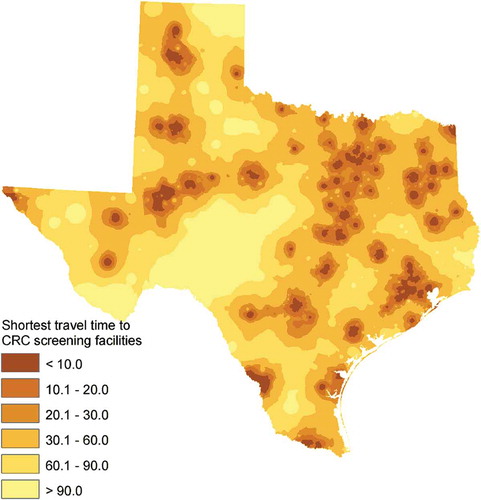
Figure 3. Geographic access to oncologists in Texas, 2000. (Note: The map was obtained and modified from Wan et al. (Citation2012b) with removal of health district boundaries for better visual effect in the map. The map is reprinted with permission from Elsevier. A higher value of spatial access ratio means better accessibility; E2SFCA—Enhanced Two-Step Floating Catchment area method (Wan et al. Citation2012b).)
Racial/ethnic disparities in CRC late-stage diagnosis
shows small geographic areas where CRC late-stage diagnosis disparities existed in both African Americans and Hispanics. A total of 312 (7.11%) out of the 4388 census tracts were detected to have late-stage diagnosis disparities in African Americans when compared with non-Hispanic whites (, and 357 (8.14%) census tracts exhibited late-stage diagnosis disparities in Hispanics ()).
Figure 4. Colorectal cancer late-stage diagnosis disparities in African Americans (a) and Hispanics (b) when non-Hispanic whites is used as a reference group. (Note: Red census tracts are areas where African Americans/Hispanics have significantly higher late-stage diagnosis rates. Blue census tracts are areas where non-Hispanic whites have significantly higher late-stage diagnosis rates). This figure appears in full colour in the online version of this article.
Racial/ethnic disparities in CRC mortality
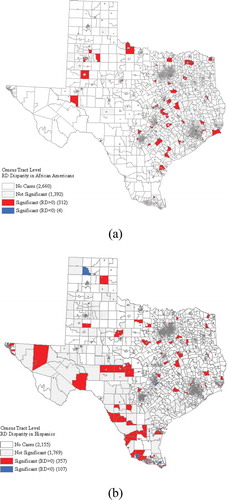
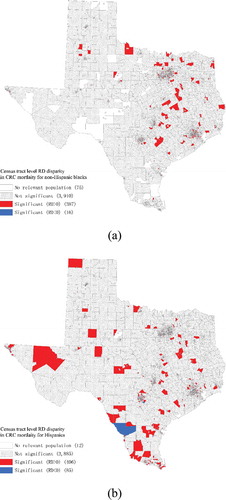
shows census tracts where CRC mortality disparities existed. Out of the 4388 census tracts, 387 (8.82%) exhibited significantly higher mortality rates among African Americans than those among non-Hispanic whites ()). These census tracts were located in the metropolitan areas of Austin-San Antonio, Dallas–Fort Worth, and Houston as well as in Eastern Texas ()). A total of 406 (9.25%) census tracts experienced significantly higher mortality rates in Hispanics. These census tracts were found in the metropolitan areas of Austin-San Antonio, Dallas–Fort Worth, and Houston as well as some other parts of Texas ()).
Figure 5. Colorectal cancer mortality disparities in African Americans (a) and Hispanics (b) when non-Hispanic whites is used as a reference group. (Note: Red census tracts are areas where African Americans/Hispanics have significantly higher mortality rates. Blue census tracts are areas where non-Hispanic whites have significantly higher mortality rates). This figure appears in full colour in the online version of this article.
Factor analysis of neighbourhood-level variables
We conducted factor analysis and principal component analysis on the 15 neighbourhood-level variables in this study. The result is reported in . Three principal components were derived which collectively accounted for 74.4% of the total variances of the 15 variables. also lists the factor loadings of the three components, which were labelled as the socio-economic factor (component 1), the geographic accessibility factor (component 2), and the demographic factor (component 3).
Table 2. Factor loadings and the proportion of variances explained by the principal components in the factor analysis (Components: 1-the socio-economic factor, 2-the geographic accessibility factor, and 3-the demographic factor).
Regression analysis
shows the ORs measuring associations between mortality disparities and some neighbourhood-level risk factors. The results suggest that there were significant associations between mortality disparities and late-stage diagnosis for both African Americans and Hispanics. African Americans in census tracts with significantly higher late-stage diagnosis rates were more likely to experience significantly higher mortality rates (OR = 4.63; 95% confidence interval [CI]:3.48–6.17) ()). The overall socio-economic status of a census tract, which can be reflected by unemployment rate, poverty rate, percentage of households with more than one person per room, and other variables shown in , was also positively associated with CRC mortality disparities for African Americans (OR = 1.18; CI: 1.06–1.32) ()).
Table 3. Results of logistic regression.
The results indicate that African Americans residing in some census tracts with better geographic access to healthcare services were still more likely to experience significantly higher mortality rates (OR = 1.75; CI: 1.54–1.99) ()). This somewhat surprising finding could be explained by the high concentration of healthcare services in metropolitan areas where significant mortality disparities existed in African Americans ()). The demographic factor of a census tract, which captures percentage of non-Hispanic African Americans, percentage of Hispanics, and percentage of linguistically isolated households at the census tract level, were negatively associated with CRC mortality disparity for African Americans (OR = 0.70; CI: 0.63 – 0.79).
) shows the results of the logistic regression analysis for Hispanics. As expected and similar to the results related to African Americans, there was a strong association between mortality disparities and late-stage diagnosis for Hispanics. A census tract with a significantly higher late-stage diagnosis rate in Hispanics was more likely to experience a significantly higher mortality rate in Hispanics (OR = 4.79; CI: 3.64–6.30). There is some level of association between socio-economic status and the presence of mortality disparities (OR = 1.18; CI: 1.05–1.33). Again, the demographic factor of a census tract was negatively associated with mortality disparities in Hispanics (OR = 0.73; CI: 0.63–0.84). The study did not identify any significant association between mortality disparities and geographic access to healthcare services in Hispanics ()).
Discussion
This study first identified census tracts in Texas where African Americans or Hispanics had significantly higher CRC late-stage diagnosis and mortality rates than non-Hispanic whites. The study then examined the presence of disparities of late-stage diagnosis, geographic accessibility to healthcare services, socio-economic status, and demographic factors as potential risk factors associated with mortality disparities. In addition to late-stage diagnosis, lower socio-economic status is associated with CRC mortality disparities among both African Americans and Hispanics in Texas.
One somewhat surprising result from this study is that African Americans living in some geographic areas with better geographic accessibility to healthcare services were more likely to have significantly higher CRC mortality rates when compared with non-Hispanic whites. The reason may be that many African Americans tend to reside in urban areas in Texas where geographic access to healthcare services is usually better than that in rural or suburban areas. For example, previous studies revealed that African Americans generally had a shorter travel time to cancer care facilities than non-Hispanic whites in urban settings (Wan et al. Citation2012a; Onega et al. Citation2010, Citation2014). In addition, minorities such as African Americans tend to have a lower rate of hospital usage, especially the usage of high-quality healthcare services related to CRC, despite their advantaged geographic accessibility to healthcare services (Huang et al. Citation2015). Additional research is certainly needed to examine this situation.
For Hispanics, this study did not observe any significant association between CRC mortality disparities and geographic accessibility to healthcare services. Findings about the impact of geographic access to healthcare services on cancer disparities reported in the literature have not been consistent (Wan et al. Citation2012a, Citation2013; Lin and Zhan Citation2014; Lin and Wimberly Citation2016). Our previous studies did not identify any significant association between geographic access to healthcare services and disparities of breast or cervical cancer among Hispanics in Texas (Tian et al. Citation2012; Lin and Zhan Citation2014). Unlike African Americans who primarily reside in urban areas in Texas, Hispanics reside in both urban and rural areas. The spatial distribution of healthcare facilities in rural areas varies greatly across geographic space, thereby affecting geographic accessibility of different rural areas to healthcare services.
Results from this study corroborate findings from previous research that geographic areas with significant cancer disparities tend to have lower neighbourhood-level socio-economic status (Tian et al. Citation2012; Lin and Zhan Citation2014). Socio-economic status is a reliable predictor for both African Americans and Hispanics experiencing higher CRC mortality rates. Results about geographic access to healthcare services suggested that minorities living in communities with lower socio-economic status, despite their relatively convenient access to sufficient healthcare resources, suffered significant CRC disparities. These results confirm that healthcare utilization is more likely to be determined by socio-economic factors, insurance coverage, knowledge of health, and other non-spatial factors rather than geographic accessibility (Henry et al. Citation2011; Huang et al. Citation2015). The Behavioural Risk Factor Surveillance System revealed that among the population of 50 years of age and older, African Americans and Hispanics were less likely to have a blood stool test or sigmoidoscopy/colonoscopy than non-Hispanic whites in Texas (Texas Center for Health Statistics Citation2003).
There are two limitations in this study. First, results about CRC disparities obtained from this study might be affected by both the small number problem and the modifiable area unit problem (MAUP). The small number problem occurs when the population size of a census tract is small. Although the population-weighted methods used in this study is powerful in mitigating the small number problem compared with traditional methods (Goovaerts, Meliker, and Jacquez Citation2007), extra precaution should be taken when interpreting the results. We suggest using the results of other spatial statistic methods to complement the results of this study if necessary. The MAUP might produce different results about disparities when different areal units are used in the analyses. Our previous study has found that although analyses conducted at the census tract level produced a larger area exhibiting disparities compared with that at other geographic area units (e.g. zip code and county polygons), census tracts offered valuable information about disparities at a finer geographic scale and were more appropriate for targeted intervention (Tian et al. Citation2010).
Second, it is possible that other factors may also contribute to the CRC disparities and these factors were not considered in the analysis of this study. Previous studies have shown that African Americans and Hispanics had different patterns of healthcare utilization (Lees, Wortley, and Coughlin Citation2005). For example, African Americans’ healthcare resource utilization may be impacted by public insurance programmes, while Hispanics may experience social and cultural barriers (Phillips, Mayer, and Aday Citation2000). However, because insurance and cultural data were not available for this study, it was not possible to include them in the analyses of this study.
Conclusion
Results from this study lead to several findings. First, the rates of both late-stage CRC diagnosis and mortality in African Americans and Hispanics are higher than those of non-Hispanic whites in approximately 7–9.25% of the 4388 census tracts in Texas based on the 2000 census data in the United States. These higher rates are statistically significant. Second, for non-Hispanic African Americans, census tracts exhibiting late-stage diagnosis and mortality disparities are located mostly in Eastern Texas as well as in major metropolitan areas of Austin-San Antonio, Dallas–Fort Worth, and Houston. For Hispanics, census tracts with late-stage diagnosis and mortality disparities are scattered in different parts of the state as well as in the three metropolitan areas mentioned above. Third, late-stage diagnosis is a risk factor that is highly associated with mortality disparities, further echoing the importance of early-stage diagnosis of CRC through screening. Fourth, lower socio-economic status is a risk factor associated with mortality disparities for both African Americans and Hispanics.
From the perspective of GIS and spatial data analysis, this study demonstrates that the availability of rich geographically referenced cancer registry data, socio-economic data, and social-environmental data, combined with the analytical power of GIS-based spatial analysis methods, has made it possible to gain additional insights about the geographic locations of cancer disparities at a fine geographic scale as well as risk factors associated with the disparities at both the individual and the neighbourhood levels. The insights from the analysis of large-scale geographically referenced data are essential for health researchers to develop more effective strategies used in targeted cancer intervention.
Acknowledgements
The research reported in this article was in part supported by a grant from the Multidisciplinary Internal Research Grant (MIRG) Program at Texas State University. The authors wish to thank the Texas Cancer Registry (TCR) and the Texas Department of State Health Service (DSHS) for providing the colorectal cancer data used in this study. The contents of this article are solely the responsibility of the authors and do not necessarily represent the official views of Texas State University, the TCR, and the Texas DSHS. Furthermore, Texas State University, the TCR, the Texas DSHS, and the authors do not endorse the purchase of any commercial products or services mentioned in this article.
Disclosure statement
No potential conflict of interest was reported by the authors.
Additional information
Funding
References
- American Cancer Society. 2016. Cancer Facts & Figures. Atlanta, GA: American Cancer Society.
- Chien, C., L. M. Morimoto, J. Tom, and C. I. Li. 2005. “Differences in Colorectal Carcinoma Stage and Survival by Race and Ethnicity.” Cancer 104 (3): 629–639. doi:10.1002/cncr.21204.
- Cooper, G. S., Z. Yuan, L. Veri, A. A. Rimm, and K. C. Stange. 1999. “Colorectal Carcinoma Screening Attitudes and Practices among Primary Care Physicians in Counties at Extremes of either High or Low Cancer Case-Fatality.” Cancer 86 (9): 1669–1674. doi:10.1002/(SICI)1097-0142.
- Coughlin, S. S., S. Leadbetter, T. Richards, and S. A. Sabatino. 2008. “Contextual Analysis of Breast and Cervical Cancer Screening and Factors Associated with Health Care Access among United States Women, 2002.” Social Science & Medicine (1982) 66 (2): 260–275. doi:10.1016/j.socscimed.2007.09.009.
- Goovaerts, P., J. R. Meliker, and G. M. Jacquez. 2007. “A Comparative Analysis of Aspatial Statistics for Detecting Racial Disparities in Cancer Mortality Rates.” International Journal of Health Geographics 6 (1): 32. doi:10.1186/1476-072X-6-32.
- Henry, K. A., F. P. Boscoe, C. J. Johnson, D. W. Goldberg, R. Sherman, and M. Cockburn. 2011. “Breast Cancer Stage at Diagnosis: Is Travel Time Important?” Journal of Community Health 36 (6): 933–942. doi:10.1007/s10900-011-9392-4.
- Huang, L. C., T. B. Tran, M. Yifei, J. V. Ngo, and K. F. Rhoads. 2015. “Factors that Influence Minority Use of High-Volume Hospitals for Colorectal Cancer Care.” Diseases of the Colon & Rectum 58 (5): 526–532. doi:10.1097/DCR.0000000000000353.
- Jemal, A., L. X. Clegg, E. Ward, L. A. G. Ries, X. C. Wu, P. M. Jamison, P. A. Wingo, H. L. Howe, R. N. Anderson, and B. K. Edwards. 2004. “Annual Report to the Nation on the Status of Cancer, 1975–2001, with a Special Feature regarding Survival.” Cancer 101 (1): 3–27. doi:10.1002/cncr.20288.
- Lees, K. A., P. M. Wortley, and S. S. Coughlin. 2005. “Comparison of Racial/Ethnic Disparities in Adult Immunization and Cancer Screening.” American Journal of Preventive Medicine 29 (5): 404–411. doi:10.1016/j.amepre.2005.08.009.
- Lim, J.-W., and K. T. Ashing-Giwa. 2011. “Examining the Effect of Minority Status and Neighborhood Characteristics on Cervical Cancer Survival Outcomes.” Gynecologic Oncology 121 (1): 87–93. doi:10.1016/j.ygyno.2010.11.041.
- Lin, Y., and F. Benjamin Zhan. 2014. “Geographic Variations of Racial/Ethnic Disparities in Cervical Cancer Mortality in Texas.” Southern Medical Journal 107 (5): 281–288. doi:10.1097/SMJ.0000000000000100.
- Lin, Y., M. Schootman, and F. Benjamin Zhan. 2015. “Racial/Ethnic, Area Socioeconomic, and Geographic Disparities of Cervical Cancer Survival in Texas.” Applied Geography 56 (1): 21–28. doi:10.1016/j.apgeog.2014.10.004.
- Lin, Y., and M. C. Wimberly. 2016. “Geographic Variations of Colorectal and Breast Cancer Late-Stage Diagnosis and the Effects of Neighborhood-Level Factors.” The Journal of Rural Health. Advance online publication. doi:10.1111/jrh.12179.
- Myers, R. E., R. Sifri, T. Hyslop, M. Rosenthal, S. W. Vernon, J. Cocroft, T. Wolf, J. Andrel, and R. Wender. 2007. “A Randomized Controlled Trial of the Impact of Targeted and Tailored Interventions on Colorectal Cancer Screening.” Cancer 110 (9): 2083–2091. doi:10.1002/cncr.23022.
- Onega, T., E. J. Duell, X. Shi, E. Demidenko, and D. Goodman. 2010. “Influence of Place of Residence in Access to Specialized Cancer Care for African Americans.” The Journal of Rural Health 26 (1): 12–19. doi:10.1111/j.1748-0361.2009.00260.x.
- Onega, T., R. Hubbard, D. Hill, C. I. Lee, J. S. Haas, H. A. Carlos, J. Alford-Teaster, et al. 2014. “Geographic Access to Breast Imaging for US Women”. Journal of the American College of Radiology 11 (9): 874–882. doi:10.1016/j.jacr.2014.03.022.
- Phillips, K. A., M. L. Mayer, and L. A. Aday. 2000. “Barriers to Care among Racial/Ethnic Groups under Managed Care - Ethnic Minorities Continue to Encounter Barriers to Care in the Current Managed Care-Dominated US Health Care System.” Health Affairs 19 (4): 65–75. doi:10.1377/hlthaff.19.4.65.
- Siegel, R., C. DeSantis, and A. Jemal. 2014. “Colorectal Cancer Statistics, 2014.” CA-A Cancer Journal For Clinicians 64 (2): 104–117. doi:10.3322/caac.21220.
- Texas Center for Health Statistics (CHS). 2003. “Texas Behavioral Risk Factor Surveillance System Survey Data.” Accessed May 2015. https://www.dshs.texas.gov/chs/brfss/query/brfss_form.shtm.
- Tian, N., P. Goovaerts, F. Benjamin Zhan, T. Edwin Chow, and J. Gaines Wilson. 2012. “Identifying Risk Factors for Disparities in Breast Cancer Mortality among African-American and Hispanic Women.” Women’s Health Issues 22 (3): e267–76. doi:10.1016/j.whi.2011.11.007.
- Tian, N., P. Goovaerts, F. Benjamin Zhan, and J. G. Wilson. 2010. “Identification of Racial Disparities in Breast Cancer Mortality: Does Scale Matter?” International Journal of Health Geographics 9 (1): 35. doi:10.1186/1476-072X-9-35.
- Vernon, S. W. 1997. “Participation in Colorectal Cancer Screening: A Review.” Journal of the National Cancer Institute 89 (19): 1406–1422. doi:10.1093/jnci/89.19.1406.
- Wan, N., F. B. Zhan, Y. Lu, and J. P. Tiefenbacher. 2012a. “Access to Healthcare and Disparities in Colorectal Cancer Survival in Texas.” Health & Place 18 (2): 321–329. doi:10.1016/j.healthplace.2011.10.007.
- Wan, N., F. B. Zhan, B. Zou, and E. Chow. 2012b. “A Relative Spatial Access Assessment Approach for Analyzing Potential Spatial Access to Colorectal Cancer Services in Texas.” Applied Geography 32 (2): 291–299. doi:10.1016/j.apgeog.2011.05.001.
- Wan, N., F. B. Zhan, B. Zou, and J. Gaines Wilson. 2013. “Spatial Access to Health Care Services and Disparities in Colorectal Cancer Stage at Diagnosis in Texas.” The Professional Geographer 65 (3): 527–541. doi:10.1080/00330124.2012.700502.
- Zhan, F. B., and Y. Lin. 2014. “Racial/Ethnic, Socioeconomic, and Geographic Disparities of Cervical Cancer Advanced-Stage Diagnosis in Texas.” Women’s Health Issues 24 (5): 519–527. doi:10.1016/j.whi.2014.06.009.