
ABSTRACT
Urbanization is typically demonstrated by expansion of a city’s infrastructure, mainly development of its roads and buildings. In particular, transportation infrastructure is a key indicator of growth in the city since transportation is the backbone of economic development and prosperity. Recent advances in satellite imagery, in terms of improved spatial and temporal resolutions, enable efficient identification of change patterns and prediction of built-up areas. In this study, two approaches were adopted to quantify and assess the pattern of urbanization. The first approach relied on extracting linear features (buildings and roads) from multi-temporal satellite images, where image-to-image registration was utilized based on linear features with Modified Iterated Hough Transform as matching criteria. The second approach relied on extracting linear features from vector (digitized) data. The latter approach complemented the first one by distinguishing between roads and buildings. The proposed methodology was then applied to Sharjah City, United Arab Emirates, as a case study. Results show that the urbanized area of the city almost quadrupled during 1976–2016. Growth in buildings and roads was generally consistent until 2005, after that the spatial growth witnessed a steep increase due to vertical expansion. To assess the accuracy of the utilized edge images and change detection, error matrices were prepared for the case study. An overall accuracy of more than 84% was achieved. The proposed methodology was successful in quantifying urban growth in the study area.
Introduction
Urbanization is a regular consequence of cities’ population growth and infrastructure development. Urban growth refers to any expansion in a city in terms of increased buildings and roads. Transportation systems in particular are vital to promote economic prosperity and urban development, as they provide access to business activities, employment, education and recreational opportunities. The adequacy of transportation infrastructure, whether it is for roadway transportation, public transportation or even air transportation, has a great impact not only on urban development but also on sustainability of a city (Abdullahi et al. Citation2015). Often, urban development and transportation systems grow in parallel; hence, the expansion of transportation infrastructure and buildings is often considered synonymous with urban growth. Since urbanization (i.e. increase in the number of people and accompanying growth in infrastructure, both horizontally and vertically) varies spatially and temporally, it is therefore of high interest for government officials, planners, decision makers and researchers to obtain quantifiable records for the spatial and temporal growth of any city, mainly in terms of transportation infrastructure and buildings (Azari et al. Citation2016).
Generally, the basis of detecting urbanization is through applying change detection, which is the process of identifying differences in the state of an object or phenomenon by observing it at different times (Singh Citation1989). It involves the ability to quantify changes using multi-resolution, multispectral and/or multi-source imagery captured at different times. Traditional change-detection studies are based on visual/manual comparison of temporal datasets, such as satellite scenes, aerial images or maps. However, the huge flux of imagery that is being captured by an ever-increasing number of earth-observing satellites necessitates development of automatic, reliable and fast change-detection techniques. Such techniques are essential to reducing the high cost associated with spatial data-updating activities. Several change-detection methods have been developed and reported in previous studies (Al-Ruzouq and Habib Citation2012; Bruzzone and Prieto Citation2000; Dowman Citation1998; Peneva-Reed Citation2014; Singh Citation1989). These procedures are based on image subtraction, image ratio, change vector analysis, principal component analysis, neural network or morphological mathematics.
Essential to change detection of imagery data is the process of image registration, which aims at geometrically aligning two or more images so that corresponding pixels and/or their derivatives (edges, corner points etc.) representing the same underlying structure in physical space may be integrated or fused. Traditional procedures for registering an image pair require interactive/manual selection of tie points in each image. The points are then used to determine the parameters of a registration transformation function, which is subsequently used to resample one of the images into the reference frame associated with the other one. Although manual registration might be adequate for sporadic image-processing tasks, automatic registration procedures can handle large volumes of spatial data.
A considerable amount of research has been conducted to analyse spatial–temporal changes of cities around the world using different criteria and algorithms (Al-Sharif et al. Citation2013; Aljoufie et al. Citation2013; Nassar, Alan Blackburn, and Duncan Whyatt Citation2014; Yu and Ng Citation2007). Spatial–temporal analysis can be designed to focus on a single aspect or project in the city (not necessarily the whole city); for instance, Ji et al. (Citation2014) studied the spatial and temporal distribution of an expressway and its relation to land cover and population in Beijing City, China. Spatial–temporal approaches are not useful only for urban growth detecting, but their value extends to other applications. For example, Tu et al. (Citation2015) adapted a spatial–temporal demand coverage approach to locate optimized locations of electric-taxi-charging stations. Other examples include analysis of congestion in urban networks (Ji and Geroliminis Citation2011), driver gap acceptance behaviour (Abrams et al. Citation2013) and traffic activities and implications for the environment (Batterman Citation2015; Sohnen et al. Citation2015).
This paper proposes a framework methodology to analyse and characterize urbanization growth of any city; as a case study, we applied the methodology to Sharjah City, United Arab Emirates (UAE), to validate our approach. Besides being the third largest city in the UAE, Sharjah is considered the cultural capital of the country. Over the past four decades, Sharjah City has witnessed massive growth in its population, urban area and infrastructure. For instance, the population of Sharjah increased almost 10-fold between 1975 and 2005 as indicated by demographics of UAE. Quantitative measurements were obtained from multi-temporal satellite imagery based on image-processing techniques (edge extraction for linear features such as roads and buildings). Prior to change-detection implementation, image-to-image registration was conducted based on linear features to ensure accuracy of the change-detection process. Image registration was performed using the Modified Iterated Hough Transform (MIHT) (Habib and Kelley Citation2001a; Habib and Kelley Citation2001b; Habib and Al-Ruzouq Citation2004). The MIHT simultaneously estimates parameters of the registration transformation function while establishing correspondence between conjugate straight-line segments in an image pair (Al-Ruzouq and Habib Citation2012).
The main objectives of this work can be summarized as follows:
Quantifying and assessing the pattern of urbanization in Sharjah City based on multi-temporal satellite images.
Utilizing linear features (buildings and roads) shown in the multi-temporal satellite images for reliable image-to-image registration as well as the basis of change detection.
Using the MIHT for estimating the parameters of the registration transformation function while establishing correspondence between conjugate straight-line segments in an image pair.
Validating the extracted features and change detection using digitized linear features from multi-temporal Google® images.
The next section discusses the proposed methodology applied to quantify urban growth of Sharjah City, followed by sections discussing description of the study area, the utilized data and results of applying the proposed methodology, and the paper concludes with a summary of major findings and recommendations for future research.
Methodology
shows the framework of the proposed methodology. Prior to applying any reliable change-detection approach, image registration is essential to ensure that conjugate features on the multi-temporal images belong to the same features on the ground. The registered images therefore were used to quantify the changes representing urbanization using two approaches. The first approach relied on image-processing techniques and accurate image registration procedures using multi-temporal Landsat satellite images. It utilized the derived edges (roads and buildings) from images as the basis of change detection. The second approach relied on digitized features to provide a ground truth for the change detection. Our methodology utilized edge images that mitigate the sensitivity to the surface reflectance of bands of Landsat images and the effect of radiometric differences between the images in question.
Figure 1. Framework of proposed methodology.
Image registration
Image registration is a prerequisite for reliable change detection (Al-Ruzouq and Habib Citation2012). The process aims at spatially aligning two images so that corresponding pixels in the image space belong to same feature in the physical space. In this study, image registration has been implemented on the collected Landsat and Google images that have different spatial and temporal resolutions. Linear features (i.e. roads and buildings) having high semantics were extracted from the Landsat images and used for image registration and change detection (Al-Ruzouq and Habib Citation2012).
The registration procedure also involves establishing a transformation function which mathematically describes the mapping between the imageries in question. In other words, given a pair of images, reference and input images, the transformation function attempts to properly overlay these images. Habib and Al-Ruzouq (Citation2004) showed that affine transformation, shown in Equation 1, could be used as the registration transformation function for imagery captured by satellite-imaging systems with narrow angular field of view over relatively flat terrain as compared to the flying height.
where is the scale factor along x-axis,
is the Scale factor along y-axis,
is the non-orthogonality angle,
and
is the shifts in x and y direction,
is the rotation angle, x and y is the image coordinates in the reference image and x′ and y′ is the corresponding image coordinates in the input image.
The next step in the registration process is the selection of the similarity measure, which mathematically describes the necessary constraints for ensuring correspondence of conjugate features. The similarity measure formulation depends on the selected registration features and their respective attributes. As mentioned before, the registration features, using straight lines, are represented by their end points, which need not be conjugate (Habib and Al-Ruzouq Citation2004). The similarity measure should mathematically describe the fact that the line segment from one image will coincide with the corresponding line segment from the registered image after applying the transformation function relating the reference and input images. Such a measure can be derived by forcing the normal distances between the end points of a line segment in the reference image, after applying the transformation function and the corresponding line segment in the input image to be zero (Al-Ruzouq and Habib Citation2012).
In this research, the authors utilized MIHT as the matching strategy. Such a methodology is attractive since it enables simultaneous matching and parameter estimation. Moreover, it does not require complete correspondence between the features in the reference and input images. MIHT has been successfully implemented in several photogrammetric operations, such as automatic single-photo resection and relative orientation (Habib and Kelley Citation2001a, Citation2001b). Once the registration features, transformation function, similarity measure and matching strategy have been selected, they are integrated into an automatic registration procedure (Habib and Al-Ruzouq Citation2004). The accuracy of the registration process is the key factor that controls the validity and reliability of the change-detection outcome.
Change detection using image processing
After deriving parameters of the registration transformation function, any image can be resampled into the reference frame associated with another image. Within the resampled images, corresponding pixels are assumed to point at the same object space feature. Therefore, a simple pixel-by-pixel comparison/differencing between the resampled images could be used to highlight object space changes (Al-Ruzouq and Habib Citation2012). However, radiometric differences should be expected as a result of varying atmospheric conditions and/or different sensor types. The effects of these differences can be reduced by applying intensity-normalization techniques to the images in question to ensure that they have the same intensity mean and variance values (Zhang, Chen, and Lu Citation2015). This procedure would be still unreliable since it would be affected by the noise and spectral properties associated with the input imagery (Agouris Citation2000; Canny Citation1986; Cavallaro and Touradj Citation2001). Instead of working with the original images after intensity modification, derived edge images can be used as a basis for the change-detection procedure (Al-Ruzouq and Habib Citation2012).
Extraction of linear features from remotely sensed imagery has been the subject of extensive research over several decades (Hu and Tao Citation2004; Lacoste, Descombes, and Zerubia Citation2005; Quackenbush Citation2004; Song and Civco Citation2004). Linear feature extraction is particularly related to spatial resolution (Wang and Zhang Citation2000), where improvements in spatial resolution provide the potential for automatically extracting linear features (Penn and Livo Citation2002). The long-time availability, ease of public accessibility and relatively low cost of moderate resolution images such as Landsat increase the need to use moderate spatial resolution images as an alternative of high spatial resolution images. Several studies report feature extraction using multispectral moderate resolution images such as Landsat (Fitton and Cox Citation1998; Hashim et al. Citation2013; Liu and Jezek Citation2004; Wang and Zhang Citation2000).
There are many edge-detection algorithms developed for remotely sensed images (Canny Citation1986; Han, Yang, and Jiang Citation2015; Perona and Malik Citation1990). In this study, the Canny algorithm (Canny Citation1986) was used as linear features extractor where edge pixels were derived from the reference and resampled input images. The suitability of Canny Edge Detection refers to utilization of Gaussian filters that result in good detection, good localization and a single response to an edge (Hashim et al. Citation2013). The algorithm starts by smoothing the image and reducing the noise using Gaussian filters, followed by determining the gradient magnitude and direction for each pixel in the target image. The pixels that have specific differences from the surrounded pixels (threshold) would be classified as edge pixels.
Utilizing the edge images has two advantages: first, derived edges are robust to possible radiometric differences between the registered images (e.g. due to noise and/or different spectral properties); and second, the edges would correspond to interesting features, such as building boundaries, roads and trails. Therefore, comparing edge images is useful in quantifying urbanization, which is one of the most important objectives of this study.
In summary, the suggested change-detection methodology started by extracting edge cells using Canny Edge Detection (Canny Citation1986). To compensate for small geometric differences between the imagery (in the order of few pixels), a majority filter was used to fill small gaps within an area with numerous edges, as well as to eliminate isolated edges. The filtered images highlighted areas with interesting features since they would lead to a dense distribution of edge cells; subsequently, the filtered images were subtracted to highlight areas of change. Finally, a majority filter was applied to the difference image to eliminate small areas.
Change detection using spatial analysis of digitized features
The second approach to quantifying the changes representing urbanization relied on digitizing features from high-resolution (3 m) Google Earth and moderate-resolution (30–60 m) Landsat images captured in different years. Digitizing is simply defined as the process of ‘tracing’, in a geographically correct way, information from images/maps, such as buildings, roads and land characteristics. The accuracy of image-to-image registration plays a significant role in reliable change-detection results. In addition, the output of this approach provides the basis to build library maps for multiple years that can integrate information, visualize scenarios, present powerful ideas and develop effective solutions (Manjula, Jyothi, and Varma Citation2010).
To provide a ground truth for the change-detection analysis by the image processing mentioned in the previous section, growth detection is conducted using digital geographic features, namely land cover/land use (LC/LU) data. While historical LC/LU polygon data are available in many countries, such detailed data are missing in other countries. If such data are missing, one can use the digitization process to convert geographic features on a map into a digital format. Having map features in a digital format allows for various types of spatial analyses and interpretation. Examples of such analyses include calculating geometric properties of features and identifying topological relationships among features.
The following are the general steps undertaken during the digitization process:
Register image to assign real-world locations to digitized features.
Separate features into layers with each layer representing one type of feature. For example, roads could be represented as lines whereas city neighbourhoods and buildings could be represented as polygons.
Trace the lines representing boundaries of a LC/LU while using ‘snapping’ tool to ensure interconnecting lines are actually joined together to form a closed area (polygon), thus minimizing many of the digitization errors.
Assign attribute data to the digitized feature, such as assigning the type of LC/LU as buildings, roads etc.
Check digitization errors among features of the same layer (such as connectivity, undershooting/overshooting etc.) and errors among related features existing in different layers (such as overlapping and undefined spaces).
Change detection using digitized features (vector data) is accomplished by computing the geometric areas of the polygons representing the various types of LC/LU. For our case study, several features were digitized, including undistributed soil, compacted soil, green area, water, buildings, roads, paved parking and others (undistinguished features). Since this study focused on urbanization elements (roads and buildings), the other features were digitized for completeness and to compute the percentage of development and growth of various features with respect to each other and to the total area of the city.
Data collection and processing
The proposed framework has been applied to Sharjah City in the UAE, a city located in the northern part of the UAE along the northern coast of the Arabian Gulf of the Arabian Peninsula (central coordinates of 25.3°N 55.5°E). It has a dry semiarid climate with a daily high temperature of 24–42°C and a daily mean temperature of 18–34°C. Sharjah City, and the UAE in general, has faced massive urbanization and expansion since the 1970s.
Quantitative detection of urban growth and development is extremely significant for policymakers and local authorities for effective long-term planning and successful future development. ,) shows the UAE map with respect to its neighbouring countries and the study area of Sharjah City, respectively. The study area extended over ~136.77 km2.
Figure 2. The study area: (a) location map and (b) Sharjah City.
Multi-source, multi-resolution and multi-temporal imagery for Sharjah City were used in this study. Satellite images with different radiometric and geometric resolutions were captured for different years. Two types of image sources were utilized in this study: Landsat and Google Earth. Landsat satellite images with the highest available spatial resolution were selected based on their availability while maintaining approximately a 10-year analysis period. Similarly, Google Earth multi-temporal images were acquired to represent ground truth; therefore, time synchronization with selected Landsat images was considered, in addition to selecting the highest possible spatial resolution image (i.e. 3 m). It has to be mentioned that historical reference maps are not available for the study area. Therefore, digitized images from registered multi-temporal Google images (3 m spatial resolution) were prepared and used as a reference for all Landsat images. lists each image used including the source, the year of capturing the image and its spatial resolution in metres. In summary, eight images were captured and geo-referenced to cover the spatio-temporal aspects of the study area. shows all the Landsat images for the study area for the years 1976–2016, while shows a sample of mosaic Google Earth images with 3-m ground resolution. Such high resolution enabled accurate digitizing of the linear features, namely roads and buildings of the city.
Table 1. Landsat images captured over 40 years period.
Figure 3. Multi-temporal Landsat images for Sharjah City.
Figure 4. Google Earth geo-referenced images for Sharjah City.
Results and discussion
This section presents a summary of the resulting maps, quantification and validation that took place over the course of this research for the chosen case study (i.e. Sharjah City, UAE). The section consists of four subsections:
The first subsection discusses the outcome of the image-processing technique utilizing Canny Edge Detection, as well as the subjective validation of these results using visual detection of anomalies.
In the second subsection, the outcome of the digitizing analysis is presented and discussed thoroughly. It is worth reminding here that the results of the digitization were used as a ground truth to verify the outcome of the first approach.
The third subsection shows the quantified pace of urbanization expansion that took place in Sharjah City during the last four decades. The Annual Urban Spatial Expansion Index (AUSEI) that was proposed by Aljoufie et al. (Citation2013) was adopted mainly for this purpose.
Finally, the fourth subsection presents an accuracy assessment of edge and difference images using digitized features as ground truth.
Image processing analysis
Image registration, image resampling, linear feature extraction, majority filter and change detection have been implemented sequentially on the collected Landsat images that have different spatial and temporal resolutions as previously described. ) shows two samples of the registered images (for 1987 and 2010), whereas ) shows the edge images (using Canny Edge Detection with encashment and thresholding) that belong to roads and buildings.
Figure 5. Landsat images for years 1987 and 2010: (a) registered images and (b) edge images.
shows the difference image from 1987 until 2010. In the difference image, black areas indicate changes while white areas indicate parts with no changes. Based on the processed edge images and the difference/change images, the areas of edges for roads and buildings were calculated and are shown in . shows a graphical representation of the urbanization growth over 40 years.
Table 2. Area of roads and buildings over the 40-year period in Sharjah City.
Figure 6. (a) Multi-temporal Landsat image for Sharjah City years 2010 and 1987 and (b) change-detection image where black pixels represent change.
Figure 7. Urban growth from 1976 to 2016 based on image processing.
As shown in , one can visually notice the urbanization trend in Sharjah City. A pattern of regular expanding off the coastal areas can be viewed over the 40-year period. This expansion extends towards the southeastern parts of the city. Another observation is the concentration of the buildings and roads in the downtown area in 1987. Moreover, a remarkable change has occurred in the waterbody in the southwestern part of the city, where some waterbodies have been reshaped as part of the city’s plan to attract tourists and vacationers. An interesting change can be noticed after 2000 when the extreme southeastern part of the city started to host residential and commercial real estate as a result of establishing Sharjah University City, the hub of tertiary education in Sharjah. Edge images, such as those shown in , can significantly enhance visual inspection and the observer’s ability to interpret various events and patterns of city development.
– can be utilized for visual inspection of the city’s development from 1976 to 2016. shows the efficiency of detecting linear features such as roads; for instance, ) shows the limited roadway network in 1987, whereas ) shows the expansion of the roadway network in the same area that occurred by 2000 as part of infrastructure development. The change in buildings can also be clearly noticed as shown in . While ) shows the buildings detected in the northwestern part of the city, ) shows the buildings in the newly developed area around Sharjah University City.
Figure 8. Detected road features in resulting edge images.
Figure 9. Detected building features in resulting edge images.
Figure 10. Urban growth of downtown Sharjah City in resulting edge images.
By 2000, the downtown area was well developed despite space being very limited for horizontal development. Nevertheless, the area continued its development trend within the limited space and these developments were observed and quantified where more clustered edges appeared. ,) shows the downtown area in 2010 and 2016, respectively, with edges classified as roads and buildings. ,) also shows a noticeable development around Al-Mamzar lagoon that took place after 2010.
Overall, – facilitate visual inspection of the edge images to show the detected linear features (i.e. roads and buildings). This is essential for tracking the development trend as well as for verification of the various major events affecting Sharjah’s development over the past four decades.
Digitized features analysis
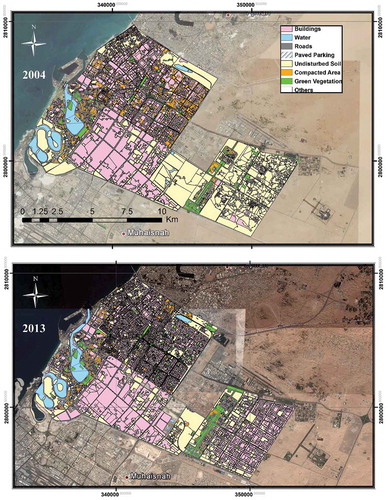
Because of unavailability of LC/LU data for the study area, the researchers used multi-temporal Google Earth images (3-m resolution) to digitize the various features needed to quantify urbanization trends of Sharjah City. The digitized features were classified into the following eight classes: roads, buildings, paved parking, compacted soil, undisturbed soil, green area, water and other. Though the focus of this paper is on urbanization (i.e. road and building features only), other features were digitized to capture the whole features of the city and to take advantage of using such data in future research. As an example, shows digitized LC/LU features from the 2004 and 2013 geo-referenced Google Earth images. Expansion of the road and street network can be easily visualized in the newly developed parts of the study area at the lower right corner (southeast part of the city).
Figure 11. Digitized land cover/land use features for Sharjah City for 2004 and 2013.
For a reliable change detection and area development assessment, the polygon areas of the different features among the three collected years (i.e. 1976, 2004 and 2013) were calculated. summarizes the results of the various LC/LU areas; shows graphically the growth of these features over the years.
Table 3. Areas of the digitized land cover/land use features for 1976, 2004 and 2013.
Figure 12. Distribution of digitized land cover/land use features for 1976, 2004 and 2013.
While roads formed about 2% of the total area of the city in 1976, they accounted for more than 12% in 2013. Similarly, buildings accounted for nearly 22% in 1976 but more than doubled to reach about 46% in 2013. It can be noted that roads and building development did not necessarily grow in parallel. For instance, roads developed almost fourfold whereas buildings only doubled during the analysis period. This could be attributed to the fact that Sharjah City witnessed a horizontal expansion of buildings in the first two decades but more of vertical expansion of buildings in the last two decades.
As a result of road and building expansion, land coverage by other features decreased over the study period. For example, while almost 72% of land in the city was classified as soil in 1976, this percentage decreased to around 36% in 2013. Moreover, green and water areas increased as shown in . This is an indication of the aggressive development plan of the local government to reduce land degradation and prevent desertification. shows the areas covered by roads and buildings for 1976, 2004 and 2013, whereas shows trends of urbanization development (in terms of roads and buildings) in addition to the city’s population.
Figure 13. Growth trends of roads and buildings for 1976, 2004 and 2013.
Figure 14. Urbanization (roads and buildings) and population trends based on digitized features.
The analysis of and reveals the following:
shows the expansion trend of roads and buildings. Consistency was observed until 2005 with growth of buildings and roads almost parallel. Starting in 2005, road spatial expansion witnessed a steep increasing trend compared to building expansion. This could be explained by increasing vertical expansion in the city.
As can be noticed in , total urbanization trends showed a consistent increase in terms of urbanization and population in the period of 1976–1995. From 1995 until 2004, population grew in a steeper trend than urbanization. As discussed earlier, the reason behind this is likely the vertical expansion of Sharjah City. From 2004 until the recent years, this trend (i.e. population growing in a steeper trend than urbanization) was sustained, but with a little fluctuation in the population during some years. The authors believe that economic crisis affected the exponential trend of population in recent years.
Quantifying urbanization growth
To quantify urbanization growth in Sharjah, the authors utilized the AUSEI proposed by Aljoufie et al. (Citation2013). The index describes the temporal changes of an urban area in terms of its annual urban growth rate, computed as follows:
where AUSEI is the Annual Urban Spatial Expansion Index for year t; and
are the total urban areas of the study area in hectares at current year t and former year t − 1, respectively, and
is the total number of years from current year t and former year t − 1, respectively.
AUSEI was applied to both approaches (i.e. image processing using Canny Edge Detection and spatial digitization). This subsection starts by presenting the AUSEI results and discusses them for the first approach, then the second, and finally gives a comparison between the two. shows the total urban area (extracted using Canny Edge Detection) and the computed AUSEI indices during the past 40 years. shows graphically the same results in addition to the city’s population.
Table 4. Urban areas and AUSEI results based on edge images from 1976 to 2016.
Figure 15. Urbanization (roads and buildings) and population trends based on edge images.
The analysis of and reveals the following:
Overall, Sharjah City has witnessed a substantial expansion of its urban area during the period 1976–2016. While urbanized area constituted slightly more than 22% of the total area in 1976, it has considerably expanded to make up roughly 92% in 2016 (almost quadrupled during this period).
From 1976 to 1987, the urban area increased from 30.70 to 68.08 km2 with an annual growth rate (using AUSEI) of about 5%. Unsurprisingly, this high growth rate coincided with the period of the oil economy flourishing in the country.
During 1987 until 2000, urbanization in the city continued but at a much slower pace (i.e. AUSEI of 0.8%). Nevertheless, the population during this period increased significantly. For instance, the population in 1985 was about 170,000 but more than doubled (to around 450,000) in 2000. In contrast, urban growth did not follow the same exponential growth in population, clearly seen in . One can explain this observation by the fact that Sharjah City has witnessed a massive vertical expansion manifested by the construction of tens of mid- and high-rise buildings.
With the boom in UAE economy during the period from 2000 to 2007, Sharjah City witnessed a second rapid annual spatial growth of about 5%, whereas the population increased by around 77% (from 450,000 to 700,000) during the same period. These numbers also point to continuing vertical expansion. During this period, the city continued to grow at a reasonable pace (AUSEI of 1.7%). A slightly lower urbanization index (AUSEI of 1.3%) was found for the period 2010–2016, which indicates that the worldwide economic crisis of this period did not necessarily slow down urbanization in Sharjah City.
In summary, the results of this analysis confirmed the massive expansion of Sharjah City during the past four decades. Different urbanization indexes were observed: higher growth rates were generally observed during periods of flourishing economy. While this approach demonstrated overall urbanization of the city, it lacked the means to differentiate between growth in buildings and roads quantitatively. Sometimes, it may be crucial to assess the different growth rates of buildings and roads to ensure that expansion of roadway infrastructure keeps pace with growth in housing and buildings.
As for the second approach (i.e. spatial digitization), as mentioned earlier, the AUSEI index was chosen (see Equation 2) to quantify the results of this approach. summarizes urbanization of the city in terms of roads and building development. The table also shows the total urban area and the computed AUSEI indices from 1976 to 2013.
Table 5. Urban areas and AUSEI results based on digitized features for 1976, 2004 and 2013.
To compare the two approaches of this study, combines results of both analyses. As can be seen in , the two approaches showed a relatively similar trend of growth. However, the two approaches did not quantitatively match. This difference can be justified as follows. First, the image-processing approach depends on a threshold value which differentiates between linear features (i.e. roads and buildings) and other features. Such a threshold largely depends on the radiometric properties of the multi-temporal images where some features that do not belong to buildings and roads can be captured in case an inaccurate threshold is used. In addition, the coarse resolution of the used Landsat images (i.e. 60 m in 1976) negatively affected detection of these features. Second, results of the digitized road and building areas have their own problems as well. Human error in digitizing features resulted in missing many features on the ground. Furthermore, the coarse resolution of the images utilized during digitizing processes contributed to the decreasing percentage of captured areas of buildings and roads.
Figure 16. Comparison of urbanization and population trends based on edge images and digitized features.
In summary, the two approaches complemented each other in demonstrating urbanization patterns in Sharjah City. The first approach, which depended on image processing, was easy to implement with minimum human effort. It was less sensitive to utilizing images with various spatial resolutions. However, this approach cannot differentiate roads and buildings from each other. The second approach, which depended on digitized features, could differentiate between various features, and therefore, it allowed for more detailed comparison between the urban features (roads vs. buildings). Its major disadvantages are that it is prone to human error and it is resource-consuming.
Though the presented AUSEI results in this subsection are interesting, the need to assess accuracy of the generated linear features from the image-processing technique numerically is obvious. The following subsection will discuss the conducted effort regarding this matter.
Accuracy assessment
A literature review shows a variety of different techniques for assessing classified and processed images. One such technique is the error matrix (Congalton Citation1991). The error matrix is structured as a square array of numbers (rows and columns) where each cell number is expressed in its sample unit (pixels). The value of each cell represents the number of sample units assigned to a particular category relative to the actual (reference) category, as verified by the ground truth. Usually, the columns show reference data (ground truth), whereas the rows show results of the processed data such as classified images, extracted edges or change pixels. In this study, we randomly selected 50 sample points within the study area to audit the accuracy of the detected edges.
Error matrices can be used to generate a number of performance measures, namely overall accuracy, producer’s accuracy and user’s accuracy (Chen, Huang, and Xu Citation2017; Congalton Citation1991; Foody Citation2002). The overall accuracy is computed by dividing the total correct records (the sum of the diagonal in the error matrix) by the total number of records (pixels in our case) in the error matrix. Overall accuracy is appropriate for a general assessment of the method; however, it does not provide the distribution of errors among the classes (edges and non-edges) (Congalton Citation1991). To advance our analysis, we also computed the producer’s and user’s accuracies that represent the exclusion (omission) error and inclusion (commission) error, respectively. The producer’s accuracy indicates the probability of a reference category (e.g. Edges) being correctly detected from the ground truth. The producer’s accuracy is calculated by dividing the correct samples in a category by the total ground-truth samples in that category. On the other hand, the user’s accuracy is calculated by dividing the total number of correct samples in a category by the total number of samples that were detected in that category. It is called the ‘user’s accuracy’ because it indicates the probability that a detected edge on the image is an actual edge on the ground (Congalton Citation2001; Story and Congalton Citation1986).
In this study, three error matrices (as shown in ) were prepared to assess the accuracy of the extracted linear features using the Canny Edge Detection algorithm as well as the difference between two edge (or linear features) images. The first error matrix was used to verify the extracted edges for 1987 ((a)), while the second was for 2010 ((a)). The third error matrix was used to verify the change difference of edges between the years 2010 and 1987 ((b)). Analysis of reveals the following points:
The overall accuracy of the 1987, 2010 and the 2010–1987 difference/change images were around 86%, 92% and 84%, respectively. Generally, this indicates the effectiveness of the utilized image-processing technique in this study to detect accurately the linear feature. The overall accuracy of the 2010 image was better than the 1987 image by 4%, which is expected as the 2010 image has higher resolution than the 1987 image.
The producer’s accuracy of the detected edges and non-edges for all the images were higher than 66%. Specifically, the producer’s accuracy of the 1987 image was 100% and 76% for edges and non-edges, respectively. Likewise, the 2010 image showed nearly similar results, i.e. near 98% and 67% for edges and non-edges, respectively. These observations indicate how well the adopted image-processing technique was in producing (or detecting) edges and non-edges from the ground and reflecting them on the produced images.
The 66% producer’s accuracy of the non-edges has been correctly classified, which means that about 34% of the non-edges were incorrectly classified. Furthermore, the producer’s accuracy of the non-edges for the 1987 image was better than that for the 2010 image (76% vs. 67%). This can be justified by the increasing complexity of the 2010 image in terms of intertwined urban areas which made it more difficult to classify as compared to the 1987 image.
The user’s accuracy values for all cases were higher than 75%. This indicates that the used image-processing technique did not aggressively overestimate detecting edges and non-edges from the ground. By comparing the producer’s accuracy and user’s accuracy for all cases, one can notice that both the producer’s and user’s accuracies showed nearly comparable results. This indicates that the utilized image-processing technique had a balanced performance in terms of detecting linear features from the ground, and neither overestimating nor underestimating them in the produced images.
Table 6. Accuracy assessment of 1987 and 2010 edge images and the 1987–2010 difference/change image.
Conclusion
This paper presented two approaches for detecting urbanization growth and patterns. Multi-temporal satellite images with various spatial and radiometric resolutions have been used. The first approach detected edges (roads and buildings) using the Canny Edge Detection operator. The MIHT was utilized for reliable and accurate image registration. Pixel-to-pixel subtraction was used for change detection. The second approach directly utilized digitized features from registered images to detect urbanization.
As a case study, the proposed methodology was applied to detect urbanization growth in Sharjah City, UAE. To apply the first approach, the authors utilized Landsat images from 1976 to 2016. Both Landsat and registered Google images were utilized for the second approach. The results of both approaches revealed that Sharjah City has experienced dramatic urbanization expansion comparable to its population growth over the past 40 years. While urbanized areas constituted slightly more than 22% of the total area in 1976, urbanization has considerably expanded to cover roughly 92% in 2016. The authors also computed the AUSEI to quantify the urbanization rate for Sharjah City. For example, it was found that the city’s highest AUSEI (rate of 5%) occurred between 1976 and 1987, which coincided with a period of the oil economy flourishing in the country. Separate growth rates for buildings and roads have been estimated based on digitized features. The major elements of urbanization (roads and buildings) have shown growth parallel to growth in population. Nevertheless, a steeper increase in growth of roads compared to buildings was witnessed in recent years, justified by vertical expansion in the city. The two approaches should be viewed as complementary to each other in terms of detailed results and effort. The proposed methodology can be easily generalized to assess urbanization growth in other cities.
To assess the accuracy of the proposed methodology, three error matrices for the following edge images were utilized as a sample: 1987, 2010 and the 2010–1987 Change Difference. A total of 50 sample points were randomly selected across the study area to construct these error matrices. Three performance measures (i.e. overall accuracy, producer’s accuracy and user’s accuracy) were utilized. Our analysis revealed that an overall accuracy of more than 84% was achieved. In addition, the used image-processing technique had a balance performance in terms of detecting the linear features from the ground, and neither overestimating nor underestimating them in the produced images.
Finally, future research will concentrate on using high-resolution images for change detection and simultaneously establishing ground truth for quantitative evaluation of the proposed methodology. In a different context, the researchers will attempt to apply the proposed methodology to study environmental impacts of urbanization in Sharjah City.
Disclosure statement
No potential conflict of interest was reported by the author.
References
- Abdullahi, S., B. Pradhan, S. Mansor, and A. R. M. Shariff. 2015. “GIS-Based Modeling for the Spatial Measurement and Evaluation of Mixed Land Use Development for a Compact City.” GIScience and Remote Sensing 52 (1): 18–39. doi:10.1080/15481603.2014.993854.
- Abrams, D. S., C. D. Fitzpatrick, Y. Tang, and M. A. Knodler. 2013. “A Spatial and Temporal Analysis of Driver Gap Acceptance.” Paper Presented at the Transportation Research Board 92nd Annual Meeting, 13–3237, Washington, DC, January 13–17.
- Agouris, P. 2000. “Automated Spatiotemporal Change Detection in Digital Aerial Imagery.” In Proceedings of SPIE 4054, Automated Geo-Spatial Image and Data Exploitation, 2–12, Orlando, FL, April 24. doi:10.1117/12.394101
- Aljoufie, M., M. Zuidgeest, M. Brussel, and M. van Maarseveen. 2013. “Spatial-Temporal Analysis of Urban Growth and Transportation in Jeddah City, Saudi Arabia.” Cities 31: 57–68. doi:10.1016/j.cities.2012.04.008.
- Al-Ruzouq, R. I., and A. F. Habib. 2012. “Linear Features for Automatic Registration and Reliable Change Detection of Multi-Source Imagery.” Journal of Spatial Science 57 (1): 51–64. doi:10.1080/14498596.2012.686430.
- Al-Sharif, A. A. A., B. Pradhan, H. Zulhaidi, M. Shafri, and S. Mansor. 2013. “Spatio-Temporal Analysis of Urban and Population Growths in Tripoli Using Remotely Sensed Data and GIS.” Indian Journal of Science and Technology 6 (8): 5134–5142.
- Azari, M., A. Tayyebi, M. Helbich, and M. A. Reveshty. 2016. “Integrating Cellular Automata, Artificial Neural Network, and Fuzzy Set Theory to Simulate Threatened Orchards: Application to Maragheh, Iran.” GIScience and Remote Sensing 53 (2): 183–205. doi:10.1080/15481603.2015.1137111.
- Batterman, S. 2015. “Temporal and Spatial Variation in Allocating Annual Traffic Activity across an Urban Region and Implications for Air Quality Assessments.” Transportation Research Part D: Transport and Environment 41: 401–415. doi:10.1016/j.trd.2015.10.009.
- Bruzzone, L., and D. F. Prieto. 2000. “Automatic Analysis of the Difference Image for Unsupervised Change Detection.” IEEE Transactions on Geoscience and Remote Sensing 38 (3): 1171–1182. doi:10.1109/36.843009.
- Canny, J. 1986. “A Computational Approach to Edge Detection.” IEEE Transactions on Pattern Analysis and Machine Intelligence 6: 679–698. doi:10.1109/TPAMI.1986.4767851.
- Cavallaro, A., and E. Touradj. 2001. “Change Detection Based on Color Edges.” Paper Presented at the IEEE International Symposium on Circuits and Systems, 141–144, Sydney, Australia, May 6–9
- Chen, B., B. Huang, and B. Xu. 2017. “Multi-Source Remotely Sensed Data Fusion for Improving Land Cover Classification.” ISPRS Journal of Photogrammetry and Remote Sensing 124: 27–39. doi:10.1016/j.isprsjprs.2016.12.008.
- Congalton, R. G. 1991. “A Review of Assessing the Accuracy of Classification of Remotely Sensed Data.” Remote Sensing of Environment 37 (1): 35–46. doi:10.1016/0034-4257(91)90048-B.
- Congalton, R. G. 2001. “Accuracy Assessment and Validation of Remotely Sensed and Other Spatial Information.” International Journal of Wildland Fire 10 (4): 321–328. doi:10.1071/WF01031.
- Dowman, I. 1998. “Automated Procedures for Integration of Satellite Images and Map Data for Change Detection: The Archangel Project.” International Archives of Photogrammetry and Remote Sensing 32: 162–169.
- Fitton, N. C., and S. J. D. Cox. 1998. “Optimising the Application of the Hough Transform for Automatic Feature Extraction from Geoscientific Images.” Computers and Geosciences 24 (10): 933–951. doi:10.1016/S0098-3004(98)00070-3.
- Foody, G. M. 2002. “Status of Land Cover Classification Accuracy Assessment.” Remote Sensing of Environment 80 (1): 185–201. doi:10.1016/S0034-4257(01)00295-4.
- Habib, A., and D. Kelley. 2001a. “Automatic Relative Orientation of Large Scale Imagery over Urban Areas Using Modified Iterated Hough Transform.” ISPRS Journal of Photogrammetry and Remote Sensing 56 (1): 29–41. doi:10.1016/S0924-2716(01)00032-6.
- Habib, A., and D. Kelley. 2001b. “Single-Photo Resection Using the Modified Hough Transform.” Photogrammetric Engineering and Remote Sensing 67 (8): 909–914.
- Habib, A. F., and R. I. Al-Ruzouq. 2004. “Line-Based Modified Iterated Hough Transform for Automatic Registration of Multi-Source Imagery.” Photogrammetric Record 19 (105): 5–21. doi:10.1111/j.0031-868X.2003.00254.x.
- Han, M., X. Yang, and E. Jiang. 2015. “An Extreme Learning Machine Based on Cellular Automata of Edge Detection for Remote Sensing Images.” Neurocomputing 198: 27–34. doi:10.1016/j.neucom.2015.08.121.
- Hashim, M., S. Ahmad, M. A. M. Johari, and A. B. Pour. 2013. “Automatic Lineament Extraction in a Heavily Vegetated Region Using Landsat Enhanced Thematic Mapper (ETM+) Imagery.” Advances in Space Research 51 (5): 874–890. doi:10.1016/j.asr.2012.10.004.
- Hu, X., and C. V. Tao. 2004. “Automatic Road Extraction from DENSE Urban Area by Integrate Processing of High Resolution Imagery and Lidar Data.” Remote Sensing and Spatial Information Sciences Istanbul, Turkey. 35: B3.
- Ji, W., Y. Wang, D. Zhuang, D. Song, X. Shen, W. Wang, and G. Li. 2014. “Spatial and Temporal Distribution of Expressway and Its Relationships to Land Cover and Population: A Case Study of Beijing, China.” Transportation Research Part D: Transport and Environment 32: 86–96. doi:10.1016/j.trd.2014.07.010.
- Ji, Y., and N. Geroliminis. 2011. “Spatial and Temporal Analysis of Congestion in Urban Transportation Networks.” Paper Presented at the Transportation Research Board 90th Annual Meeting, 11–1808, Washington, DC, January 23–27.
- Lacoste, C., X. Descombes, and J. Zerubia. 2005. “Point Processes for Unsupervised Line Network Extraction in Remote Ensing.” IEEE Transactions on Pattern Analysis and Machine Intelligence 27 (10): 1568–1579. doi:10.1109/TPAMI.2005.206.
- Liu, H., and K. C. Jezek. 2004. “Automated Extraction of Coastline from Satellite Imagery by Integrating Canny Edge Detection and Locally Adaptive Thresholding Methods.” International Journal of Remote Sensing 25 (5): 937–958. doi:10.1080/0143116031000139890.
- Manjula, M. K., S. Jyothi, and M. S. A. K. Varma. 2010. “Digitizing the Forest Resource Map Using ArcGIS.” International Journal of Computer Science Issues 7 (6): 300–306.
- Nassar, A. K., G. Alan Blackburn, and J. Duncan Whyatt. 2014. “Developing the Desert: The Pace and Process of Urban Growth in Dubai.” Computers, Environment and Urban Systems 45: 50–62. doi:10.1016/j.compenvurbsys.2014.02.005.
- Peneva-Reed, E. 2014. “Understanding Land-Cover Change Dynamics of a Mangrove Ecosystem at the Village Level in Krabi Province, Thailand, Using Landsat Data.” GIScience and Remote Sensing 51 (4): 403–426. doi:10.1080/15481603.2014.936669.
- Penn, B. S., and K. E. Livo. 2002. “Using the Semi-Automated Plug-In Tool for Feature Identification, Recognition, and Extraction (Spitfire) to Extract Roads and Surface Material Types from Aviris Imagery.” Proceedings of the AVIRIS Airborne Geoscience Workshop, Pasadena, CA. http://aviris.jpl.nasa.gov/docs/workshops/aviris.proceedings.html.
- Perona, P., and J. Malik. 1990. “Scale-Space and Edge Detection Using Anisotropic Diffusion.” IEEE Transactions on Pattern Analysis and Machine Intelligence 12 (7): 629–639. doi:10.1109/34.56205.
- Quackenbush, L. J. 2004. “A Review of Techniques for Extracting Linear Features from Imagery.” Photogrammetric Engineering and Remote Sensing 70 (12): 1383–1392. doi:10.14358/PERS.70.12.1383.
- Singh, A. 1989. “Review Article: Digital Change Detection Techniques Using Remotely-Sensed Data.” International Journal of Remote Sensing 10 (6): 989–1003. doi:10.1080/01431168908903939.
- Sohnen, J., Y. Fan, J. Ogden, and C. Yang. 2015. “A Network-Based Dispatch Model for Evaluating the Spatial and Temporal Effects of Plug-In Electric Vehicle Charging on GHG Emissions.” Transportation Research Part D: Transport and Environment 38: 80–93. doi:10.1016/j.trd.2015.04.014.
- Song, M., and D. Civco. 2004. “Road Extraction Using SVM and Image Segmentation.” Photogrammetric Engineering and Remote Sensing 70 (12): 1365–1371. doi:10.14358/PERS.70.12.1365.
- Story, M., and R. G. Congalton. 1986. “Accuracy Assessment: A User’s Perspective.” Photogrammetric Engineering and Remote Sensing 52 (3): 397–399.
- Tu, W., Q. Li, Z. Fang, S. Shaw, B. Zhou, and X. Chang. 2015. “Optimizing the Locations of Electric Taxi Charging Stations: A Spatial-Temporal Demand Coverage Approach.” Transportation Research Part C: Emerging Technologies 65: 172–189. doi:10.1016/j.trc.2015.10.004.
- Wang, J., and Q. Zhang. 2000. “Applicability of a Gradient Profile Algorithm for Road Network Extraction: Sensor, Resolution and Background Considerations.” Canadian Journal of Remote Sensing 26 (5): 428–439. doi:10.1080/07038992.2000.10855274.
- Yu, X. J., and C. N. Ng. 2007. “Spatial and Temporal Dynamics of Urban Sprawl along Two Urban-Rural Transects: A Case Study of Guangzhou, China.” Landscape and Urban Planning 79 (1): 96–109. doi:10.1016/j.landurbplan.2006.03.008.
- Zhang, C., Y. Chen, and D. Lu. 2015. “Detecting Fractional Land-Cover Change in Arid and Semiarid Urban Landscapes with Multitemporal Landsat Thematic Mapper Imagery.” GIScience and Remote Sensing 52 (6): 700–722. doi:10.1080/15481603.2015.1071965.