
ABSTRACT
Civil infrastructural safety is a key indicator for a sustainable built environment. Urban ground subsidence and infrastructural deformation are threatening infrastructural health and human well-being, in particular, in those rapidly urbanized regions in China and other Asian developing countries. Today, advances in satellite and terrestrial sensor technologies are enabling the creation of an integrated satellite–terrestrial sensor network for regular ‘Urban Computed Tomography Diagnosis’ and early warning of potential deformation disasters. This paper reviews the key earth observation and terrestrial sensor technologies for urban infrastructural health diagnosis, and proposes the potentials and prospects for future development of the satellite–terrestrial system.
1. Introduction
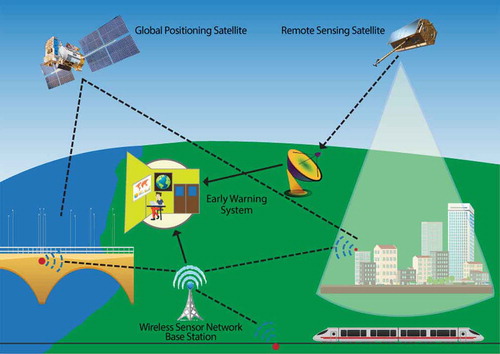
Global urbanization is creating a huge demand for civil infrastructure, such as buildings, bridges, tunnels, dams, highways, airports and railroads (Ramaswami et al. Citation2016). Unfortunately, their maintenance is usually not well coordinated (Forum Citation2015). Under progressive natural and/or man-made stressors, such as structural aging, groundwater/gas extraction, underground construction, and design faults, civil infrastructure gradually deteriorates and can result in catastrophic failure if the early signs of disasters go unnoticed or are not properly managed. For example, in April 2013 in Dhaka, Bangladesh, the Rana Plaza building collapsed due to geological instability and illegal reconstruction, leading to a death toll of 1130. The most recent disaster is the sinkhole subsidence occurred in November 2016 in Fukuoka, Japan, which is probably caused by the nearby tunnelling works. Ground subsidence has been reported in more than 50 cities in China, with a resulting economic loss of up to 315 billion RMB in the Yangtze River Delta alone (Liang and Yang Citation2007). With the growing awareness of sustainability, emphasis has been placed not only on the efficient use of resources but also on the proper management of existing infrastructural components to ensure that they remain in service throughout their designed lifespans. Obtaining early warning of such disasters is highly complex, mainly because of the extremely wide variety of causes, the hidden early signs and the large areas and interdisciplinary knowledge involved. There is a need to address existing challenges and prepare for future ones by focusing on: monitoring, assessing and understanding disaster risks and sharing such information and how it is created (Assembly Citation2015). By analogy with X-ray computed tomography for human health diagnosis, the integration of satellite and terrestrial sensors to constantly monitor infrastructural dynamics as shown in offers a feasible solution for infrastructural health diagnosis.
Figure 1. Illustration of the satellite–terrestrial sensor network.
2. SAR satellites
Satellite-borne earth observation technologies, such as synthetic aperture radar (SAR), Global Positioning System, play a critical role in monitoring the dynamics of land surface. In particular, interferometric SAR (InSAR) technologies emerging in the early 1990s have revolutionized our understanding of a variety of geodynamic phenomena (e.g. earthquakes) by mapping terrain movements with unprecedented spatio-temporal details (Meade and Sandwell Citation1996). Recent advances of SAR satellites make it possible to remotely sense the movement associated with the health states of individual structures over large areas with a centimetre- to millimetre-level accuracy and millions of measurement points (Gernhardt et al. Citation2010), and provide a view on urban infrastructural dynamics for engineers. In the last decade, InSAR has matured to a reliable geodetic instrument. Both the satellites and the algorithms have entered a ‘second generation’ of quality. Today’s SAR sensors have revisit times as short as a few days and improved spatial resolution down to 1 m. For example, the German TerraSAR-X satellite is operational with an 11-day repeat cycle and a spatial resolution of up to 0.25 m. The Italian COSMO-SkyMed constellation comprises four satellites with the revisit time of 16 days each and a spatial resolution of up to 1 m. The most recent SAR satellites, Sentinel-1A/B operated by the ESA and ALOS-2 operated by JAXA, are specifically designed for land surface deformation monitoring. In particular, China launched the first C-band full-polarization Gaofen-3 SAR satellite in August 2016, and more are to come. As we look ahead, the multiplicity of SAR satellites, including multiscale, multiband and multi-angular, will form an all-around and all-weather earth observation system for the near real-time monitoring of infrastructural dynamics over large scales.
3. Persistent scatterer InSAR
With the support of massive, high-quality and cost-effective SAR data, InSAR has matured into a reliable geodetic instrument over the past decade. All possible error sources (e.g. decorrelation and atmospheric propagation) have been well understood, modelled and mitigated using advanced processing algorithms like Persistent scatterer InSAR (PSI) (Ferretti, Prati, and Rocca Citation2001). PSI is capable of achieving submeter accuracy in digital elevation model and millimetric motion detection (Ferretti, Prati, and Rocca Citation2000, Citation2001). The so-called PSs are the points with high phase stability that are generally related to highly reflective objects in the scene (e.g. concrete or metal structures, exposed rocks, etc.).
The general signal model of multi-temporal InSAR after preprocessing can be written as (Zhu and Bamler Citation2012)
where y = [y1, …, yN]T ((·)T stands for the transpose operation) is a N × 1 vector that contains the complex values of pixels after amplitude calibration and differential interferometry; A is a N × M (M is the product of the number of discrete samplings in each geophysical parameter direction) sensing matrix that collects steering vectors a as columns; is a M × 1 vector that represents the physical reflectivity of objects, i.e. the tomography; and e is a N × 1 vector that contains the noise.
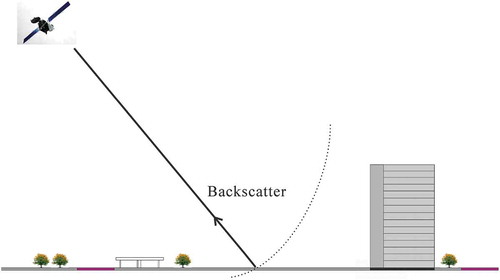
PSI assumes that each pixel contains one backscattered PS (e.g. ground) at most as shown in . Let denote the unwrapped phase, and it is primarily composed of four contributions (Ferretti, Prati, and Rocca Citation2000; Kampes Citation2006):
Figure 2. Illustration of a single PS (ground).
where is the elevation phase contribution;
is the deformation phase contribution;
is the APS phase contribution; and
is the decorrelation noise phase contribution. Assuming terrain dynamics is linear, the phase model can be written as a two-parameter model:
where (bi is the spatial perpendicular baseline,
is the wavelength, and r0 is the slant range) is the spatial frequency; s represents the slant elevation;
(ti is the temporal baseline) is the temporal frequency; v represents the linear deformation velocity.
As the shorter wavelength X-band SAR sensors (typically, TerraSAR-X and Cosmo-SkyMed) can measure subtle movements, such as thermal expansion, more sensitively (Gernhardt et al. Citation2010; Monserrat et al. Citation2011), the linear deformation model becomes insufficient to approximate the deformation phase. To increase the goodness of fit, the two-parameter phase model has been further extended to the three-parameter phase model by adding the analysis of non-linear thermal expansion. The three-parameter phase model can be written as
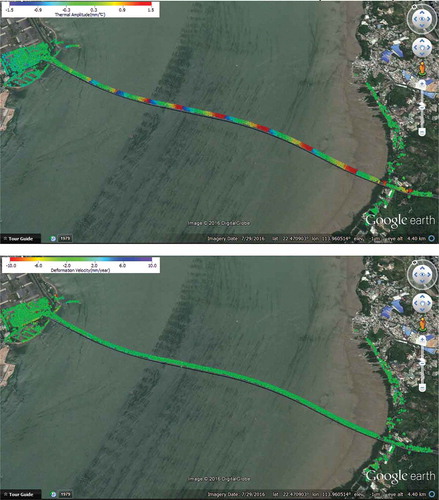
where (Ti is the thermal baseline) is the thermal frequency; and k represents the thermal amplitude. shows the thermal amplitude and linear deformation velocity of Shenzhen Bay Bridge.
Figure 3. Thermal amplitude map (top) and linear deformation velocity map (bottom).
4. SAR tomography
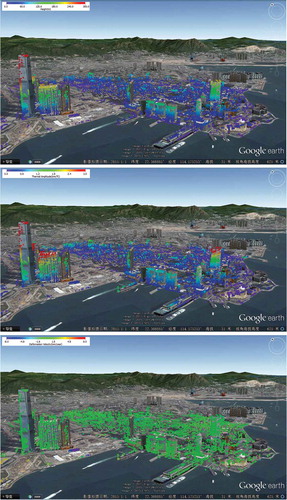
Although PSI has undergone significant improvements, a remaining limitation is that it assumes there is no more than one PS per pixel. This assumption may be not true in complex built environments with steep surface topography or high spatial density of constructions (Lombardini and Viviani Citation2014). The slant imaging geometry of SAR causes layover problems in the SAR image as shown in . Overlaid PSs cannot be detected by PSI directly, reducing the spatial density of PSs. The SAR tomography (TomoSAR) technique is a promising method for separating overlaid PSs. TomoSAR is developed from three-dimensional SAR tomography (3-D SAR) (Reigber and Moreira Citation2000) that only aims to retrieve elevation information. In practice, multi-baseline images are usually acquired in repeat-pass mode, which results that the phase contains contributions from not only elevation but also possible deformation. To jointly measure the elevation and deformation of overlaid PSs, multidimensional SAR tomography (MD-TomoSAR) was developed from 3-D SAR (De Maio, Fornaro, and Pauciullo Citation2009). Currently, there are two prevalent MD-TomoSAR methods, namely differential SAR tomography (4-D SAR) (Fornaro, Reale, and Serafino Citation2009; Lombardini Citation2005) and the extended 4-D SAR (Ma et al. Citation2015; Reale et al. Citation2011). They differ from each other in terms of the deformation model used. 4-D SAR exploits a linear deformation model to approximate the deformation phase, and thus can estimate both the elevation and linear deformation velocity by reconstructing tomography in the space–time domain (Lombardini Citation2005). In the presence of thermal expansion, the use of single linear deformation model may cause bias in the estimated parameters due to underfitting problems. To address this issue, 4-D SAR has been further extended to monitor non-linear thermal expansion by recovering tomography in the space–time–temperature domain. presents the results by the extended 4-D SAR. The extended 4-D SAR is an extension of three-parameter PSI (Monserrat et al. Citation2011) in the context of SAR tomography. In the extended 4-D SAR, the steering vector becomes
Figure 4. Illustration of three overlaid PSs (ground, wall and roof).
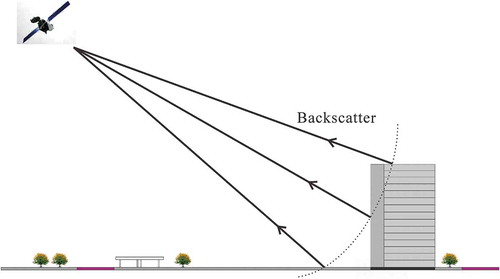
Figure 5. Height map (top), thermal amplitude map (middle), linear deformation velocity map (bottom).
Using the beamforming method, the inversion can be written as
Apart from beamforming, there are other spectral estimators to recover tomography , such as Singular Value Decomposition (SVD), Capon, MUSIC and CS. The tomography recovered by beamforming suffers from the major drawbacks of poor side lobe reduction and low resolution (Rayleigh resolution). In contrast, Capon (Lombardini Citation2005) and MUSIC (Gini, Lombardini, and Montanari Citation2002) circumvent these drawbacks, but sacrifice the spatial resolution because they require multilook processing. Comparatively, the SVD algorithm (Fornaro, Lombardini, and Serafino Citation2005) is capable of preserving full resolution in range and azimuth direction, but has no super-resolution capability. A sparse representation-based CS approach (Candes and Wakin Citation2008) has recently been introduced for tomographic imaging (Budillon et al. Citation2011; Zhu and Bamler Citation2010). CS is potentially promising for super-resolution imaging with fewer observations and no side lobe.
5. Terrestrial sensing technologies
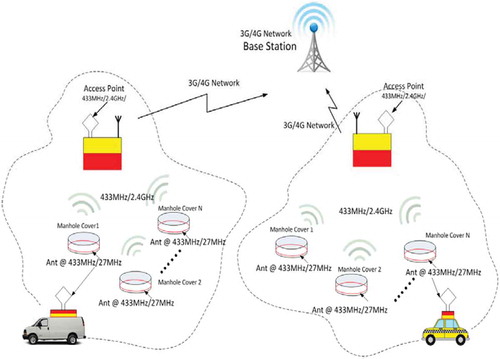
In addition to satellite-borne technologies, advanced terrestrial sensing/information technologies will provide a ground-based solution for infrastructural health monitoring. The development of the Internet of Things allows the connection of a large number of wireless sensors to form a wireless sensor network (WSN) for collecting information on structural health states (Zanella et al. Citation2014) as shown in . In contrast to GPS/RS technologies, terrestrial sensors are embedded into structures, enabling the real-time monitoring of both slow and instantaneous deformation. For the sensors, the Open Smart Soil Particles (OpenSSP sensor node) and the associated scalable data centre were developed by the HKUST team. The OpenSSP sensor node is a low-cost yet accurate modular commercial-off-the-shelf sensor (HKD$750 ∼850/piece). The architecture of this sensor node consists of software and hardware layers. The hardware layer, as illustrated in , comprises low-cost MEMS accelerometers and motion sensors, Raspberry Pi (a consumer grade single board computer), system monitoring and power unit, temporary storage (SD card), and telemetry for real-time transmission. All the data captured by the OpenSSP sensor node are stored in a scalable distributed data centre, which employs the Berkeley Data Analytics Stack to combine batch, streaming and interactive computations. The WSN measurements are transmitted to the data centre to combine batch, streaming and interactive computations. These systems can precisely locate and quantify structural damage caused by catastrophic natural or man-made events as well as by long-term deterioration due to aggressive environmental stressors, and are more effective for monitoring major infrastructure in a city. For example, fibre Bragg grating sensors have been installed to monitor Hong Kong’s landmark Tsing Ma Bridge – the world’s longest (1377 m) suspension bridge, carrying both a highway and a railroad – and can clearly and correctly detect the dynamic strain responses of the bridge induced by the passage of trains (Chan et al. Citation2006).
Figure 6. Scheme of wireless sensing network.
6. Conclusions and perspectives
The complementary use of satellite and terrestrial sensors allows the monitoring of risks on both small and large scales, frequent and infrequent, and both sudden and slow-onset deformation disasters, providing more comprehensive and accurate structural health data at a number of feature points. The satellite sensors are used to regularly screen large areas and highlight risk-prone areas where terrestrial sensors should be installed. The ground-based measurements can be used to validate the satellite measurements and continuously monitor major infrastructure. This hierarchical system facilitates not only regular overall monitoring at the regional or higher levels but also further detailed investigation of individual structures as necessary.
Satellite–terrestrial data can assist structure managers in assessing the health states of existing civil infrastructure. Building a systematic, multisector, multiscale early warning framework is necessary for the timely indication of possible precursory abnormal deformations that threaten the structural safety. To achieve this, the system should synergize not only the deformation parameters collected from the integrated satellite–terrestrial sensor network, but also interdisciplinary expert knowledge from geotechnical and structural engineering, hydrology, geology and meteorology. To evaluate the performance of infrastructural dynamics, a comprehensive methodological framework of heterogeneous data fusion and data analysis is required. Advanced structural modelling/identification schemes of various levels of sophistication will help simulate the designed dynamic behaviours of civil infrastructure and interpret the mechanisms (Frangopol and Liu Citation2007). For example, numerical modelling can be conducted based on the finite element models by taking into account geological conditions, dead loads, live loads, material behaviour (e.g. shrinkage and creep of concrete), wind and thermal loads, from which criteria of early warning for individual structures and districts can be prescribed.
In anticipation of the widespread scientific, engineering and commercial use of InSAR for infrastructural health monitoring, it is important that the InSAR community propose a universal standard to compare, disseminate and share the InSAR results. The Fringe 2015 workshop has recommended the ESA should propose a common format to share the monitoring results with a broad consensus. For the ground-based sensor technologies, policy barriers still exist, hindering the deployment of sensors at the targeted infrastructure and sharing of relevant ground survey data. Governments should promote coordination among the owners of civil infrastructure, engineers, scientists and policy makers to make it feasible to carry out further diagnosis for potential risk-prone infrastructure or areas. Despite some technical and policy issues, the integration of satellite–terrestrial sensor technologies is expected to grow strongly due to the scientific and practical significance.
The successful completion of the satellite–terrestrial sensor network will revolutionize traditional visual-inspection-based infrastructure management systems by assisting municipal authorities to make timely and intelligent decisions on the monitoring, evaluation and maintenance of deteriorating civil infrastructure. The high-density and high-accuracy deformation measurements can be archived as a ‘medical record’ of civil infrastructure in the early warning system. The hierarchical data will reveal the interactions among the ground surface, surface facilities and underground and semi-underground facilities, and will enhance our understanding of urban infrastructural dynamics, which will in turn improve the smartness and sustainability of city management.
Acknowledgements
Supported in part by National Key Basic Research Program of China (2015CB954103), National Natural Science Foundation of China (41601356), the Open Fund of Key Laboratory of Urban Land Resources Monitoring and Simulation, Ministry of Land and Resources and the AXA Research Fund. The authors are very grateful to Prof. Fabio Rocca, Prof. Richard Bamler, Prof. Limin Zhang, and Prof. Francis T.K. Au for their valuable suggestions and comments on the paper.
Disclosure statement
No potential conflict of interest was reported by the authors.
Additional information
Funding
References
- Assembly, U. G. 2015. “The Sendai Framework for Disaster Risk Reduction 2015–2030.” Third UN World Conference, Sendai, March 14–18.
- Budillon, A., A. Evangelista, and G. Schirinzi. 2011. “Three-Dimensional SAR Focusing From Multipass Signals Using Compressive Sampling.” IEEE Transactions on Geoscience and Remote Sensing 49: 488–499. doi:10.1109/TGRS.2010.2054099.
- Candes, E. J., and M. B. Wakin. 2008. “An Introduction to Compressive Sampling.” IEEE Signal Processing Magazine 25: 21–30. doi:10.1109/MSP.2007.914731.
- Chan, T. H. T., L. Yu, H. Y. Tam, Y. Q. Ni, S. Y. Liu, W. H. Chung, and L. K. Cheng. 2006. “Fiber Bragg Grating Sensors for Structural Health Monitoring of Tsing Ma Bridge: Background and Experimental Observation.” Engineering Structures 28: 648–659. doi:10.1016/j.engstruct.2005.09.018.
- De Maio, A., G. Fornaro, and A. Pauciullo. 2009. “Detection of Single Scatterers in Multidimensional SAR Imaging.” IEEE Transactions on Geoscience and Remote Sensing 47: 2284–2297. doi:10.1109/TGRS.2008.2011632.
- Ferretti, A., C. Prati, and F. Rocca. 2000. “Nonlinear Subsidence Rate Estimation Using Permanent Scatterers in Differential SAR Interferometry.” IEEE Transactions on Geoscience and Remote Sensing 38: 2202–2212. doi:10.1109/36.868878.
- Ferretti, A., C. Prati, and F. Rocca. 2001. “Permanent Scatterers in SAR Interferometry.” IEEE Transactions on Geoscience and Remote Sensing 39: 8–20. doi:10.1109/36.898661.
- Fornaro, G., F. Lombardini, and F. Serafino. 2005. “Three-Dimensional Multipass SAR Focusing: Experiments with Long-Term Spaceborne Data.” IEEE Transactions on Geoscience and Remote Sensing 43: 702–714. doi:10.1109/TGRS.2005.843567.
- Fornaro, G., D. Reale, and F. Serafino. 2009. “Four-Dimensional SAR Imaging for Height Estimation and Monitoring of Single and Double Scatterers.” IEEE Transactions on Geoscience and Remote Sensing 47: 224–237. doi:10.1109/TGRS.2008.2000837.
- Forum, W. E. 2015. Global Risks. World Economic Forum.
- Frangopol, D. M., and M. Liu. 2007. “Maintenance and Management of Civil Infrastructure Based on Condition, Safety, Optimization, and Life-Cycle Cost∗.” Structure and Infrastructure Engineering 3: 29–41. doi:10.1080/15732470500253164.
- Gernhardt, S., N. Adam, M. Eineder, and R. Bamler. 2010. “Potential of Very High Resolution SAR for Persistent Scatterer Interferometry in Urban Areas.” Annals of GIS 16: 103–111. doi:10.1080/19475683.2010.492126.
- Gini, F., F. Lombardini, and M. Montanari. 2002. “Layover Solution in Multibaseline SAR Interferometry.” IEEE Transactions on Aerospace and Electronic Systems 38: 1344–1356. doi:10.1109/TAES.2002.1145755.
- Kampes, B. M. 2006. Radar Interferometry: Persistent Scatterer Technique. Dordrecht, The Netherlands: Springer.
- Liang, C., and D. Yang. 2007. The China Environment Yearbook, Volume 1 (2005): Crisis and Breakthrough of China’s Environment. Leiden: Brill.
- Lombardini, F. 2005. “Differential Tomography: A New Framework for SAR Interferometry.” IEEE Transactions on Geoscience and Remote Sensing 43: 37–44. doi:10.1109/TGRS.2004.838371.
- Lombardini, F., and F. Viviani. 2014. “New Developments of 4D+ Differential SAR Tomography to Probe Complex Dynamic Scenes.” Geoscience and Remote Sensing Symposium (IGARSS), 2014 IEEE International, 3362–3365, Quebec City, July.
- Ma, P., H. Lin, H. Lan, and F. Chen. 2015. “Multi-Dimensional SAR Tomography for Monitoring the Deformation of Newly Built Concrete Buildings.” ISPRS Journal of Photogrammetry and Remote Sensing 106: 118–128. doi:10.1016/j.isprsjprs.2015.04.012.
- Meade, C., and D. T. Sandwell. 1996. “Synthetic Aperture Radar for Geodesy.” Science 273: 1181–1182. doi:10.1126/science.273.5279.1181.
- Monserrat, O., M. Crosetto, M. Cuevas, and B. Crippa. 2011. “The Thermal Expansion Component of Persistent Scatterer Interferometry Observations.” IEEE Geoscience and Remote Sensing Letters 8: 864–868. doi:10.1109/LGRS.2011.2119463.
- Ramaswami, A., A. G. Russell, P. J. Culligan, K. R. Sharma, and E. Kumar. 2016. “Meta-Principles for Developing Smart, Sustainable, and Healthy Cities.” Science 352: 940–943. doi:10.1126/science.aaf7160.
- Reale, D., G. Fornaro, A. Pauciullo, X. Zhu, and R. Bamler. 2011. “Tomographic Imaging and Monitoring of Buildings with Very High Resolution SAR Data.” IEEE Geoscience and Remote Sensing Letters 8: 661–665. doi:10.1109/LGRS.2010.2098845.
- Reigber, A., and A. Moreira. 2000. “First Demonstration of Airborne SAR Tomography Using Multibaseline L-Band Data.” IEEE Transactions on Geoscience and Remote Sensing 38: 2142–2152. doi:10.1109/36.868873.
- Zanella, A., N. Bui, A. Castellani, L. Vangelista, and M. Zorzi. 2014. “Internet of Things for Smart Cities.” IEEE Internet of Things Journal 1: 22–32. doi:10.1109/JIOT.2014.2306328.
- Zhu, X. X., and R. Bamler. 2010. “Tomographic SAR Inversion by L1-Norm Regularization—The Compressive Sensing Approach.” IEEE Transactions on Geoscience and Remote Sensing 48: 3839–3846. doi:10.1109/TGRS.2010.2048117.
- Zhu, X. X., and R. Bamler. 2012. “Super-Resolution Power and Robustness of Compressive Sensing for Spectral Estimation with Application to Spaceborne Tomographic SAR.” IEEE Transactions on Geoscience and Remote Sensing 50: 247–258. doi:10.1109/TGRS.2011.2160183.