
ABSTRACT
Groundwater nitrate contamination of the aquifer in the Central Valley, California is a major problem due to intense agricultural practice over the last decades. Excessive loading of fertilizer and manure in combination with hydrogeological parameters and geochemical conditions have enhanced the downward percolation of nitrate into the aquifer. A spatial variance-based geographical detector method was used at the watershed scale in Central Valley to identify the key determinants to elevated nitrate concentration, locate the risk areas and analyse the interaction between these determinants. Statistically significant difference was observed in percent of wells with above background concentration (5mg/L) between the areas with low and high fertilizer application. Higher number of wells was also contaminated in areas with higher manure, higher permeability and higher dissolved oxygen conditions. These factors interacted with the hydrogeological parameters in exacerbating the groundwater nitrate contamination in the study area. A distinctly higher nitrate concentration was observed in Tulare basin and San Joaquin basin compared to Sacramento Valley, which could be attributed higher fertilizer rate, coarse grained sediment and over pumping of groundwater altering the hydrogeological conditions.
1. Introduction
1.1. Central Valley and nitrate contamination
Central Valley (CV) aquifer is located in one of the most productive regions of the United States where large varieties of crops and fruits are grown throughout the year. It accounts for one sixth of the country’s irrigated land and is one of the largest irrigated land in the world (Lo and Famiglietti Citation2013). Approximately 75% of the irrigated land in California and 17% of the nation’s irrigated land is in the Central Valley (USGS Citation2015). However, this intensive amount of agriculture, especially the increasing rate of fertilizer application, for the last 50 years has caused groundwater contamination with nitrate. There are multiple studies showing the relationship between landuse practice and the groundwater nitrate contamination in CV. Parts of CV are already identified as a high groundwater nitrate vulnerable area in the country. Based on 2007 data, in California, 740,000 tons of nitrogen in the fertilizer was applied to 6.7 million acres of irrigated land (Harter Citation2009). The extra nitrogen applied to cropland easily leaches down into the groundwater and contaminates the groundwater. According to a University of California, Davis report using the mass balance method, an estimated 50% of the all nitrogen applied to the 3.12 million acres of cropland in Tulare Lake Basin and Salinas Valley has leached past the root zone and eventually reached the groundwater (Viers et al. Citation2012). National assessment of groundwater survey found that about 40% of the shallow wells in United States have groundwater nitrate concentration above the EPA’s maximum contamination level (MCL) of 10 mg/L. Shallow wells are more vulnerable as it takes time for nitrate to percolate down into the deeper aquifer. Sacramento Valley, San Joaquin Basin and Tulare Basin within the Central Valley have been found to have several wells above EPA’s MCL. Nitrate in the drinking water is a health hazard and could cause severe health problems if consumed above EPA’s MCL. Therefore, regulating the nitrate contamination in the Central Valley is of great importance to the California State government to ensure safe drinking water. The transport of nitrate into the groundwater is determined by several other factors, including landuse, lithology, slope, recharge rate, precipitation, permeability and groundwater geochemical conditions. However, one factor might be more effective in facilitating percolation than another depending on the study area. Although these factors naturally act in combination to enhance or weaken the transportation, we are not aware of any study that quantifies how their interaction might be affecting the transport. Also, although numerous local level studies have been conducted within the Central Valley (Schans et al. Citation2009; Harter et al. Citation2012; Lockhart, King, and Harter Citation2013), there are few studies conducted for the entire aquifer. As Central Valley is one of the important aquifers in United States, it is imperative that aquifer level studies be carried out to formulate regional scale policies to safeguard the aquifer sustainability. USGS National Water-Quality Assessment Programme (NAWQA) also emphasizes on aquifer level study of groundwater quality and trends for all the 52 principal aquifers in United States.
1.2. Previous studies
There are many studies performed in the CV or parts of Central Valley to assess the groundwater contamination of the valley. Previous studies have shown generally an increasing trend in the groundwater nitrate contamination over last couple of decades (Nightingale Citation1970; Burrow, Shelton, and Dubrovsky Citation2008). Data from monitoring wells, public wells and domestic wells have also exhibited an increasing trend over the years. In general, San Joaquin Basin (SJ) and Tulare Basin (TB) in the southern part of the valley have been found to have higher nitrate concentration than northern Sacramento Valley. Various USGS reports have extensively described on the spatial heterogeneity of rainfall, permeability, groundwater flow system, slope, cropland, groundwater pumping rate, geochemical conditions, textures, depth and yield of wells in the valley that have caused higher groundwater nitrate concentration in the SJ and TL basin (Faunt, Hanson, and Belitz Citation2009; Bertoldi, Johnston, and Evenson Citation1991). More recent studies on the Central Valley is performed by applying Regional Kendall test to compare the trends in concentration of nitrate in wells using historical data (1950–2000) in eastern and western physiographic regions (Burrow et al. Citation2012). Nolan et al. (Citation2014) applied logistic regression and random forest regression to show that nitrogen input, soil texture, soil conditions and transport into the well screen as important variables to groundwater nitrate contamination in both domestic and public wells. Anning et al. (Citation2012) applied random forest classifier algorithm to predict concentration of nitrate in Basin-Fill aquifer that include the Central Valley.
Many methods have been previously used to study and understand aquifer susceptibility to groundwater nitrate contamination. The DRASTIC method incorporates seven factors: Depth to Water, Recharge Rate, Aquifer Media, Soil Media, Topography, Impact of Vadose Zone and Hydraulic Conductivity with different weights to create an index (Rupert Citation2001). However, this method suffers from the limitations of pre-assigning the determining variables in the model, which increases the chances of overlooking some other important variables that could be prevalent in the study area, and subjectively assigning the weight for each variable. Process-based method demands extensive data coverage and is only effective on a local scale. This method emphasizes more on simulating the physical process of contaminant transport and water movement in an environment using groundwater flow model like Dracy’s Law or the Law of Conservation of Mass and could become very complex (Focazio et al. Citation2002). It is important to understand aquifer susceptibility based on the spatial distributions of contributing factors (natural or anthropogenic) such as landuse or fertilizer rate, as their spatial distributions could reveal in which factors contribute to the groundwater nitrate contamination. Statistical methods like multiple linear regressions only form a linear relationship with its independent variables and calculate the positive or negative coefficient for each variable with higher coefficient values being more influential to the dependent variable (Minshew et al. Citation2002). It also has a limitation that the coefficient of variation (r2) will always increase with the increasing number of independent variables. Logistic regression is another common statistical method that calculates the probability of nitrate concentration above a certain threshold (Nolan, Hitt, and Ruddy Citation2002). However, it may be less intuitive to the decision-makers, as it does not make a direct comparison of nitrate concentration. The Wilcoxon-Pratt signed rank test only calculates if there is a statistically significant difference in groundwater nitrate concentration during two different time periods (Lindsey and Rupert Citation2012). The Kruskal−Wallis test calculates if there is statistically significant difference between samples of different regions, but does not tell much about the influencing variables (Burow, Stork, and Dubrovsky Citation1998). Regional Kendall test statistically assesses if there is an increasing or decreasing trend of groundwater nitrate over time (Fisher and Phillips Citation2014). These statistical methods do not take full consideration of the spatial association between the groundwater nitrate concentration and factors that could potentially control groundwater nitrate concentration.
1.3. Purpose of this study and rationale for using geographical detector
The purpose of this research is to address the groundwater nitrate vulnerability of Central Valley at aquifer level by using a geographical detector (hereafter geodetector) method that statistically calculates the spatial association between the nitrate contamination and the potential determinants based on a Spatial Variance Analysis (SVA) technique. This method was originally used in health studies to reveal the relationship between the spatial distribution of the disease pattern and those of the potential environmental risk factors. The assumption is that if an environmental factor leads to a disease, the disease would exhibit a spatial distribution similar to the environmental factor (Wang et al. Citation2010). Instead of directly comparing disease rate with some measure of the environment factor (e.g. soil class), it calculates the variance of the disease rate within each zones of the environmental factor (e.g. each soil class) and compare the local variances with the global variance of disease rate within the entire study area. If the spatial associate is real, the local variance should be close to zero or very small. If the spatial associate is not there, then the local variance is expected to be the same as the global variance. So, the spatial association can be measured by comparing the local and global variances. In addition, its risk detector and interaction detector will help identify in which geographic areas more vulnerable to nitrate contamination and which factors can interact to enhance or weaken the contamination. More details of the method will be discussed in section 3. There are at least four advantages of this approach as compared with traditional methods such as regression analysis: (a) it considers spatial distribution of the data (both dependent and independent variables); (b) it makes no assumptions about the data; (c) it can assess the interaction of different factors; and (d) it works very well with categorical independent variables, and in fact, continuous variables need to be discretized first for this method to work (Wang et al. Citation2010; Citation2016). The method has been successfully applied to non-medical fields (e.g. Luo et al. Citation2015; Du et al. Citation2016).
Applying geodetector method in the CV to study the groundwater contamination will not only identify the important explanatory variables but also capture the vulnerable geographic regions or risk areas in the given geographical stratum. Furthermore, interaction detector and ecological detector produce additional information on the relative and combined influences of the variables which gives better insight into the groundwater condition of Central Valley. The findings of this research would provide valuable information for decision- and policy-makers in making better decisions and formulate better policies in the future to combat the nitrate contamination problem in CV aquifer and protect this precious and critical nature resource.
2. Study area, data sources and pre-processing
2.1. Study area
Central Valley covers an area about 52,000 km2, which is a distinct depression located in the centre part of the California. Its width is about 80 km and length 643 km. It is bounded in the eastern side by Sierra Nevada, in the western side by San Francisco Bay and Coast Ranges, in the north by Cascade Range and in the south by Tehachapi Mountain ().
Figure 1. Central Valley California showing different hydrologic regions.
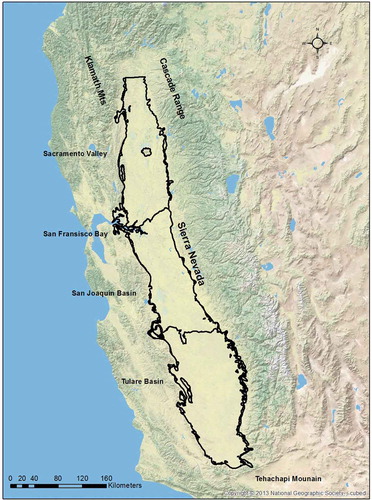
Central Valley is divided into four major hydrologic regions. The northern one-third is Sacramento Valley, and southern two-third is San Joaquin Valley. San Joaquin Valley is further divided into San Joaquin Basin (SJ) and Tulare Basin (TB). Sacramento and San Joaquin are the major rivers that flow through the valley. These rivers drain into low lying areas of San Francisco Bay containing wetlands and numerous islands. Central Valley experiences an arid-to semi-arid hot climate with a hot and dry summer and a cold and damp winter. The Sacramento Valley receives more rainfall that averages about 330 to 660 mm (13–26 in), and the drier San Joaquin Valley receives about 127 to 457 mm (5–18 in) (Faunt, Belitz, and Hanson Citation2009). Central Valley aquifer consists of heterogeneous sediments of unconsolidated to semi-unconsolidated gravel, sand, silt and clay. Sacramento Valley has mostly fine grained sediments derived from volcanic activity. San Joaquin Valley is mainly characterized by coarser grain texture, especially on the eastern side which are wide spread and occur along the major rivers. Alluvial fans derived from the Sierra Nevada in the southern part of San Joaquin Valley are even coarser grained than the alluvial fans to the north. Western Joaquin Valley is, however, finer grained and is underlain by Corcoran Clay Member (Faunt, Belitz, and Hanson Citation2009).
2.2. Data sources and pre-processing
2.2.1. Basic analysis unit: watershed
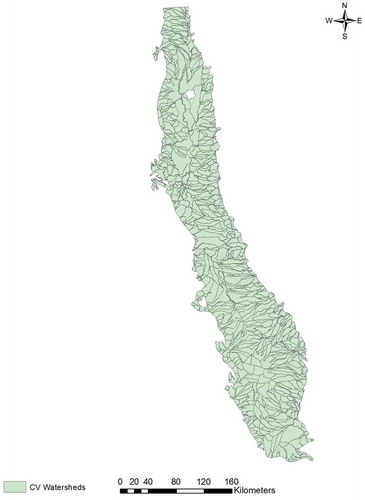
The watershed data based on 12-digit hydrologic unit boundary for the study area were selected in this study as the basic analysis unit to assess the groundwater vulnerability because this is the finest resolution of the hydrologic unit hierarchy (), which is georeferenced to the 1:24,000-scale topographic base map and meets the National Standards for the Spatial Data Accuracy and the Watershed Boundary Dataset standards (USGS Citation2013). Since groundwater is a part of the hydrologic cycle, the amount of precipitation, run-off, infiltrations and evaporation depends upon the watershed character that would be closely associated with the status of groundwater. In health studies related to water quality, watershed is also found to be an effective study unit (e.g. Wang et al. Citation2010). There are a total of 656 different watersheds in the study area, with an average watershed size of 80.01 km2. Nitrate contamination data and the potential controlling factor data are pre-processed to the basic watershed unit for further analysis in this study because these data were collected at different scales and resolutions (see more detail below).
Figure 2. Central Valley Watersheds used as basic analysis unit.
2.2.2. Nitrate data
Groundwater nitrate data from the well sampled in CV were used in this research. Nitrate data for the period of 2002 to 2014 were downloaded from the following sources: USGS National Water-Quality Assessment Programme (NAWQA), USGS National Water Information System (NWIS) and State Water Resources Control Board-Groundwater Ambient Monitoring and Assessment (SWRCB-GAMA). GAMA has the nitrate data in the form of nitrate (NO3) only, which was converted to Nitrate-N (NO3-N) to be consistent with the data from NWIS and NAWQA.
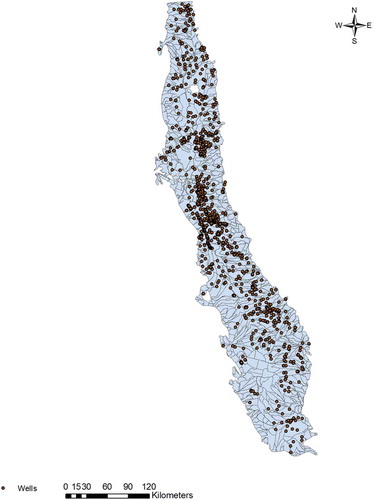
The location (latitude, longitude) information of each well station was imported into the GIS to make a shapefile. Data at different times for the same station were geocoded only once, and attributes from different times over the study period were averaged for each station. The data were then complied together to merge into one shapefile for the whole study area. After the compilation process, a total of 2,517 well samples were used in this study. shows the spatial distribution of these wells in the CV.
Figure 3. Distribution of wells in Central Valley Aquifer.
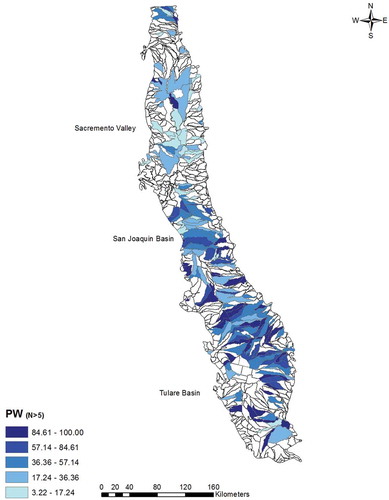
Based on the shapefile of sampled wells, we computed the percent of wells exceeding nitrate threshold of 5 mg/L (hereafter PWN>5 or nitrate level) during the study period for each watershed to represent the groundwater nitrate concentration of each watershed. PWN>5 was used as it is deemed to better capture the spatial variability of nitrate contamination (Burow et al. Citation2012). PWN>5 was derived by first obtaining the number of sampled wells in each watershed, next calculating number of wells that exceeded the threshold of 5 mg/L of nitrate (temporal average) within each watershed, and finally computing the percentage based on previous two numbers. The result is shown in .
Figure 4. Percent of wells above background concentration of 5 mg/L (PWN>5) in CV aquifer based average of 2002 –2014 data period.
2.2.3 Explanatory variables
The explanatory variables selected in this study were based on a survey of previous studies (e.g. Nolan et al. Citation1998; Elmi et al. Citation2002; Nolan and Hitt Citation2006; Kaown et al. Citation2007; Gurdak and Qi Citation2012; Burow et al. Citation2012), which found these factors to be potentially important in contributing to groundwater nitrate contamination. Explanatory variables are categorized into three major groups: sources, aquifer susceptibility and geochemical conditions. Several studies have shown a direct relationship between the groundwater nitrate contamination and the agricultural land use in Central Valley. Central Valley is a heavily irrigated land where tons of fertilizer is applied every year to increase crop yield. Fresno, Kern and Kings Counties in CV are top agricultural counties in the United States (Bertoldi, Johnston, and Evenson Citation1991). Nitrate can leach into the aquifer from these agricultural lands. Nitrate is also leached from animal waste, animal holding areas and manures. Other sources of nitrate leaching could be septic tanks and atmospheric deposition of nitrogen. In United States, 40% of the wells in shallow groundwater and beneath agricultural land and 3% of the wells in beneath urban areas were found to have nitrate concentration above USEPA maximum contaminant level (Dubrovsky et al. Citation2010). Our current study is primarily focused on examining the impact of agriculture landuse on groundwater nitrate contamination and therefore percent-cropland used, farm-fertilizer applied and manure applied were used to see if groundwater contamination is higher in areas with higher cropland percentage and higher applications of fertilizer and manure.
Nitrate contamination in wells of Central Valley does not entirely depend on the source variables. Aquifer characteristics like permeability, porosity, soil textures, precipitation, aquifer recharge rate, and geology and groundwater flow system are all very important aquifer characteristics which could determine the contamination rate of groundwater by nitrate after the land has been exposed to the source variables. The geologic setting of CV is such that it has Sierra Nevada in the east and Coastal Ranges in the west. Coastal process like flooding and marine deposition has dominated on the western side throughout the geologic time, and fluvial process is more dominant in the eastern side. Throughout the valley, continental deposits mostly overlie the marine deposits and contain most of the freshwater aquifers in the Central Valley. These continental deposits are mostly comprised of numerous lenses of fine-grained sediments (silt, sandy silt, sandy clay and clay) throughout the valley. Average annual precipitation is higher in Sacramento Valley than San Joaquin Valley. In the east, the Sierra Nevada receives mean annual precipitation mostly in the form of snow and increase with altitude ranging from 40 to more than 90 in. In Central Valley, the natural pattern of groundwater movement was from higher elevation as recharge area towards the topographically low areas in the centre of the valley. Groundwater primarily flowed towards Sacramento or San Joaquin rivers and towards Tulare Lake in the southern San Joaquin Valley. Streams entering the valley from Sierra Nevada and Klamath Mountains and from precipitation recharged the valley aquifer system. Recharge via stream channels took place mostly in their upper reaches shortly after entering the valley. However, due to over pumping of groundwater, many studies have already demonstrated that the groundwater flow system in the southern parts of the Valley (SJ basin and TL basin) has been completely reversed where groundwater now flow towards the cone of depression rather than towards the pre-existing natural discharge areas along the Sacramento and San Joaquin Rivers and around Tulare Lakes. SJ basin has seen a large decline in the groundwater level mainly in the western and southern parts of the valley where the groundwater pumping has exceeded the recharge rate. Excessive pumping has increased the vertical hydraulic gradient of groundwater flow in these areas and has increased the chance of contamination to the deeper parts of the aquifer (Bertoldi, Johnston, and Evenson Citation1991). One of the objectives of this study is to identify these risk areas by applying the geodetector method to the nitrate concentration data of the wells and potential contributing factors. Central Valley also has varying level of permeability. Permeability is the measure of the porous medium’s ability to allow groundwater to flow through, and it is the property of the porous medium (aquifer) and is mostly related to the grain sizes of the aquifer. Permeability is higher for coarse grained materials like gravel and sand and low for silt and clay. Sacramento Valley has mostly fine-grained volcanic-derived sediments, whereas San Joaquin Valley has relatively coarser grained sediments, mainly along the valley margins. Considering how aquifer characteristics could influence the downward movement of nitrate into the groundwater of CV, abovementioned variables were used in the geodetector method.
Geochemical conditions could also alter the concentration of nitrate in groundwater and are mainly used to assess the quality of groundwater. The east side, the axial part and west of the valley have distinct groundwater chemistry. The quality of water in the west of CV is influenced more by the marine sediments of the Coast Ranges. On eastern side, the quality of stream water that enters the valley from surrounding mountains is influenced by granitic Sierra Nevada. As the water moves through the aquifer, its reducing conditions and cation exchanges process can further affect the chemistry of water. The San Joaquin Valley has mostly bicarbonate on east, dissolved solids on the axial part and sulphate or bicarbonate on the west side. San Joaquin Valley water has also been divided into three vertical zones: unconfined, semiconfined and confined with varying chemical composition (Faunt, Hanson, and Belitz Citation2009). Burow et al. (Citation2012) observed increasing trend of nitrate in the eastern San Joaquin Valley during the last several decades. The redox reaction primarily effects the nitrate concentration of nitrate in the groundwater. Anoxic condition (less oxic condition) in the deeper aquifer promotes denitrification process which breaks down the nitrates into atmospheric nitrogen. Dissolved oxygen (DO), iron (Fe) and manganese (Mn) concentrations were used to assess the oxic condition in the valley. Elevated level of Fe and Mn is found in anoxic condition, inversely related to DO. Eastern parts of CV have been observed with high DO and low Fe and Mn concentration suggesting higher concentration of nitrate in groundwater. Sacramento Valley receives more precipitation and has more fine textured sediments which favour the anoxic conditions.
Based on common data availability, the time period analysed was between 1987 and 2010. All the representative values of explanatory variables were extracted for the 656 watersheds. See for a list of independent variables and their data sources and methods used for data preparation (more details below). The data set was then fed into the geodetector model for analysis.
Table 1. Explanatory variables used for the geodetector method.
2.2.3.1. Source variables
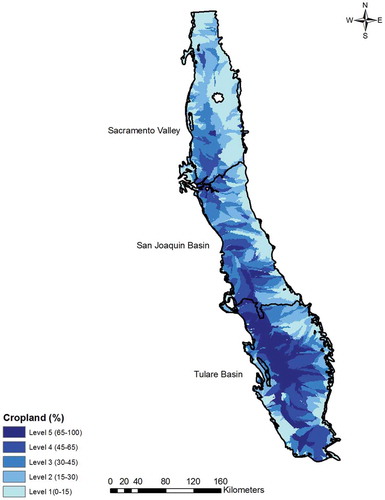
Percent-cropland, farm fertilizer and manure are common sources that could enhance the groundwater nitrate contamination (e.g. Gurdak and Qi Citation2012). A percentage of cropland in CV was calculated from landcover data using the methods described in Nolan and Hitt (Citation2006). Landuse data were downloaded from the Multi-resolution Land Characteristics Consortium-National Landcover Database (NLCD) website. National Land Cover Database 2001 classifies landuse in United States into 16 classes.
The NLCD data are available in raster format at the spatial resolution of 30 m. Based on the NLCD 2001 landuse classification, cultivated crops and pasture/hay were selected to represent the cropland in CV. The zonal statistics tool in ArcGIS was used to sum up the number of cells that represented cropland in each watershed in the CV. The area of cropland in each watershed was then calculated by multiplying the total number of cropland cells within that watershed by the area of each pixel. Finally, the percent of cropland for each watershed was calculated by dividing the cropland area by total watershed area ().
Figure 5. Percent cropland at watershed scale in CV aquifer.
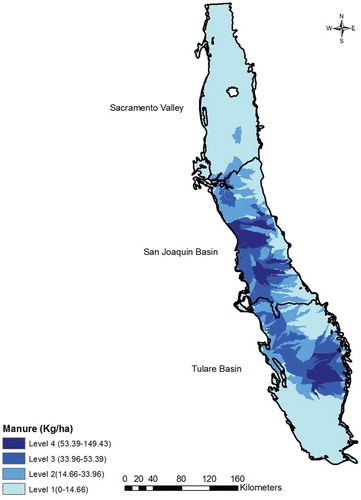
County level estimates of nitrogen from commercial fertilizer for the conterminous United States for the period of 1987–2006 are available online at USGS website, which was derived from the Association of American Plant Food Control Officials (AAPFCO) and commercial fertilizer sales data. Fertilizer loading for each watershed was estimated using fertilizer intensity and cropland area within the watershed assuming equal distribution. First, fertilizer intensity was calculated by dividing the total fertilizer (averaged over the study period) in the county by total cropland in the county. The watershed area in the CV was then intersected with the fertilizer intensity, the product of which gives the fertilizer loading as the output for each watershed. For watersheds that overlapped with two or more county intensity, fertilizer loading of that watershed was calculated by adding up each segmented fertilizer loading. In below, A, B and C are the county intensity and area a1, a2 and a3 are the area of watershed segmented by county intensity A, B and C. Fertilizer loading in segmented area a1, a2 and a3 is given as the product of county intensity and segmented area given as A×a1, B×a2 and C×a3. Total fertilizer loading in that watershed is the summation of fertilizer loading of each segmented area as: A×a1 + B×a2 + C×a3. shows fertilizer loading in watersheds of Central Valley aquifer. Similar steps were performed to calculate manure loading for each watershed ().
Figure 6. Calculation of fertilizer and manure loading for a watershed segmented by three counties.
Figure 7. Fertilizer loading in CV aquifer.
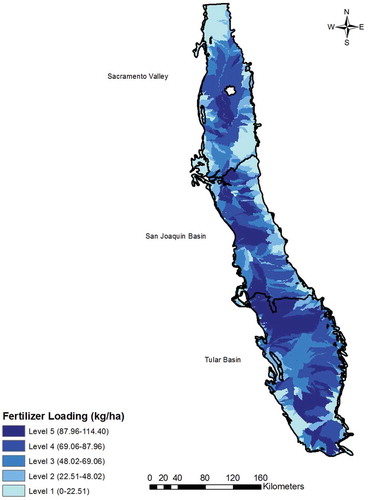
Figure 8. Manure loading in CV aquifer.
2.2.3.2. Aquifer susceptibility
Aquifer susceptibility variables determine how aquifer characteristics facilitate or alleviate the contamination of aquifer from nitrate sources and are mostly related to hydrogeological conditions that determine the behaviour of nitrate movement across the landscape and underground (Nolan and Hitt Citation2006). Elevation, precipitation, permeability, soil characteristics, slope and recharge rate were used in this study to see their influences in the groundwater nitrate contamination.
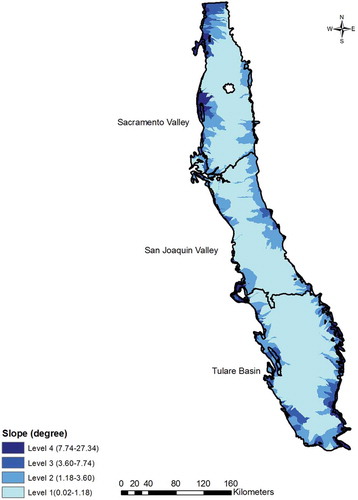
Groundwater nitrate contamination has been found to vary with the elevation and slope. Usually in low lying areas where the water table is closer to surface, the nitrate concentration has been found to be higher than that in high elevation area (Kaown et al. Citation2007). Areas with lower slope have also been found with higher groundwater nitrate contamination (Kaown et al. Citation2007). Elevation data were downloaded from USGS Digital Elevation Model (DEM) as a part of National Mapping programme available in the raster or grid form at 30-meter resolution (1 arc second). DEM was extracted and clipped for the study area and projected to US National Equal area projection (). Slope for the study area was calculated using digital elevation model (DEM) in ArcGIS ().
Figure 9. Distribution of elevation in CV aquifer.
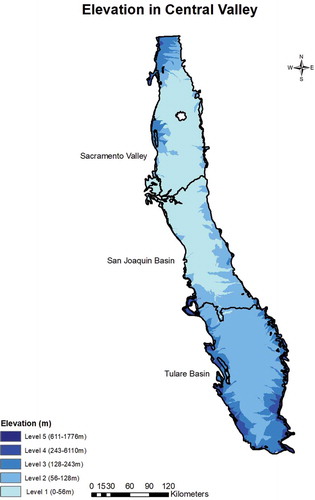
Figure 10. Distribution of slope in CV aquifer.
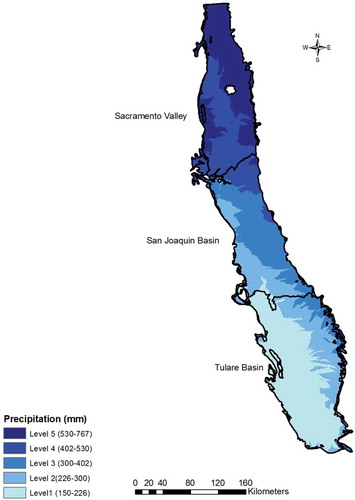
The amount of rainfall could alter the percolation rate of nitrate into the groundwater. Seasonal fluctuations in the nitrate contamination have been observed due to change in the rainfall pattern (Elmi et al. Citation2002). Precipitation data were downloaded from PRISM Climate data. The data set used in this study () is a 30-year normal data (average value) for the period of 1981–2010.
Figure 11. Distribution of precipitation in CV aquifer.
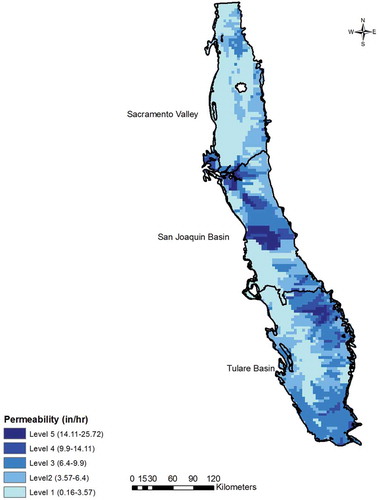
Permeability is the measure of how easily water can percolate through the porous media. Areas with high permeability allow percolation of a higher volume of water along with the nitrate in the water. Well-drained soil with high nitrogen input has been found to have high nitrate concentration in the groundwater (Nolan and Ruddy Citation1996). Permeability data () were downloaded from NRCS State Soil Geographic (STATSGO) database available on USGS website. The data are available in the grid format at 4km resolution for the conterminous United States.
Figure 12. Distribution of permeability in CV aquifer.
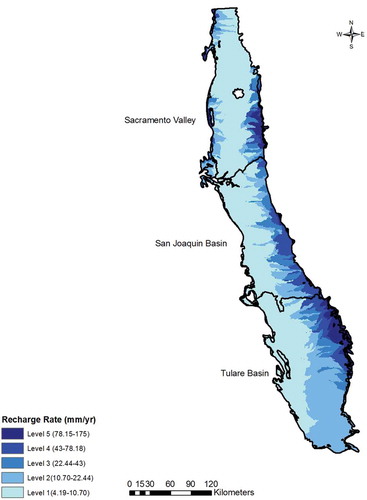
The Recharge rate is the rate at which, as a part of hydrologic process, aquifer is able to receive water that infiltrates down from the surface water. Although higher rainfall areas are commonly positively related to recharge rate, other hydrogeological conditions and excessive groundwater pumping could affect the recharge rate in aquifers. The estimated mean annual groundwater recharge in the conterminous United States from USGS (Wolock Citation2003) was used in this study (). The data are a 1 km resolution raster (grid) dataset originally prepared to assist in the monitoring of US groundwater monitoring programme (NAWQA).
Figure 13. Distribution of recharge rate in CV aquifer.
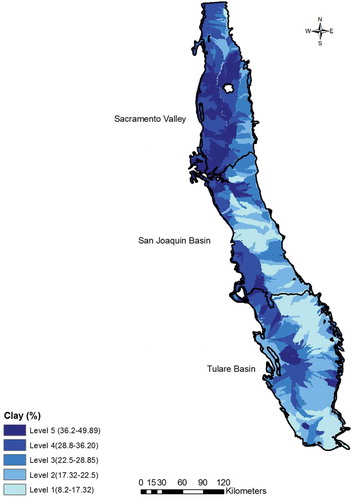
Soil characteristics are important attributes that could change the concentration of nitrate in groundwater. STATSGO lists available water capacity, bulk density, percent clay and organic matter as major soil properties. The percent of clay in soil could delay the percolation rate of water into the groundwater thereby, reducing the chance of nitrate contamination. A data set representing the percent of clay sediment in soil was used to analyse the groundwater nitrate vulnerability (). The data are available at USGS website in raster data format and represent amount of clay sediment in soil, in percent times thousand, in the conterminous United States.
Figure 14. Distribution of percent clay in CV aquifer.
2.2.3.3. Geochemical conditions
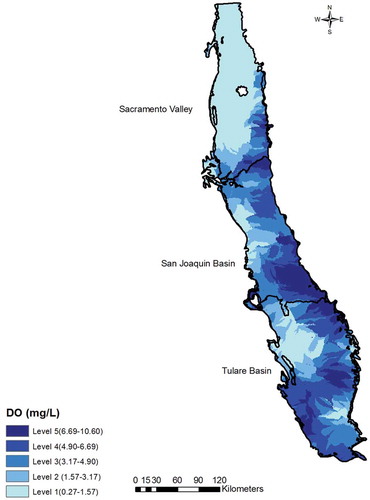
Dissolved oxygen, iron and manganese concentrations in groundwater represent the geochemical condition of groundwater whose concentration determines the reactivity of groundwater. Geochemical variables are available in the NWIS website which was downloaded for the same number of wells used for nitrate contamination. The concentration of these variables in well samples was interpolated using the Kriging method for the CV and reclassified using natural break method. Concentration of nitrate in groundwater also depends upon the geochemical condition (redox condition) of the aquifer. Nitrate concentration has been found to be relatively higher in the shallow wells and tends to decrease in deeper part of the aquifer (Nolan et al. Citation1998). The dissolved oxygen level drops in deeper aquifers which can create anoxic conditions, which are favourable for denitrification, converting nitrate into nitrogen, hence reducing the groundwater nitrate concentration (). The elevated levels of iron (Fe) and manganese (Mn) also occur in anoxic conditions, which could vary in the study area and could represent the geochemical conditions (Burow et al. Citation2012).
Figure 15. Distribution of dissolved oxygen in CV aquifer.
All continuous variables are discretized into three to five different zones based on natural break classification (Cao, Ge, and Wang Citation2013) for further analysis with geographical detector method (see more details in section 3 below). Geodetector method is suitable for both discrete and continuous variable. Discrete variable is categorical variables and therefore easy to implement into the method by categorizing into different types and calculating the PD values for each category. However, discretizing continuous variable demands careful observation of the data before it is made discrete. As discretization directly impacts the PD values of the method, the user must be aware in the interpretation of the result. Cao, Ge, and Wang (Citation2013) have discussed how PD values could change using five discretization methods: Quantile, Natural Break, Geometric Interval and Standard Deviation. In this study, Natural Break was used as the optimal method as this method is designed to reduce the variance within intervals and maximize the variance between the intervals thereby making the interval suitable to observe the spatial variation. Three to five zones or interval was set to be optimum interval in this study as Cao, Ge, and Wang (Citation2013) suggested 2–8 interval or cut points as the optimum interval size for continuous variable to avoid the randomness and subjectivity in the user-defined interval.
3. Geographical detector method
Geodetector method is a powerful statistical analysis that is based on Spatial Variance Analysis (SVA). The assumption is that if an environmental factor contributes to a groundwater contamination, the spatial distribution of the groundwater contamination should be similar to that of the environmental factor, and this spatial association is measured by Power of Determinant (PD) value, which is explained next. For illustration purpose and simplicity, we will use rainfall as an example explanatory (determinant) variable to explain how this method works.
Since our basic analysis unit is watershed (see section 2.2.1), the nitrate data and all potential environmental factors are pre-processed to this basic analysis unit (). To evaluate the spatial association between nitrate level and rainfall factor, rainfall is reclassified into five different sub-regions (levels) from low value (level 1) to high value (level 5) (). Next, PWN>5 by watershed () is overlaid over the rainfall zone map () and the mean and variance of PWN>5 within each rainfall sub-region is calculated (). The variance of each sub-region is compared with the variance of entire CV to determine if rainfall is an important factor controlling the groundwater nitrate contamination in CV.
Figure 16. Illustration of geodetector method and basic analysis unit (watershed). See text for detail. (a) basic analysis unit: watershed; (b) sub-regions of study area based on one factor (rainfall); (c) overlay of basic analysis unit and sub-regions for geodetector analysis.
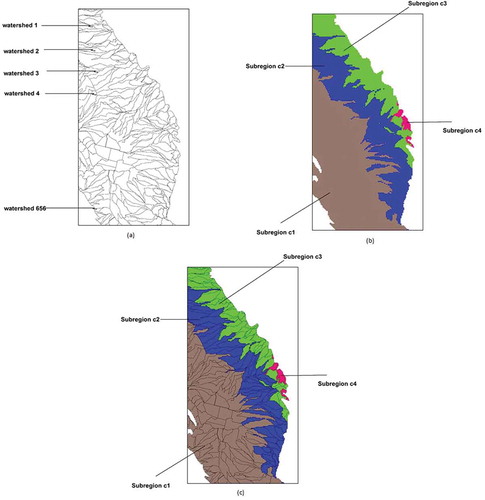
Let’s suppose MCi (i = 1,2,…,5) is the average of PWN>5 for all the watersheds within each sub-region of rainfall (Ci). Similarly, variance of each sub-region is given by VarCi (i = 1,2,…, 5). Variance of all the watersheds within the entire CV is given by VarE. In the ideal case where the groundwater nitrate contamination is completely dependent on rainfall (C), the spatial distribution of the two would be the same and the variance of nitrate contamination within in each rainfall sub-region Ci would be 0, that is, VarSi = 0 (i = 1, 2, …, 5). If the nitrate contamination is completely independent of rainfall (C), the weighted sum of the dispersion variance of each sub-region (weighted by area) is equal to the dispersion variance of the entire CV. The power of determinant (PD) is then given by the formula (Wang et al. Citation2010):
where A represents the area of entire study area and VarE the variance of PWN>5 in entire CV. ACi and VarCi (i =1,2,…,5) represent, respectively, the area and variance of each sub-region Ci. In reality, the value of PD ranges from 0 to 1. The PD value will be equal to 1 if the explanatory variable rainfall (C) completely controls the groundwater nitrate contaminations, and it will be zero if it is completely independent of groundwater nitrate contaminations. Values closer to 1 suggest greater contribution to the groundwater nitrate by the rainfall as a determinant variable.
3.1. Risk detector
Risk detector calculates the mean value of nitrate concentration of wells of each sub-region and tests if the mean value is statistically significantly different with mean value of all the remaining sub-regions. As the explanatory variable rainfall (continuous variable) is discretized from Level 1 to Level 5 (low to high), risk detector identifies in which level has highest mean nitrate concentration compared to others and if it is statistically significant or not. For example, it identifies which sub-region (Level 1 to Level 5) of factor C (e.g. rainfall) contributes more or is more vulnerable to the groundwater nitrate contamination. For categorical variables, it is important to compare the mean values of each sub-region with the remaining sub-regions. Average value of PWN>5 of watersheds is calculated for each sub-region. The sub-regions (stratified by explanatory variable C) are ordered in descending order of high values. Either sample random variation or fundamental difference of superpopulation could result in difference between the means of two sub-regions. Let Mci (i =1,2,…,5) be the average value of each sub-region stratified by factor C (e.g. rainfall). The statistical t-test for distribution having an unequal variance can now be applied to see if the difference in the average values between two sub-regions is statistically significant. The larger the difference, the greater the risk of groundwater contamination in the sub-region. It is given as the formula below (Wang et al. Citation2010):
where nz,p is the number of sample units p in zone z. The null hypothesis is given as
H0: MC=1 = MC=2. The hypothesis is tested at 0.05 significant level, and if the null hypothesis is rejected, it indicates that the difference between two zones is statistically significant.
3.2. Factor detector
Factor detector is based on the PD values as discussed above, to determine if the geographical stratum of an explanatory variable (e.g. rainfall) is responsible for the observed spatial pattern of groundwater contamination in CV. High PD value means that it is strongly responsible for the contamination.
3.3. Ecological detector
Ecological Detector compares if the geographical stratum of C (e.g. rainfall) contributes to the groundwater nitrate contamination more significantly than another geographical stratum of D (e.g. permeability). If C (e.g. rainfall) has more control over the contamination, it will have the lower dispersion variance. The F test for this is given by the formula below (Wang et al. Citation2010):
where nC,p and nD,p denote the number of sample units p within the coverage of C and D. The variable (or geographical space) that corresponds with the nitrate contamination more will have a higher dispersion variance.
3.4. Interaction detector
Interaction detector is used to assess if two explanatory variables when combined will enhance, weaken or are independent of the nitrate contaminations rate in CV. Interaction detector will help us analyse whether interaction between certain factors will magnify the groundwater nitrate contribution or not. For example, would areas with both high rainfall and high permeability increase the chance of greater seepage of nitrate into the groundwater? Would soil with high clay content combined with rainfall reduce the nitrate leaching to the ground? The interaction between two factors is assessed by computing PD values of a new factor created by overlaying the two factors and comparing the PD value of the new factor with that of each individual factor, for example, non-linear enhancement exists if the PD value of the new factor is greater than the PD value of each individual factor summed together (Wang et al. Citation2010).
4. Results and interpretation
The geodetector method was very effective to understand the different spatial pattern of groundwater nitrate concentration and identifying the vulnerable areas within the valley. shows 169 watersheds that had PWN>5 in CV aquifer. Contaminated watersheds were spread out throughout the valley. However, more watersheds were contaminated in San Joaquin Basin and Tulare Basin than Sacramento Valley.
4.1. Factor detector
The results of this study uncovered an interesting spatial pattern and how nitrate contamination in the Central Valley (CV) is associated with different independent variables. The factor detector PD values which quantify the impact of several independent variables on groundwater nitrate concentration in descending order are listed below:
Precipitation (0.30) > Fertilizer Load (0.22) > Elevation (0.18) > Manure Load (0.16) > Percent Clay (0.11) > Permeability (0.11) > Dissolved Oxygen (0.10) > Percent Cropland (0.079) > Iron (0.007) > Slope (0.042) > Recharge Rate (0.030) > Manganese (0.008).
The result shows that from a single factor perspective, both source factors (fertilizer and manure) and aquifer susceptibility factors (precipitation, elevation, percent clay and permeability) played more dominant roles than geochemical condition factors (dissolved oxygen and iron) and other susceptibility factors. Multiple studies have shown increasing nitrate concentration due to fertilizer load, manure load and increasing cropland and have considered these three factors as major sources of input of nitrogen into the groundwater (Li, Merchant, and Chen Citation2014; Bennett, Miranda, and Belitz Citation2011; Burrow, Shelton, and Dubrovsky Citation2008). The PD values from geodetector for these three factors in this study were 0.21, 0.16 and 0.07, respectively.
4.2. Risk detector
4.2.1. Source variables
Risk detector in Table S1 (Supporting Document) shows average PWN>5 at different levels (i.e. zonal mean) for each explanatory variable and indicates whether there are statistically significant differences between these different zonal means. As the fertilizer load increased (from level 1 to level 5), PWN>5 in the sub-region also increased, suggesting that groundwater in sub-regions with high fertilizer loading is more contaminated (). The difference in PWN>5 between low fertilizer zone (level 1) and high fertilizer zone (level 5) was statistically significant. Similarly, higher manure input (level 4) is associated with statistically significant higher PWN>5 (52.90 %) as compared to only 29.46 % well at low level 1. The statistically significant difference in the average value of PWN>5 between low fertilizer and higher fertilizer areas establishes a strong correspondence of nutrient input with groundwater nitrate contamination in the Central Valley. Similar trend was observed for manure with statistically significant difference between low manure areas (PWN>5 =29.46%) and high manure areas (PWN>5 =52.90%) (see Table S1). Although cropland did not have notable PD value (0.079), the risk detector revealed an increasing trend of PWN>5 (from 30.85 % to 53.63%) as percent cropland increases from level 1 to level 5, with statistically significant difference between low percent cropland and high percent cropland (see Table S1). Areas with high nitrogen fertilizer input and manure input and areas with high croplands were shown to have higher values of PWN>5. Similarly, manure loading was also highest in the Tulare and San Joaquin Basin (). However, Tulare basin did not have high input of manure except Tulare County. Sacramento Valley was also observed to have low manure input. Manure inputs were mostly concentrated in Merced and Staninslaus county of San Joaquin Valley.
4.2.2. Aquifer susceptibility
Precipitation in the CV is one of the most important explanatory variables in CV (PD =0.30), and the geographical stratum with different levels of precipitation in the CV has been found to have a good control over the groundwater nitrate contamination in CV. Sub-regions with a low level of rainfall were found to have higher average values (46.43 %) of PWN>5 than sub-regions with a high level of rainfall (19.16%) (See Table S1). In CV, these low rainfall areas are in the San Joaquin Basin and Tulare Basin and high rainfall areas are in the north Sacramento Valley (). Rainfall has been found to affect the groundwater nitrate contamination both positively by enhancing the downward percolation (Mosier, Syers, and Freney Citation2004) and negatively by diluting the water (Robins Citation1998). The low concentration in Sacramento Valley could be attributed to multiple factors like higher nitrogen uptake by plants, small size sediments, dilution effect or some combination of them. San Joaquin and Tulare basins are heavily irrigated land in CV where land surface is tilled to grow crops. In addition, different crop cultivation practices (Lord, Anthony, and Goodlass Citation2002), nutrient uptake rate by plants and season of the year (Mosier, Syers, and Freney Citation2004) all could influence the nitrate percolation rate into groundwater.
Elevation data for the Central Valley show that elevation is relatively lower in the north where most of Sacramento Valley is located. Most of the San Joaquin falls in the low to middle range of elevation and Tulare Basin in higher elevation. Other higher elevations are in the eastern and western margin of the Tulare basin which fall under Fresno, Tulare and Kern counties. This covers only a small percent of the Tulare Basin (). Usually, areas with lower elevation have water table closer to land surface, which increases the chance of groundwater contamination as it take less time to travel down and also less soil to convert the nitrate into other forms. However, there is statistically significantly lower PWN>5 in Sacramento (low elevation, PWN>5 =33.10%) than San Joaquin basin (PWN>5 =54%, see Table S1), suggesting that nitrogen input variables are more important in Tulare and San Joaquin basins, leading to more contaminated wells there. Groundwater contamination was also low at statistically significant level around the higher elevation areas on eastern and western coast of Tulare Basin. Relatively, in higher elevation areas, water table is at a greater depth and the rate of fertilizer, manure and percent cropland is also low, resulting in less contamination in the groundwater. Slope () showed a distinct pattern with 43.26 % well contaminated in low slope areas (level 1) that covers most of the CV and was significantly higher than that in higher slope areas (level 3 and level 2) along the margins of the valley (PWN>5 =18.9% and 35.55% see Table S1), consistent with the fact that steeper slope promotes surface run-off, whereas gentler slope facilitates download percolation.
Percent clay, which is fine grain sized particles in the soil, limits the percolation of water. In general, PWN>5 increased as the percent clay decreased. Percent clay was low in central part of San Joaquin, eastern and southern part of Tulare Basin which could have altered the downward percolation of nitrate contaminated water from the cropland in those areas (). Faunt, Belitz, and Hanson (Citation2009) developed the distribution of coarse-grained deposits in the Central Valley based on kriging interpolation of the data from drillers’ logs of boreholes and incorporated the data into a model to predict groundwater availability in the valley. Eastern side of the San Joaquin Valley was found to have coarse-grained texture, whereas Sacramento Valley was dominated by fine grained sediments. These findings are consistent with our percent clay result revealed by risk detector analysis.
Factors like permeability determine the rate of percolation of surface water (including dissolved nitrate) into the groundwater aquifer. Risk Detector showed that less numbers of wells contaminated (PWN>5 =33.91%) in area with less permeability (level 1) than that (PWN>5 =61.47%) in areas with high permeability (level 5) (), and the difference is statistically significant (Table S1). This is consistent with expectation as a higher permeability zone would make it easier for contaminants to percolate into the groundwater.
4.2.3. Geochemical conditions
Geochemical conditions are important in the reduction or oxidation of groundwater nitrate contamination. Our risk detector result of dissolved oxygen (DO) showed a clear trend of low PWN>5 in areas of low oxygen concentration, as low oxygen could enhance the denitrification process and create reducing conditions for nitrate to convert into atmospheric nitrogen ( and Table S1). Manganese and Iron did not show a clear trend. In Sacramento Valley, where there is ample precipitation, DO levels were low, which could create the reducing conditions for nitrate to decompose. In general, dissolved oxygen levels were higher in the eastern side of the valley and therefore do not provide the reducing conditions for nitrate to decompose. Burow et al. (Citation2012) also observed higher nitrate concentration level in the eastern side of the valley and attributed it to the high dissolved oxygen level. Areas of low dissolved oxygen were concentrated in most parts of Sacramento Valley and western parts of both San Joaquin and Tulare Basin. Risk detector was able to capture this trend by showing statistically significant difference between areas of high and low dissolved oxygen (Table S1).
4.3. Ecological detector
The result of ecological detector is available in Table S2 (Supporting Document). The results indicate that geographical stratum associated with precipitation is more important than geographical stratum of slope and recharge rate. Precipitation also has the higher PD values than slope and recharge rate, suggesting the groundwater contaminant pattern corresponding more with the rainfall pattern in CV. Although other explanatory variables did not come up as significantly different, there is still some degree of pattern that can be visually observed and could be studied under interaction detector.
4.4. Interaction detector
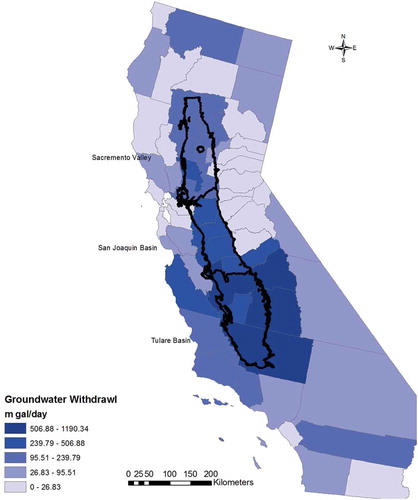
The results of interaction detector in Table S3 (Supporting Document) revealed that most of the factors interact and enhance the effect of nitrate contamination in Central Valley. In general, most of the interaction values were higher than single value for determinant and the enhancement type was non-linear, suggesting that these factors contribute to higher nitrate concentration in combination than in isolation. Although ecological detector did not observe that one input variables were more important than another for most variables, interaction detector measured strong non-linear increase in their values when interactions were considered. In particular, nitrogen input factors can interact with hydrogeological conditions and geochemical variables to exacerbate the groundwater nitrate contamination. PD values of fertilizer interacting with precipitation (0.38), permeability (0.37) and manure (0.36) and recharge (0.35) show that these interactions could enhance the groundwater nitrate concentration. It is also interesting to observe that fertilizer and manure interaction value has a non-linear increase (0.36), suggesting that they are likely applied in the common cropland. Manure also showed strong interaction values with rainfall (0.40) and permeability (0.41), suggesting that manure could be easily mobilized into the groundwater in areas with higher rainfall and permeability. Cropland also showed similar results with high non-linear increase with precipitation (0.38) and permeability (0.36). Furthermore, higher PD values for interaction of cropland with fertilizer (0.34), precipitation (0.38) and permeability (0.36) support the previous findings that other hydrogeological conditions in the basin enhance the aquifer susceptibility to nitrate contamination. Both San Joaquin Basin and Tulare Basin have pumped out groundwater extensively for the past few decades which have altered the groundwater flow pattern, thereby altering other geochemical conditions in the area. (USGS Citation2010) water use data show that Tulare County, Kern County and Fresno County draw groundwater up to nearly 1200 m gal/day for irrigation and are highest withdraw in the Central Valley (). Rainfall distribution is uneven in the Central Valley. Most of the rainfall occurs in the northern part of the valley in Sacramento Valley and Redding area. Tulare Basin and San Joaquin Basin fall under low rainfall area in the valley which caused the area to heavily depend on groundwater for irrigation. The over extraction of groundwater could lower the water table and increase hydraulic head, which could in turn alter the groundwater flow pattern and increase flow rate, enhancing the rate of nitrate contaminants percolating deeper into groundwater aquifer.
Figure 17. County groundwater withdrawal in Central Valley in m gal/day.
5. Discussion
This study utilized the geodetector method consisting of four major analyses performed at Central Valley to locate areas of higher groundwater nitrate vulnerability, to identify major determinants of groundwater nitrate concentration in CV, to calculate risk differences between different geographical stratums and to reveal how determinant would interact with each other to weaken or strengthen their effect to groundwater nitrate contamination.
Out of the 656 6th level watersheds in the CV, only 169 watersheds were found to have average concentration ≥5mg/L for the study period of over a decade. Watersheds with higher percent of wells above background concentrations were mostly located in the Tulare Basin and San Joaquin Valley. The rise in the groundwater nitrate concentration has been attributed to the increasing nutrient load in the cropland and the interaction between nutrient input variables and some hydrogeological parameters. The result of this study is consistent with previous findings regarding hydrogeological parameters of Central Valley based on local scale studies. The geodetector method revealed unique and quantitative insight into how different factors and their interactions influence the spatial variation in groundwater nitrate contamination level that other traditional statistical methods often fail to provide. Nitrate concentration in the groundwater of Central Valley is attributed to agricultural practice for the last couple of decades which has caused the contamination of shallow wells. Although San Joaquin and Tulare Basin receive low amount of rainfall, high amount of water pumped for irrigation has lowered the water table in this area, inducing higher hydraulic head and higher percolation rate. The current nitrate concentration in the shallow wells could percolate even further down and contaminate deeper aquifer in the coming years (Burrow, Dubrovsky, and Shelton Citation2007).
Long-term groundwater data are difficult to obtain and could be spatially biased due to expensive cost involved and limited resources available. The results of this study are based on a compilation of decade long data collected by NAWQA, NWIS and GAMA in an attempt to cover the entire CV and to evaluate contributing factors to the last 10–12 years of groundwater nitrate concentration. Based on the sampling distribution of wells, only 285 watersheds were sampled at least once over the study period and only 169 watersheds had at least one well above average background concentration. The percent of wells above the background concentration in each watershed is a very close approximation to represent the status groundwater contamination in that watershed. However, careful observation is needed for watersheds that are not sampled frequently as it might be difficult to tell with certainty the real scenario of the watershed only based on few samples. More evenly distributed sampling distribution in the valley could improve the result further in the future. Besides the sampling limitation, future study could also be improved by considering the seasonal variation pattern of nitrate concentration and the proximity of nitrogen sources, for example, by making a buffer region of 500 m around the well to see the effect of landuse on nitrate concentration in the well (Lockhart, King, and Harter Citation2013).
6. Conclusion
This study is focused on the understanding the spatial variation of groundwater nitrate contamination in the entire Central Valley aquifer. The purpose of this research was not only to identify the variables which could affect the groundwater nitrate contamination but also to see them in relation to their spatial association with the other determinants. The geodetector method identified nitrogen fertilizer, manure, and percent cropland as leading source factors in the study area and the statistically significant difference in nitrate level between areas of low and high fertilizer, low and high manure, low and high cropland established their strong control of nitrate distribution. Our results also revealed that these factors interacted with the hydrogeological parameters in exacerbating the groundwater nitrate contamination in the study area. These findings are based on data for the entire CV using a new method and are consistent with previous local studies. This research also identifies areas more vulnerable to nitrate contamination in the Central Valley. The geodetector method, originated in medical geography studies, is an effective tool in understanding the how nitrate contamination is distributed over the Central Valley and how different hydrogeological parameters could interact with the nitrogen input sources to determine the concentration in the groundwater. Geodetector method has great potential to be applied in other similar studies.
Acknowledgement
We thank two anonymous reviewers for their careful reviews of the manuscript.
Disclosure statement
No potential conflict of interest was reported by the authors.
Supplemental data for this article can be accessed here.
References
- Anning, D. W., A. P. Paul, T. S. McKinney, and J. M. Huntington. 2012. Predicted Nitrate and Arsenic Concentrations in Basin-Fill Aquifers of the Southwestern United States. Scientific Investigation Report 2012-5065, Reston, Virginia: U.S Geological Survey.
- Bennett, G. L., M. S. Fram, and K. Belitz. 2011. Status of Groundwater Quality in the Southern, Middle and Northern Sacramento Valley Study Unites, 2005-08: CaliforniaGAMA Priorty Basin Project. USGS Scientific Investigation Report 2011-5002, Reston, Virginia: U.S Geological Survey.
- Bertoldi, G. L., R. H. Johnston, and K. D. Evenson. 1991. Ground Water in the Central Valley, California-A Summary Report. U.S. Geological Survey Professional Paper Paper 1401-A, Washtington: United States Printing Office.
- Burow, K. R., S. V. Stork, and N. M. Dubvorsky. 1998. Nitrate and Pesticides in Ground Water in the Eastern San Joaquin Valley, California: Occurrence and Trends. Water Resources Investigations Report 98-4040, Sacramento, CA: U.S. Geological Survey, 98-4040.
- Burow, K. R., B. C. Jurgens, K. Belitz, and N. M. Durborsky. 2012. “Assessment of Regional Change in Nitrate Concentrations in Groundwater in the Central Valley, California.” Environmental Earth Science (Environmental Earth Science) 69 (8): 2609–2621.
- Burrow, K. R., N. M. Dubrovsky, and J. L. Shelton. 2007. “Temporal Trends in Concentrations of DBCP and Nitrate in Ground Water in the Eastern San Joaquin Valley. California. USA.” Hydrogeology 15: 991–1007. doi:10.1007/s10040-006-0148-7.
- Burrow, K. R., J. L. Shelton, and N. M. Dubrovsky. 2008. “Regional Nitrate and Pesticide Trends in Groundwate in the Eastern San Joaquin Valley, California.” Journal of Environmental Quality 37 (5 Suppl): S249–S263. doi:10.2134/jeq2007.0061.
- Cao, F., Y. Ge, and J. F. Wang. 2013. “Optimal Discretization for Geographical Discretization for Geographical Detector-Based Risk Assessent.” GIScience and Remote Sensing 50: 78–92.
- Du, Z., X. Xu, H. Zhang, Z. Wu, and Y. Liu. 2016. “Geographical Detector-Ased Indentification of the Impact of Major Determinant on Aeolian Desertification Risk.” Plos One 11 (3). doi:10.1371/journal.pone.0151331.
- Dubrovsky, N. M., K. R. Burrow, G. M. Clark, J. M. Gronberg, P. A. Hitt, and K. J. Hamilton. 2010. The Quality of Our Nation’s Water-Nutrients in the Nation’s Streams and Groundwater.1992-2004. USGS Circulaar 1350, Reston, Virginia: U.S Geological Survey.
- Elmi, A. A., C. Madramootoo, M. Egeh, A. Liu, and C. Hamael. 2002. “Environmental and Agronomic Implications of Water Table and Nitrogen Fertilization Management.” Journal of Environmental Quality 31: 1858-1867.
- Faunt, C. C., K. Belitz, and R. T. Hanson. 2009. “Development of a Three-Dimensional Model of Sedimentary Texture in Valley-Fill Deposits of Central Valley, California, USA.” Hydrogeology 18: 625–649. doi:10.1007/s10040-009-0539-7.
- Faunt, C. C., R. T. Hanson, and K. Belitz. 2009. Groundwater Availability of the Central Valley Aquifer, California. Professional Paper 1766, Reston, Virginia: U.S. Geological Survey.
- Fisher, I. J., and P. J. Phillips. 2014. “Trends in Nitrate Concentration in Suffolk County Water Authority Public Supply Wells, NewYork, 1982-2008.” 21st Conference on Geology of Long Island and Metropolitan New York. Stony Brook, NY: US Geological Survey.
- Focazio, M. J., T. E. Reilly, M. G. Rupert, and D. R. Helsel. 2002. Assessing Groundwater Vulnerability to Contamination: Providing scientifically Defensible Information for Decision Makers. US Geological Survey Circular 1224, Reston, Virginia: Library of Congress Cataloging-in- Publication Data.
- Gurdak, J. J., and S. L. Qi. 2012. “Vulnerability of Recently Recharged Groundwater in Principle Aquifers of the United States to Nitrate Contamination.” Environmental Science and Technology 46: 6004−6012.
- Harter. 2009. “Agricultural Impacts on Groundwater Nitrate.” Southwest Hydrology 8 (4): 22−23. http://www.swhydro.arizona.edu/archive/V8_N4/
- Harter, T., J. R. Lund, J. Darby, E. F. Graham, R. Howitt, K. K. Jessoe, S. Pettygrove, J. F. Quinn, and J. H. Viers. 2012. Addressing Nitrate in Californias Drinking Water With a Focus on Tulare Lake Basin and Salinas Valley Groundwater. Report for the State Water Resources Control Board Report to the Legislature, Davis, CA: Center for Watershed Sciences, University of California.
- Kaown, D., Y. Hyun, G.-O. Bae, and K.-K. Lee. 2007. “Factors Effecting the Spatial Pattern of Nitrate Contamination in Shallow Groundwater.” Journal of Environmental Quality 36: 1479–1487. doi:10.2134/jeq2006.0361.
- Li, R., M. James, and X.-H. Chen. 2014. “A Geospatial Approach for Assessing Groundwater Vulnerability to Nitrate Contamination in Agricultural Settings.” Water Air Soil Pollution 225 (12): 1–17. doi:10.1007/s11270-014-2214-4
- Lindsey, B. D., and M. G. Rupert. 2012. Methods for Evaluating Temporal Groundwater Quality Data and Results of Decadal-Scale Changes in Chloride, Dissolved Solids, and Nitrate Concentrations in Groundwater in the United States1988–2010. U.S. Geological Survey Scientific Investigations Report 2012–5049, Reston, Virginia: U.S Geological Survey.
- Lo, M.-H., and J. S. Famiglietti. 2013. “Irrigation in California’s Central Valley Strengthens the Southwestern.” Geophysical Research Letters 40: 301–306. doi:10.1002/grl.50108.
- Lockhart, K. M., A. M. King, and T. Harter. 2013. “Identifying Sources of Groundwater Nitrate Contamination in a Large Alluvial Groundwater Basin with Highly Diversified Intensive Agricultural Production.” Journal of Contaminant Hydrology 151: 140–154. doi:10.1016/j.jconhyd.2013.05.008.
- Lord, E. I., S. G. Anthony, and G. Goodlass. 2002. “Agricultural Nitrogen Balance and Water Quality in the UK.” Soil Use and Management 18: 363–369. doi:10.1111/j.1475-2743.2002.tb00253.x.
- Luo, W., J. Jasiewicz, T. Stepinski, J. Wang, C. Xu, and X. Cang. 2015. “Spatial Association between Dissection Density and Environmental Factor over the Entire Conterminous United States.” Geophysical Research Letter 43 (2): 692–700. doi:10.1002/2015GL066941.
- Minshew, H., J. Selker, D. Hemphill, and R. P. Dick. 2002. “NLEAP Computer Model and Multiple Linear Regression Prediction of Nitrate Leaching in Vegetable System.” HorTechnology 12: 250–256.
- Mosier, A. R., K. J. Syers, and J. R. Freney. 2004. Agriculture and the Nitrogen Cycle. Washington DC, USA: Island Press.
- Nightingale, H. I. 1970. “Statistical Evaluation of Salinity and Nitrate Content and Trends beneath Urban and Agricultural areas-Fresno, California.” Groundwater 8 (1): 22–28. doi:10.1111/gwat.1970.8.issue-1.
- Nolan, B. T., J. M. Gronberg, C. C. Faunt, S. M. Eberts, and K. Belitz. 2014. “Modeling Nitrate at Domestic and Public-Supply Well Depths in the Central Valley, California.” Environmental Science and Technology 48 (10): 5643–5651. doi:10.1021/es405452q.
- Nolan, B. T., K. J. Hitt, and B. C. Ruddy. 2002. “Probability of Nitrate Contamination of Recently Recharged Groundwaters in the Conterminous United States.” Environmental Science and Technology 36: 2138–2145. doi:10.1021/es0113854.
- Nolan, B. T., and B. Ruddy. 1996. Nitrate in the Groundwater of United States-Assessing the Risk. Fact Sheet FS-092-96, Reston, Virginia: US Geological Survey.
- Nolan, B. T., B. C. Ruddy, K. J. Hitt, and D. R. Helsel. 1998. “A National Look at Nitrate Contamination of Groundwater.” Water Conditioning and Purification 39: 76–79.
- Nolan, B. T., and K. J. Hitt. 2006. “Vulnerability of Shallow Groundwater and Drinking Water Wells to Nitrates in the United States .” Environmental Science and Technology 40: 7834–7840. doi:10.1021/es060911u.
- Robins, N. S. 1998. “Recharge: The Key to Groundwater Pollution and Aquifer Vulnerability.” Groundwater Pollution, Aquifer Recharge and Vulnerability, Geological Society London 130: 1–5.
- Rupert, M. G. 2001. “Calibration of the DRASTIC Groundwater Vulnerability Mapping Method.” Groundwater 39: 625–630. doi:10.1111/j.1745-6584.2001.tb02350.x.
- USGS. 2010. “USGS Water Science School.” http://water.usgs.gov/edu/wateruse-total.html.
- USGS. 2013. Federal Standard and Procedures for the National Watershed Boundary Dataset (WBD). Reston, Virginia: US Geological Survey.
- USGS, United States Geological Survey. 2015. Groundwater Depletion. Accessed May 1, 2016. http://water.usgs.gov/edu/gwdepletion.html.
- Van Der Schans, M. L., T. Harter, A. Leijnse, and M. C. Mathews. 2009. “Characterizing Sources of Nitrae Leaching from an Irrigated Dairy Farm in Merced County, California.” Journal of Contaminant Hydrology 110: 9–21. doi:10.1016/j.jconhyd.2009.06.002.
- Viers, J. H., D. Liptzin, T. S. Rosentock, V. B. Jensen, A. D. Hollander, A. McNally, A. M. King, et al. 2012. Addressing Nitrate in California’s Drinking Water with a Focus on Tulare Lake Basin and Salinas Valley Groundwater, Report for the State Water Resources Control Board Report to the Legislature. Center for Watershed Sciences, University of California, Davis.
- Wang, J.-F., L. Xin-HU, G. Christakoss, Y.-L. Liao, T. Zhang, G. Xue, and X.-Y. Zheng. 2010. “Geographical Detectors-Based Health Risk Assessment and Its Application in the Neural Tube Defects Study of the Heshun Region China.” International Journal of Geographical Information Science 24: 107–127. doi:10.1080/13658810802443457.
- Wang, X., X. I. Jianchao, Y. Dongyang, and C. Tian. 2016. “Spatial Differentiation of Rural Touristization and Its Determinants in China: A Geodector-Based Case Study of Yesanpo Scenic Area.” Journal of Resource and Ecology 7 (6): 464–471. doi:10.5814/j.issn.1674-764x.2016.06.006.
- Wolock, D. M. 2003. “Estimated Mean Annual Natural Ground-Water Recharge in the Conterminous United States.” In US Geological Survey Open-File Report 03-311. Reston, VA: US Geological Survey.