
ABSTRACT
With as many as 4 million passenger journeys within the London Underground system every weekday, the advertisement spaces across the stations hold considerable potential. However, the planning of specific advertisements across time and space is difficult to optimize as little is known about passers-by. Therefore, in order to generate detailed and quantifiable spatio-temporal information which is particular to each station area, we have explored local social media data. This research demonstrates how local interests can be mined from geotagged Tweets by using Latent Dirichlet Allocation, an unsupervised topic modelling method. The relative popularity of each of the key topics is then explored spatially and temporally between the station areas. Overall, this research demonstrates the value of using Geographical Information System and text-mining techniques to generate valuable spatio-temporal information on popular interests from Twitter data.
Introduction
Conventional outdoor advertising, known as out-of-home (OOH) advertising, focuses on marketing by means such as billboards and posters in public spaces (David, Yadav, and Donthu Citation2006). Whilst it is one challenge to make an advert noticeable, it is another to ensure it is viewed by a sizeable, but also receptive, audience (Pieters, Warlop, and Wedel Citation2002). Recently, the development of digital out-of-home (DOOH) advertisements with digital billboards makes outdoor advertising more flexible and enables the advertising schedules to respond to changes in their audiences across time (Lasinger and Bauer Citation2013). To maximize efficiency, advertisements should be targeted, which is to ‘provide the right content in the right format to the right person at the right time’ (Tam and Ho Citation2006), and moreover, in the right place too. Therefore, considerable research and development has gone into devising more productive and targeted outdoor advertising strategies (Glover, Hartley, and Patti Citation1989; David, Yadav, and Donthu Citation2006; Cronin Citation2008).
However, this is particularly challenging in the case of OOH advertising as it is difficult to acquire detailed data on potential audiences in public places, especially given that they may change routinely throughout the week. In addition, even where dynamic population data are available, it is another challenge to link them to their possible consumer interests. These are both challenges that we believe social media data may be able to address.
One of the greatest sources of spatial demographic information for OOH advertisement planners has been geodemographic data sets such as publically available official statistics (such as the Census) or commercial equivalents (Cronin Citation2008). However, geodemographic data are typically restricted to residential geographies and are usually collected at a low temporal frequency. In the UK, workplace and workday statistics from the 2011 Census have enabled researchers and marketers to take advantage of daytime population data. However, these data still do not accurately represent daily mobility flows at a fine scale. Therefore, it is still challenging to effectively target advertisements in public spaces where the audiences routinely change throughout the day and week.
The other core limitation of utilizing geodemographic data sets is that they do not explicitly collect information on interests; an association is usually inferred based on market research. Whilst online market research has benefited from detailed individual level data on their audiences from browser histories or even purchase histories (Tam and Ho Citation2006; Kazienko and Adamski Citation2007; Yan et al. Citation2009), it is far more difficult to acquire data on the possible consumer interests of audiences of outdoor advertisements. Surveys, for instance, are costly and have undoubtable sampling issues (Shimp and Andrews Citation2012; Chan and Fung Citation2013).
Social media services such as Twitter produce large volumes of spatio-temporal data across urban areas. Crucially, they also include the content of posts which are written by individual users. Often these are uploaded from handheld devices so they can be written in most settings. There is the potential of harvesting their data to produce aggregate information on the users’ interests and opinions, and linking them to places and time periods. This could form useful insight for DOOH advertisers wishing to target their advertisements to maximize audience reception across time and space.
Twitter is an online microblogging platform which allows users to transmit short posts up to 140 characters long known as Tweets. There are 313 million monthly active users all over the world, 82% of the users access the service via mobile devices (https://about.twitter.com) and a small proportion of these users also volunteer their location when they post messages too. Due to its timestamp and geotag features and its ready availability, Twitter data has been widely explored as a means of understanding public interests across an urban environment, both spatially and temporally (Java et al. Citation2007; Zhao et al. Citation2011). Many researchers have sought to discover topics from Twitter data by text-mining Tweets. Often topic-based research has aimed to identify unique abnormal events (Chae et al. Citation2012). These studies either required predefined topics, such as ‘earthquake’ (Caragea et al. Citation2011), ‘flu’ (Chew and Eysenbach Citation2010) and ‘obesity’ (Ghosh and Guha Citation2013), or focused on unusual fluctuations in space and time relative to normal activity (Cheng and Wicks Citation2014). Other research extracted urban daily topics and identified functional areas of cities according to the Tweets on particular topics (Pozdnoukhov and Kaiser Citation2011; Kling and Pozdnoukhov Citation2012; Hasan, Zhan, and Ukkusuri Citation2013). However, there has been limited focus on how the composition of everyday popular topics may vary across space and time within a city, and how to harvest the social media data to improve targeted advertising.
Therefore, the aim of this paper is to develop a methodological framework to provide insight on popular interests around given places from mining geotagged Twitter data. We demonstrate this using Twitter data to identify variances across areas in the vicinity of London Underground stations at different time periods. We then aggregate the data to explore trends and to estimate how the suitability of audiences could vary between stations and at different times of the day. The areas around Underground stations make a useful case study in the context of market research for DOOH advertising, given the high footfall and possible diversity of interests experienced across station areas each day (JCDecaux Transport Citation2011; Exterion Media Citation2017). The methodology and analysis presented in this paper uses the London Underground network as a case study; however, they can also be applied to other urban settings around the world.
Methodology
In order to provide the right content to the right person at the right time in the right place, we need to be able to understand the dynamic interests of people in the areas of each advertisement space. For the ease of explaining the methods, we chose to focus on areas around London Underground stations as a demonstration as they cover a diverse range of urban areas.
We have devised a methodology to quantify the topics written about in Tweets around each station within different weekly time periods and then compared the popularity of the topics across both time and space. The information can be used to determine the dominant interests (to guide advert selection) for a particular location and time, or alternatively, identify the best locations and times for particular target audience instead. Our methodology is split into four key steps:
Data preprocessing
Space–time topic extraction
Audience size estimation
Targeted advertisement for places and topics
These four steps are demonstrated by the flow chart in . This section is organized according to the procedure illustrated in the flow chart, explaining the method developed in each step of the framework.
Figure 1. Flow chart of research framework.
Data preprocessing
The geotagged Twitter data can be acquired from Twitter Streaming Application Programming Interface (API) service (https://dev.Twitter.com/docs/streaming-apis). Even though the Twitter streaming API only returns 1% of the total Twitter data, the randomly sampled Tweets are still relatively representative of activity on Twitter (Morstatter, Pfeffer, and Liu Citation2014). Tweets from 1 January 2013 to 31 December 2013 were downloaded, then filtered with a bounding box which covers the Greater London area (latitude, longitude: 51.80, −0.65; 51.20, 0.40). Overall, 10,571,295 Tweets were obtained.
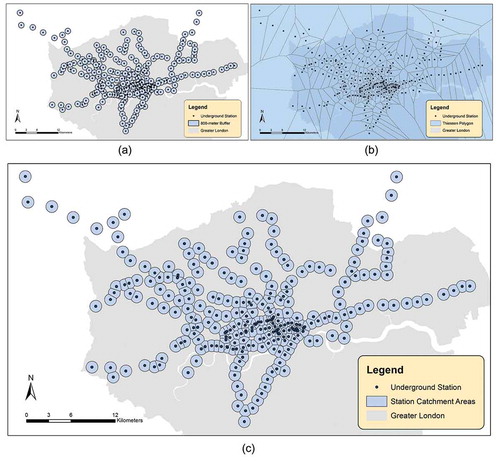
Our next step was to filter Tweets within the vicinity of London Underground stations using a spatial buffer. For this research, we have utilized an 800-m buffer, the rough equivalent of a 10-min walking distance. Buffers of this size were large enough to encompass a large number of Tweets for each place, but also small enough for the catchment to retain the character of the immediate environment. To prevent catchment areas from overlapping and obscuring local trends, Thiessen polygons (also known as Voronoi polygons) were created to define a unique coverage for each Underground station (see Aurenhammer Citation1991). The final catchment areas for the stations were created by clipping the buffers with the Thiessen polygons as shown in .
Figure 2. Creating unique catchment areas for the stations by clipping 800-m buffers with Thiessen Polygons. (a) 800-m buffers around the stations; (b) Thiessen Polygons of the stations; (c) the unique catchment areas for the stations.
One of the aims of the study is to demonstrate routine temporal variations in topic popularity across the station areas. For instance, we consider that different audiences at any given place may vary between weekends and weekdays, and by time of day too. To generalize such trends, Tweets have been allocated into four 6-h periods (00:00–06:00, 06:00–12:00, 12:00–18:00, and 18:00–24:00). In addition, Tweets from Monday to Thursday and those posted before 18:00 on Friday were allocated into ‘weekdays’ group. Whilst the Tweets posted after 18:00 on Friday and all Tweets on Saturday and Sunday have been allocated into ‘weekends’ group. At the time of the data collection, night services were not run on the London Underground (00:00–06:00). However, as a night-tube service has recently been introduced for weekends, Tweets during this time period were also considered in this research.
A series of natural language processing techniques were applied to clean and format the Twitter text. To do this, the texts of the Tweets was imported as a ‘corpus’, which is a data structure used to manage a collection of documents. The texts were then passed through text-mining procedures such as the removal of whitespaces, numbers, punctuations and URLs. Stopwords (i.e. common words which we wish to ignore, such as ‘I’, ‘and’, ‘the’) were removed according to the English stop word list from SMART information retrieval system (Lewis, Yiming Yang, and Fan Citation2004). Words of two characters or less were deemed to be too short for analysis and were removed too. The process of ‘stemming’ was also applied, which is to reduce inflected words to their stem form by removing suffixes of the words (e.g. ‘ing’, ‘ed’, ‘er’, etc.). This reduced the size of the vocabulary of the corpus and improves the efficiency of the subsequent topic modelling process. Finally, Tweets that became empty due to the previous text cleaning stages were subsequently removed from the sample. Strings were also all converted to lower case. Efforts should also be made to remove false users, particularly those that might produce a large volume of Tweets and are unrepresentative of typical users’ opinion. Therefore, we assumed that duplicated Tweets posted by the same user at the same station area in the same time period are produced by Twitter bots and hence should be removed.
Space–time topic extraction
After text cleaning, a semantic probability-based topic extraction model – Latent Dirichlet Allocation (LDA) was implemented to generate topics (Blei, Andrew, and Jordan Citation2003). LDA is an unsupervised generative model which can be used to classify words into topics and to represent documents as mixtures of topics with different probabilities. As an unsupervised generative model, LDA is more efficient and objective than arbitrary keyword filtering or classification; it is also more sophisticated compared to traditional word frequency-driven approaches (e.g. TF/TF-IDF) (Aggarwal and Zhai Citation2012). LDA has been widely used for text analytics and its suitability in analysing short and informal documents has meant that many researchers have used it to explore Twitter data. Research has commonly focused on detecting and analysing big events or other special events (Caragea et al. Citation2011; Chae et al. Citation2012; Cheng and Wicks Citation2014).
As a bag-of-words model, the main premise of LDA is that words that appear together many times in the documents are assumed to be related or present similar meaning and are, therefore, more likely to be assigned to the same topic. The LDA model repeatedly samples the words from a collection of documents (corpus) to identify the relations between words based on a multinomial distribution (see Blei, Andrew, and Jordan (Citation2003) and Blei, Carin, and Dunson (Citation2010) for full details). Consequently, the words are assigned to multiple topics after iterations of the sampling process. Topics are represented in a probabilistic manner rather than explicitly. They interpreted as a collection of words which each word has a corresponding probability. A single word may be associated with several different topics. The assignment of topics to each document is determined by the probability scores of each word within the document. Therefore, a document or a sentence may belong to several topics to varying extents.
The LDA model is conditioned on three parameters: the Dirichlet hyper parameters α and β, and number of topics (k). The hyper parameters α and β will control the prior of Dirichlet distributions for topic per document and word per topic, respectively. Assuming symmetric Dirichlet distributions, a low alpha (α) value leads to each document composed of only a few dominant topics. Similarly, a low beta (β) value means each topic is likely to contain a mixture of only a few words (Blei, Carin, and Dunson Citation2010). Increasing the number of topics (k) could also make each topic more distinctive, but of course this would mean that individual topics would represent smaller proportions of the overall data. The perplexity scores are commonly used to assist the selection of the number of topics (k) in topic modelling. It is measured as the reciprocal geometric mean of the per-word likelihoods in the test corpus (Chang et al. Citation2009; Blei, Carin, and Dunson Citation2010). A lower value of perplexity may indicate a lower misrepresentation of the words in the trained model. Whilst a higher number of groups will reduce perplexity across the whole data, the extent of which it decreases will vary between different numbers. The estimation of optimal values of the parameters is still an active research challenge and there is no perfect solution which is applicable across all cases (Griffiths and Steyvers Citation2004). It is also favourable to consider the subjective distinctiveness and interpretability of the topics on top of statistical optimization tests (Chang et al. Citation2009). In practice, a range of values for α and β will be explored, and the optimal values of α and β could achieve topics that address specific interests from a fine-grained decomposition of the corpus (Griffiths and Steyvers Citation2004). To assist the selection of appropriate number of topics (k), we can test the LDA on a random sample (say roughly 15% of the case study data) for a range of k (5–50) and observe the perplexity scores for each model. The optimal number of k is reached once the rate of reduction in perplexity begins to reduce.
The cleaned corpus built by the words of the Tweets was entered into the LDA topic model using the ‘lda’ package in R (Chang Citation2015). For this study, we consider Tweet messages as individual documents. A collapsed Gibbs sampler was used to fit LDA model and point estimates of the latent parameters were returned using the state of the last iteration (Chang Citation2015). The words in the corpus were assigned into groups (or topics) by the model and the probabilities of each word of being assigned to each group were recorded. Some of the topics do not have meanings which are of relevance to marketers, for instance, topics mainly consisting of profanity words. These topics were removed from the subsequent analysis so that the remaining Tweets were informative of key interests and activities, and are therefore representative of the function of the urban areas surrounding the stations. To assist the interpretation of the subsequent results, the topics were manually interpreted and labelled. The labels were chosen to match the categories of services and goods in advertising as described in Google’s personalized advertising scheme (https://support.google.com/ads/answer/2842480?hl=en-GB). To ensure that each Tweet had an equal weighting, the total probabilities different topics accumulated from all the words within a single Tweet were converted into the relative proportion of topics from each message as a whole.
The generalized topics of each place could be generated by aggregating the topic probabilities from all of the Tweets by each area and time period. Data from users with multiple Tweets within the same place-temporal sample were reduced in order to avoid issues of sample biases. The users who transmitted several tweets at a particular place and time period will be have an overrepresented influence on the analysis. To normalize the contribution of each Twitter user, the topic probabilities distribution of all the Tweets belonging to a single user within a space–time sample unit were averaged and considered as a single entry.
Audience size estimation
Whilst footfall within stations varies considerably across the Underground network, the interests on Twitter are not uniformly distributed between users as demonstrated by this research. Therefore, to efficiently plan an effective targeted advertising strategy within Underground stations, it is important to identify the locations (and times) where the size of the target audience is greatest. We compared station footfall to the ratio of each key social media topic across the London Underground Network. Under the assumption that variations in topic popularity between Twitter users are broadly reflective of the variations of such interests amongst non-users at each setting, we estimated the total target audience size by multiplying the topic ratios by footfall counts. In this case, the target audience are defined as individuals whose Tweets fall under the relevant interests. If the value of advertising spaces is driven by the expected footfall of each station, it is important to understand the ratio of the target audience, in order to reach more potential customers whilst reduce costs of hiring the advertising spaces.
In addition, we have to consider that Twitter data are by no means representative of the whole population (Longley, Adnan, and Lansley Citation2015). Therefore, we cannot assume that an influx in Tweets at a particular place matches a proportional increase in footfall. Twitter users have been found to be overrepresented by the younger adult population, particularly of White British ethnicity (Longley, Adnan, and Lansley Citation2015). Moreover, users may be more likely to Tweet at certain times of the day or during particular activities. In this case, we were able to acquire footfall counts to enable us to estimate variances in representation across our sample area. The footfall data were provided in the form of passenger counts from Transport for London (TfL) which are recorded when individuals pass through the gates at stations. Of course, these counts will not quite correspond with footfall outside the station, but they give a very good indication of how busy the immediate vicinity to the station is.
Targeted advertising
Finally, following the previous steps it was possible to analyse the data to infer spatio-temporal patterns in popular interests across the average weekday and weekend day. The frequencies of each of the topics were standardized to observe their relative popularity, given that the total size of each topic varies.
There are multiple approaches to generate useful information from the data for advertising. Firstly, it could be useful to consider each place and time individually. From observing the popularity of topics at a particular place over time, it is possible to estimate what types of adverts may be most appropriate. Alternatively, it is also possible to consider the entire network, and instead, identify the locations which contain the most receptive audiences for particular topics. This enables planners to distribute their advertisements more efficiently across a number of different sites at different times. These analyses are explained in more detail in the case study.
Case study: London Underground stations
Background
The London Underground system is dedicated to serve London’s population of 8.5 million persons, in addition to those who visit the city for work or leisure purposes. There was a total of 269 Underground stations in London in 2013 and these serve a large proportion of the city’s neighbourhoods with a particular concentration in the centre of the city.
London Underground stations were chosen as our case study for several reasons. Firstly, the very large number of persons who travel through them daily. More than 4 million passenger journeys are handled by London Underground system every day (https://tfl.gov.uk/corporate/about-tfl); consequently, advertising spaces in the stations are very profitable. Secondly, the areas around stations are typically very vibrant. Even suburban stations are typically situated within local clusters of activity due to the footfall generated by the stations and also the density of services which are often proximal too. It is reasonable to expect that at an aggregate level, the characteristics of station users can be identified and interpreted, and such characteristics may vary across time and space (Lai, Cheng, and Lansley Citation2015). Thirdly, advertising is provided through digital screens in many of the more popular stations, so practitioners already have the capacity to distribute their adverts across time and space.
Assign tweets to catchments
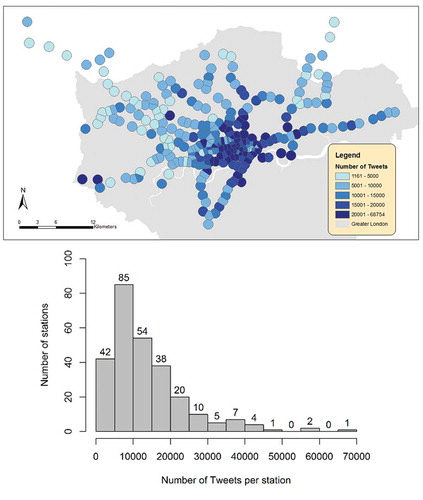
The catchment areas for each station are presented in . Many stations’ 800-m buffers had to be clipped to prevent overlap. However, as the density of Underground stations has an association with the daytime population density, the smaller catchment areas are mostly in the central areas which still contained a good size sample of Tweets. An 800-m buffer ensured that each station in London is assigned at least 1000 Tweets from our data. Each station was assigned 13,544 Tweets on average. However, the number of Tweets per station varied considerably as central station areas in busier parts of the city attracted very large numbers of Tweets, as presented in the map in . A histogram of the counts of stations with different sizes of Tweet number is also shown. The least popular catchment contained 1161 Tweets (Moor Park station) and the most popular one had 68,754 Tweets (Old Street station). After all the preprocessing steps, 3,451,377 Tweets from 296,019 users remained.
Figure 3. Map of the station’s catchment areas with different Tweet counts located within the area (Top). Histogram of stations based on the Tweet counts (Bottom).
Passenger counts
In addition to considering the popularity of topics, we have also attempted to extrapolate the findings with footfall data to account for variances in the number of Tweeters. We obtained a sample of London Underground stations passenger counts data from 11 to 24 October 2015, which has been made publically available by TfL (http://tap.data.tfl.gov.uk). These data were aggregated to the same 6-h time-period groups used in the social media analysis but excluded the time periods of 00:00–06:00 on both weekdays and weekends when stations were closed. There is a strong linear association between the number of underground users and Twitter users for each station, as the two data share a Pearson’s correlation coefficient of 0.817. Therefore, the representation of underground users is relatively evenly distributed across the sample.
Extract topics
For this case study, we have explored a range of parameters and chose the results where α = 0.1, β = 0.1 and K = 20. The values of α and β could achieve topics that address specific interests from a fine-grained decomposition of the corpus (Griffiths and Steyvers Citation2004). To assist the selection of appropriate number of topics (k), we can test the LDA on a random sample (e.g. 500,000 Tweets, roughly 14.5% of the case study data) for several different k (5–50) and observe the perplexity scores for each model (). It is observable that after reaching 20 topics, the rate of reduction in perplexity begins to reduce. Following this, we also observed the content of the topics to ensure that they were coherent. Therefore, 20 topics were chosen to appropriately segment the key themes discussed around Underground stations across London on Twitter.
Figure 4. Perplexity results of the LDA models on the test Twitter set with different settings of the number of topics.
Of the 20 topics, 12 were deemed meaningful of activities and common interests based on their keywords. The proportions of these topics were rescaled, and consequently the topic distribution in each Tweet summed up to 1. presents the top 10 most frequent words from the selected 12 topics. Words from left to right are sorted by the probability of it being assigned to this topic. To assist the interpretation of the subsequent results, labels were subjectively devised for each of the topics.
Figure 5. The selected 12 topics and their inferred labels.
Results and discussions
Our results are split into three sections. Firstly, as an overview of the Twitter users’ interests, we consider the temporal and spatial patterns in topic popularity to generalize trends across our sample. Secondly, we consider temporal trends in topic popularity at two different stations to demonstrate how temporal profiles are not uniform across our sample. Finally, we consider spatio-temporal trends across the entire sample in order to identify the optimum locations for particular topics.
General S-T patterns
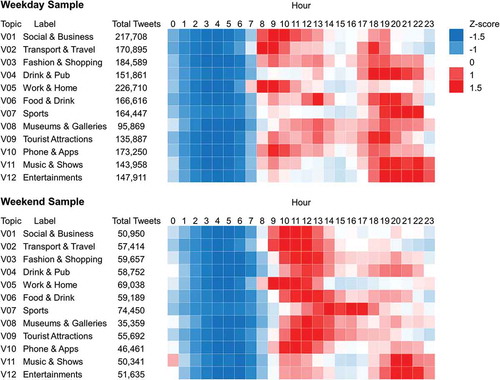
By aggregating all of the Tweets into their most representative topic, it is possible to observe temporal patterns across the average day for weekdays and weekends (). The distributions of each of the topics have been standardized to allow us to observe their relative popularity, given that the sample sizes of each topic vary. It is immediately observable that behaviour on Twitter is noticeably different on weekends compared to weekdays. On weekend days, more activity is concentrated around midday, whilst most topics tend to peak in the evenings of weekdays. The temporal fluctuations of Tweets across each of the topics seem logical. For example, the ‘Transport & Travel’ topic is most abundant during the evening and morning rush hours of weekdays. Whilst ‘Sports’ are more popular on weekday evenings and weekend afternoons, the times when most televised football games are played.
Figure 6. The standardized frequencies of Tweets for each topic by hour of the day from our weekend and weekday samples.
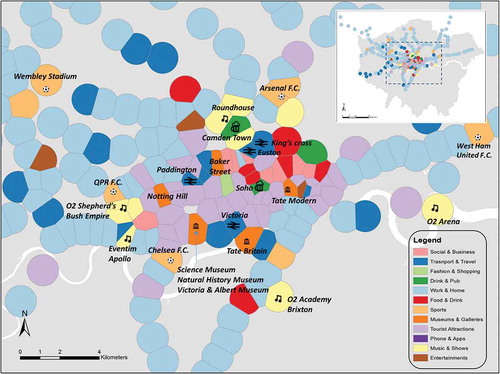
We also considered the most abundant topic around each of the stations to demonstrate key spatial trends. displays the dominant topics of each of the stations across the whole time period. Most stations located in suburban areas are most represented by the ‘Work & Home’ topic, whilst the most popular topics across central London are very diverse. The dominant topics around the stations are often affiliated with place and local activities. also maps some key points of interest to demonstrate this. For example, it is observable that Underground stations that serve major rail stations have the highest counts of ‘Transport & Travel’ Tweets. The dominant topics of the stations which are close to large museums and art galleries are ‘Museums & Galleries’. Similarly, users most commonly talk about ‘Music & Show’ at stations where iconic music venues are located nearby. also reveals that posts about ‘Sports’ are most overrepresented around stations that are proximal to football stadiums. Several areas in central London were assigned to the ‘Tourist Attractions’ topic. Many of the well-known landmarks of London (such as Tower Bridge, Big Ben, London Eye, Hyde Park and St. Pauls’ Cathedral) were discussed in these Tweets.
Figure 7. Dominant topics on Tweets around the stations over the whole time period.
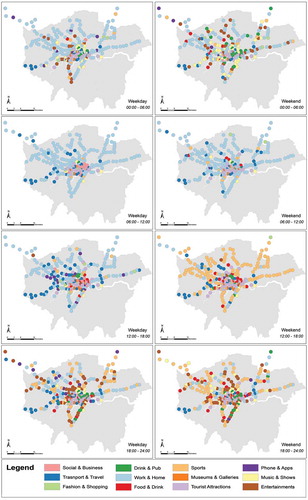
It is also probable that the distribution of dominant topics may change throughout the week due to the routines of the population. shows eight maps of the dominant topics per station area for each of the time periods. It is observable that the dominant topics vary greatly through time and space. As most stations have different dominant topics across different time periods, it can be inferred that the aggregated interests of Twitter users within the vicinity of stations vary between different times of the day. It can also be observed that there is a distinctive temporal pattern of the topics across the whole city. The topic ‘Work & Home’ dominates the suburban areas in the mornings. ‘Sports’ are much more popular on weekend afternoons presumably because of the occurrence of league football matches. Topics on entertainment such as ‘Entertainments’ and ‘Music and Show’ are more popular in evenings than in daytimes which coincides with the times of which popular shows and performances are run. However, some stations retained the same dominant topic throughout the day, presumably due to strong ties to a particular activity. Such as many stations in central London whose dominant topic is ‘Tourist Attractions’, and the far western stations near Heathrow airport which are assigned to the ‘Transport & Travel’ group.
Figure 8. Dominant topics on Tweets around each station in different time periods.
Allocating advert topics for particular station
When we look into the complete topic distributions of each station, which includes the proportions of all 12 topics across the eight time periods, a more specific characteristic can be revealed. The results from two of the stations have been presented to demonstrate the variance in the data (). Covent Garden is a relatively stable station area, in that it exerts similar proportions of topics from local Tweets during all time periods. This area is famous for restaurants and bars which are particularly popular amongst tourists. However, Arsenal station has high proportions of Tweets about ‘Sports’ during weekday evenings and weekend afternoons. This is probably influenced by the Emirate Football Stadium, which is located within the catchment for this station. It can be seen in this case that whilst it might be logical to target adverts which would be appropriate for sports fans during these times, they will not be as effective during the rest of the week when the stadium is not hosting sporting events.
Figure 9. Topic distributions of two sample Underground stations. (Top) Arsenal station. (Bottom) Covent Garden station.
Allocating advert topics across time and space
The total target audience size for different topics have been calculated by multiplying the topic proportions by footfall counts of each station area. As expected, the busier stations have larger target audiences for most topics purely because of the larger number of passengers passing through them. However, there are notable variances in the popularity of topics. In , we have compared these values for two topics – ‘Sports’ and ‘Music and Shows’. Advertisers may be interested in stations which have a high potential audience but also have a high proportion of Tweeters within a particular topic so that their advertisement is targeted efficiently. It can be observed that the Sports stations that meet this criterion are Wembley Park, Fulham Broadway and Holloway Road, all three are near to large football stadiums. Brixton and North Greenwich are the best-situated stations for adverts aimed at music lovers. Both of these stations are near to large music venues such as the Brixton Academy and the O2 Arena in Greenwich.
Figure 10. Identifying stations for advertising in different topics. (a) Sports. (b) Music and Shows.
It is also worth considering how the suitability of advertisements at different stations may change between time periods. compares the same results for the Music topic for weekday nights and weekend nights separately. A notable difference is that Wembley Park has both a larger target audience and a higher proportion of Tweets about music on weekend evenings as it does during the week. This is most likely due to the fact that music events at Wembley Stadium usually occur on weekend evenings.
Figure 11. Identifying stations for advertising in topic ‘Music’ at different time periods. (a) Monday–Thursday 18:00–24:00. (b) Friday–Sunday 18:00–24:00.
Conclusions
Overall, this study has demonstrated that it is possible to harvest useful information on the popularity of general topics spoken about on social media across space and time from geotagged Twitter data. Focusing on London as a case study, we generated 12 unique topics which summarize interests that could be useful to marketers. The data confirmed that the common themes discussed on social media vary in popularity throughout the day. However, trends are not uniform across space, and this may be because of the influence of local activities to a certain extent. This information could, therefore, be very useful for understanding areas where local activities are not well understood or where no single activity is dominant. Geotagged Tweets could, therefore, be a useful tool for estimating variations in public interests across space and time.
Although we have presented a successful means to quantify and compare the posts of social media users that have been in the vicinity of given areas, there are still some limitations which are worth considering. Twitter users are not representative of the wider population. In addition, the sample of Tweets that are geotagged may not be a representative of the wider Twitter user group. Although we considered alternative footfall data to extrapolate audience sizes, the interests of non-Twitter users remain an unknown. Therefore, it is recommended that future research on Tweets attempt to extrapolate the sample biases through data linkage techniques (for instance, those described in Longley, Adnan, and Lansley (Citation2015)) in order to account for those who may be under-represented. We also assume that Tweets and their content are reflective of the interests and activities of those who pass the advertisement spaces, in this case, those within the vicinity of Underground station entrances. Our aim was to create a method to generalize the topics of interests for persons within the immediate neighbourhoods of the stations. Those entering and exiting a station would have passed through the same area and would, therefore, be exposed to the same activities and environment. A final limitation worth considering is that we only consider historical data due to data availability and size requirements. There is scope for future research to improve insight where better data are available. Real-time data and modelling techniques will also empower planners to adapt to fluctuations which do not follow daily trends. In addition, larger data sets will enable analysts to devise a more comprehensive topic model. However, as a concept, this work has demonstrated that it is indeed feasible to extract useful information on audiences across space and time from geotagged Twitter data.
Disclosure statement
No potential conflict of interest was reported by the authors.
Additional information
Funding
References
- Aggarwal, C. C., and C. X. Zhai, eds. 2012. Mining Text Data. Boston, MA: Springer US. doi:10.1007/978-1-4614-3223-4.
- Aurenhammer, F. 1991. “Voronoi Diagrams—A Survey of a Fundamental Geometric Data Structure.” ACM Computing Surveys 23 (3): 345–405. doi:10.1145/116873.116880.
- Blei, D., L. Carin, and D. Dunson. 2010. “Probabilistic Topic Models.” IEEE Signal Processing Magazine 27 (6): 55–65. doi:10.1109/MSP.2010.938079.
- Blei, D. M., Y. Andrew, and M. Jordan. 2003. “Latent Dirichlet Allocation.” Journal of Machine Learning Research 3: 993–1020. https://stat.duke.edu/~scs/Courses/Stat376/Papers/Variational/BleiJordan2003.pdf.
- Caragea, C., N. Mcneese, A. Jaiswal, G. Traylor, H.-W. Kim, P. Mitra, W. Dinghao, et al. 2011. “Classifying Text Messages for the Haiti Earthquake.” Proceedings of the 8th International ISCRAM Conference, May: 1–10.
- Chae, J., D. Thom, H. Bosch, Y. Jang, M. Ross, D. S. Ebert, and T. Ertl. 2012. “Spatiotemporal Social Media Analytics for Abnormal Event Detection and Examination Using Seasonal-Trend Decomposition.” In IEEE Conference on Visual Analytics Science and Technology 2012, VAST 2012 - Proceedings, 143–152. doi:10.1109/VAST.2012.6400557.
- Chan, K., and M. Fung. 2013. “Effectiveness of Subway Advertising in Hong Kong.” Journalism and Mass Communication 3 (12): 486–501. http://davidpublishing.com/show.html?15443.
- Chang, J. 2015. “Package ‘Lda’”. https://cran.r-project.org/web/packages/lda
- Chang, J., S. Gerrish, C. Wang, and D. M. Blei. 2009. “Reading Tea Leaves: How Humans Interpret Topic Models.” Advances in Neural Information Processing Systems 22: 288–296.
- Cheng, T., and T. Wicks. 2014. “Event Detection Using Twitter: A Spatio-Temporal Approach.” PLoS ONE 9 (6): 1–10. doi:10.1371/journal.pone.0097807.
- Chew, C., and G. Eysenbach. 2010. “Pandemics in the Age of Twitter: Content Analysis of Tweets during the 2009 H1N1 Outbreak.” PLoS ONE 5 (11): 361–367. doi:10.1371/journal.pone.0014118.
- Cronin, A. M. 2008. “Mobility and Market Research: Outdoor Advertising and the Commercial Ontology of the City.” Mobilities 3 (1): 95–115. doi:10.1080/17450100701797349.
- David, L. J., V. Yadav, and N. Donthu. 2006. “Outdoor Advertising for Business Markets.” Industrial Marketing Management. doi:10.1016/j.indmarman.2005.02.006.
- Exterion Media. 2017. “London Underground Advertising”. Accessed 24 August 2017. http://www.exterionmedia.com/uk/our-products/tfl-rail-estate/london-underground-advertising
- Ghosh, D. D., and R. Guha. 2013. “What Are We ‘Tweeting’ about Obesity? Mapping Tweets with Topic Modeling and Geographic Information System.” Cartography and Geographic Information Science 40 (2): 90–102. doi:10.1080/15230406.2013.776210.
- Glover, D. R., S. W. Hartley, and C. H. Patti. 1989. “How Advertising Message Strategies Are Set.” Industrial Marketing Management 18 (1): 19–26. doi:10.1016/0019-8501(89)90017-5.
- Griffiths, T. L., and M. Steyvers. 2004. “Finding Scientific Topics.” Proceedings of the National Academy of Sciences of the United States of America 101 (Suppl): 5228–5235. doi:10.1073/pnas.0307752101.
- Hasan, S., X. Zhan, and S. V. Ukkusuri. 2013. “Understanding Urban Human Activity and Mobility Patterns Using Large-Scale Location-Based Data from Online Social Media.” In Proceedings of the 2Nd ACM SIGKDD International Workshop on Urban Computing, 6:1–6:8. doi:10.1145/2505821.2505823.
- Java, A., X. Song, T. Finin, and B. Tseng. 2007. “Why We Twitter: Understanding Microblogging.” In Proceedings of the 9th WebKDD and 1st SNA-KDD 2007 Workshop on Web Mining and Social Network Analysis, 56–65. doi:10.1145/1348549.1348556.
- JCDecaux Transport. 2011. “MTR Advertising Media Kit 2011”. Accessed 24 August 2017. http://www.jcdecaux.com.hk/documents/mtr/MTR_Media_Kit_2011_0513_Local_lowres_trimmed.pdf
- Kazienko, P., and M. Adamski. 2007. “AdROSA—Adaptive Personalization of Web Advertising.” Information Sciences 177 (11): 2269–2295. doi:10.1016/j.ins.2007.01.002.
- Kling, F., and A. Pozdnoukhov. 2012. “When a City Tells a Story: Urban Topic Analysis.” In Proceedings of the 20th International Conference on Advances in Geographic Information Systems - SIGSPATIAL ’12, 482–485. doi:10.1145/2424321.2424395.
- Lai, J., T. Cheng, and G. Lansley. 2015. “Spatio-Temporal Patterns of Passengers’ Interests at London Tube Stations.” In Proceedings of GISRUK 2015. https://pdfs.semanticscholar.org/f5cb/fc592e7f54814c18f9de42a19018814b1e22.pdf.
- Lasinger, P., and C. Bauer. 2013. “Situationalization: The New Road to Adaptive Digital-out-of-Home Advertising.” In Proceedings of IADIS International Conference E-Society, 162–169. https://www.researchgate.net/profile/Christine_Bauer/publication/303043942_Situationalization_the_New_Road_to_Adaptive_Digital-out-of-Home_Advertising/links/57b20d3808ae15c76cbb38f7.pdf.
- Lewis, D. D., T. G. R. Yiming Yang, and L. Fan. 2004. “RCV1: A New Benchmark Collection for Text Categorization Research.” Journal of Machine Learning Research 5 (Apr): 361–397.
- Longley, P. A., M. Adnan, and G. Lansley. 2015. “The Geotemporal Demographics of Twitter Usage.” Environment and Planning A 47 (2): 465–484. doi:10.1068/a130122p.
- Morstatter, F., J. Pfeffer, and H. Liu. 2014. “When Is It Biased?” Proceedings of the 23rd International Conference on World Wide Web - WWW ’14 Companion, April. New York, New York, USA: ACM Press, 555–556. doi:10.1145/2567948.2576952.
- Pieters, R., L. Warlop, and M. Wedel. 2002. “Breaking through the Clutter: Benefits of Advertisement Originality.” Management Science. https://feb.kuleuven.be/public/ndbaa53/pieters-wedel-warlop-MSc-2002.pdf. 10.1287/mnsc.48.6.765.192
- Pozdnoukhov, A., and C. Kaiser. 2011. “Space-Time Dynamics of Topics in Streaming Text.” In Proceedings of the 3rd ACM SIGSPATIAL International Workshop on Location-Based Social Networks - LBSN ’11, 1. doi:10.1145/2063212.2063223.
- Shimp, T. A., and J. C. Andrews. 2012. Advertising Promotion and Other Aspects of Integrated Marketing Communications. Boston, MA: Cengage Learning.
- Tam, K. Y., and S. Y. Ho. 2006. “Understanding the Impact of Web Personalization on User Information Processing and Decision Outcomes.” MIS Quarterly 30 (4): 865–890. Management Information Systems Research Center, University of Minnesota. doi:10.2307/25148757.
- Yan, J., N. Liu, G. Wang, and W. Zhang. 2009. “How Much Can Behavioral Targeting Help Online Advertising?” In Proceedings of the 18th International Conference on World Wide Web, 261–270. doi:10.1145/1526709.1526745.
- Zhao, W. X., J. Jiang, J. Weng, H. Jing, E.-P. Lim, H. Yan, and L. Xiaoming 2011. “Comparing Twitter and Traditional Media Using Topic Models.” In Proceedings of the 33rd European Conference on Advances in Information Retrieval, 338–349. http://dl.acm.org/citation.cfm?id=1996889.1996934.