
ABSTRACT
Wildfires are a major natural hazard with tremendous implications for the Earth’s ecosystems. Investigating fire regimes and fire–vegetation dynamics using remote-sensing techniques is becoming increasingly common because of their large-scale coverage and data availability. However, there is still scarce study to compare vegetation regeneration between different ecosystems after wildfires due to lack of data. This study used time series of Landsat images to explore and compare post-fire vegetation recovery in a Mediterranean (Witch Creek Fire) and tundra (Anaktuvuk River Fire) ecosystem. After 8 years of disturbance, the vegetation in the Mediterranean ecosystem had still not yet recovered, whereas the tundra ecosystem recovered in just 3 years. Higher degree burning leads to quicker vegetation recovery rate. However, ecological retrogression was also detected. Spatial heterogeneity in post-fire vegetation recovery observed in both sites can be attributed to topographic factors, soil water availability and the thermokarst process.
1. Introduction
Wildfires have devastating effects on the environment, ecology and economy (Bowman et al. Citation2011). A loss of vegetation reduces biodiversity (Davies Citation2011), promotes the invasion of exotic species (Brooks et al. Citation2004), enhances soil erosion and even increases the potential for flooding and debris flows (Pierson et al. Citation2011). A reduction in terrestrial vegetation and increase in CO2 emissions may further enhance global warming. According to Mack et al. (Citation2011), in 2007, the Anaktuvuk River Fire (ARF) alone released 2.1 Tg of carbon into the atmosphere. Wildfires are one of the primary determining factors in the global biome. Bond, Woodward and Midgley (Citation2005) simulated global ecosystems and found that many climate regions favouring a forest ecosystem are dominated by shrubs and grass, which they attributed to a long history of wildfires.
Accordingly, the study of wildfires is important to enhance our knowledge of the frequency of their occurrence, burn severity and post-fire recovery, as well as their ecological implications. Owing to the large scale of wildfires, it is difficult to conduct field studies on their effects or on post-fire vegetation recovery (Lhermitte et al. Citation2011). Wide-coverage periodic satellite images provide useful information for wildfire study. However, to examine long-term vegetation regeneration, periodic field data are often lacking, and studies are generally based on remotely sensed data alone (Hope, Tague, and Clark Citation2007; Lhermitte et al. Citation2011; Ireland and Petropoulos Citation2015).
Many researchers have used multi-temporal images to investigate the spatial and temporal recovery process (Gitas et al. Citation2012). Such habitats as savannah, chaparral and sage scrub are generally highly adapted to wildfires and may recover within several months to several years, whereas forest environments often require decades or even centuries to recover (Zyryanova et al. Citation2010). Researchers have focused on different aspects of vegetation regeneration. For example, Hope, Tague and Clark (Citation2007) used 11 Landsat Thematic Mapper (TM)/Enhanced Thematic Mapper Plus (ETM+) images spanning 19 years to study post-wildfire vegetation recovery in California. Their results showed vegetation to have fully recovered to its pre-fire state within 10 years of fire outbreaks. Rather than the general recovery rate, Gouveia, DaCamara and Trigo (Citation2010) focused on the regeneration progress of two vegetation groups, i.e. Pinus pinaster and Eucalyptus. Petropoulos, Griffiths and Kalivas (Citation2014) compared the recovery progress of different slope aspects and found north-facing slopes to enjoy a faster vegetation recovery rate.
In investigating post-wildfire vegetation regeneration, different climate regions offer different scenarios. Many studies focus on shrubland, scrubland and grassland environments, such as savannah, chaparral and sage scrub in subtropical and temperate climate zones, because these environments suffer greater wildfire frequency than forest environments. At the same time, ecological succession is also faster, and vegetation regeneration more easily identified via remotely sensed data. Furthermore, many scholars take a special interest in the Mediterranean ecosystem (Viedma et al. Citation1997; Wittenberg et al. Citation2007; Vila and Barbosa Citation2010), which features a hot dry summer and cool wet winter. Distinct seasonal variation can be observed, and precipitation is concentrated in the winter. During the summer, high temperatures and low levels of precipitation lead to drought and, in turn, frequent wildfires.
With respect to artic ecosystems, wildfires in boreal forests have been extensively examined (Epting and Verbyla Citation2005; Cuevas-Gonzalez et al. Citation2009). Chu and Guo (Citation2013) summarized dozens of studies on the post-fire environment of boreal forests using remote sensing. To date, however, little research has been carried out on the wildfires that occur in tundra environments (Barrett et al. Citation2012), most likely because (1) wildfires rarely occur in those environments and (2) the high degree of cloud contamination leads to poor-quality satellite images.
Moreover, only few studies have compared post-fire vegetation regeneration patterns in different ecosystems. Different vegetation biomes in different climatic zones exhibit different fire regimes. For example, a comparative study of Russian and Canadian boreal forests showed wildfires to occur in different seasons and with different magnitudes in the two countries (de Groot et al. Citation2013). Montenegro et al. (Citation2004) compared the fire regimes and post-fire vegetation recovery patterns of the Chilean matorral (southern hemisphere) and California chaparral (northern hemisphere), observing distinct patterns of vegetation succession between the two. Carrington and Keeley (Citation1999) compared post-fire seedling establishment in California (Mediterranean climate) and Florida (non-Mediterranean climate) and found the former to exhibit greater seedling density after fires. Comparative analysis of post-fire vegetation patterns among different ecosystems is important because it allows such traits as recovery patterns and vegetation regeneration trends to be highlighted and distinguishing patterns to be observed. However, applications of remote-sensing techniques to investigate differences in post-fire vegetation regeneration in different ecosystems are rare, if not non-existent.
In the study reported herein, we used the Witch Creek Fire (WCF) in California and aforementioned ARF in Alaska to explore the similarities and differences in post-fire vegetation regeneration in a Mediterranean and tundra ecosystem, respectively. Our assumption was that because both ecosystems are dominated by shrubs and grass, and the wildfires had ended at a similar time, they should have similar amounts of time to recover. Moreover, we posited that during the recovery stage, there would be both similarities and differences in the patterns and trends of the vegetation response in the two study areas, as they belong to different ecosystems. Due to cross-ecosystem differences in vegetation recovery patterns, flora that inhabits a specific environment should exhibit different degrees of adaptation after a fire. Comparing the vegetation responses in a Mediterranean and tundra ecosystem following a wildfire provides important information on and deepens our understanding of ecological succession and species adaptation.
The remainder of the paper is organized as follow. Section 2 describes the two study areas and our research methodology. Section 3 presents and discusses our findings, and Section 4 makes concluding remarks.
2. Materials and methods
2.1 Study areas
Two wildfires that occurred in 2007 were chosen as the study cases. The first, in the eastern area of the WCF in San Diego County, California (), started on 21 October 2007 and lasted until 6 November. In 2 weeks of burning, 197,990 ac was combusted (Source: NICC Citation2017). Precipitation in the study area is concentrated from November to March, with only limited precipitation between April and October. It is thus a typical Mediterranean climate. Records from the Henshaw Dam weather station, the nearest weather station to the perimeter of the WCF area (Source: NOAA Citation2017), show a mean annual temperature of 15°C and total precipitation of 387 mm in 2007. Between May and October, the weather was extremely dry, with the daily maximum temperature reaching 31°C and accumulated precipitation just 32 mm.
Figure 1. Landsat 5 image on 17 January 2008 shows the burn scar of Witch Creek Fire (33°9ʹN 116°49ʹW). Band combination – 3:2:1 – red:green:blue. Red line indicates the study area.
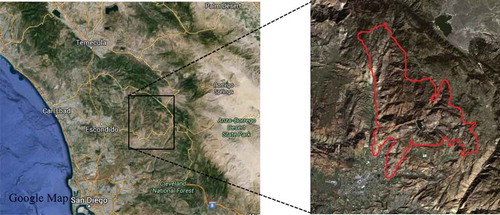
Within the WCF, perimeter is a largely mountainous landscape dominated by shrubs and grassland, with patchy evergreen and mixed forests. The vegetation type can be classified as montane chaparral, which is considered to be a fire-adapted ecosystem (Keeley and Davis Citation2007). Resprouters and obligate seeders are the two main types of vegetation that are highly adapted to this kind of environment (Gouveia, DaCamara, and Trigo Citation2010). Resprouters can develop lignotubers in their trunk base or underground parts and thus resprout quickly after a fire. Obligate seeders depend on fires to activate their germination, and their seeds then grow quickly after fires because of the large number of recycled nutrients and reduced competition. Woody genera such as Ceanothus (Rhamnaceae) and Arctostaphylos (Ericaceae) are the two major plant groups that flourish in a post-fire environment, and Adenostoma fasciculatum (Rosaceae) are also widespread in the chaparral of California. The seeds of these taxa boast fire-triggered germination, and thus, seedling recruitment occurs primarily in the post-fire environment. In addition, exotic grass species are also major competitors with native chaparral scrubs, as they can respond quickly after a fire.
The second study case is ARF, which occurred in the North Slope of Alaska. The fire started on 16 July 2007 and combusted 256,734 ac before it finally burned out in early October. It spread from south to north and was restricted by the Nanushuk River in the west and Itkillik River in the east. ARF is considered to be the largest tundra wildfire ever recorded (Source: Alaska Fire Service Citation2017). Owing to cloud contamination, only the northern part of the fire was taken as the study area, as shown in . Also, because the study site is remote and no climatic details are available, climatic data for Umiat Airport, which is 30 km away, were used as a reference (Source: NOAA). The weather station at the airport was abandoned in 2001, but data for 2000 show a mean annual temperature of −11°C and total precipitation of 196 mm.
Figure 2. Landsat 5 image on 14 June 2008 shows the burn scar of Anaktuvuk River Fire (69°21ʹN 150°50ʹW). Band combination – 3:2:1 – red:green:blue. Red line indicates the study area.
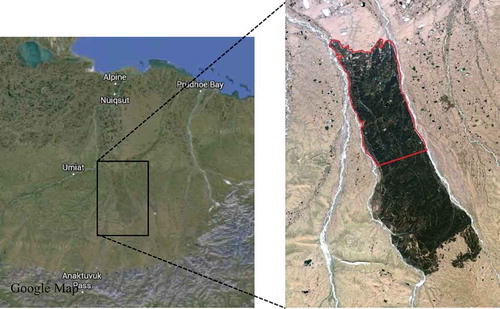
The ARF perimeter is located within a permafrost zone. The growing season is usually less than 60 days annually, during which there are up to 24 h of sunlight. The landscape is plain and dotted with lakes, fens and low-gradient streams. The harsh tundra environment is dominated by dwarf shrubs, sedges, grasses and lichens, as tree growth is hindered by the short growing season. The area’s vegetation grows close to the ground and forms a dense mat. Woody species such as Salix arctica (Salicaceae) and Arctostaphylos spp. (Ericaceae) are widely distributed and form large communities. In addition, such lichens as Cladonia spp. (Cladoniaceae) are important components of the tussock tundra (Jandt et al. Citation2008). Unlike the Mediterranean ecosystem, the tundra biome is not adapted to wildfire. Hence, vegetation mortality during wildfires is usually greater.
The fire histories of the two study areas were verified by Geospatial Multi-Agency Coordination (GeoMAC). The GeoMAC (Citation2017) website is operated by the USGS Geosciences and Environmental Change Science Center, which provides previous burn scar and near real-time fire perimeters for users. Neither study area suffered a fire recurrence after 2007. The western part of the WCF area overlapped with the Paradise Fire of 2003, but there is no record of a fire occurring before 2007 in the ARF area.
2.2. Data set description
Level-1 satellite images from the Landsat 5 TM and Landsat 8 Operational Land Imager in GeoTIFF format were downloaded from the Earth Explorer (http://earthexplorer.usgs.gov/). A time series of images from 2006 to 2015 was used to examine the vegetation dynamics before and after the wildfires. and show the satellite images used for this study. The images are terrain-corrected with a spatial resolution of 30 m. The Worldwide Reference System-2 (WRS2) of each scene is also indicated for ease of reference.
Table 1. Satellite images used for the WCF.
Table 2. Satellite images used for the ARF.
In addition to satellite images, the land-cover data set from the National Land Cover Database 2006 (NLCD 2006; Fry et al. Citation2011) was also used as a supplementary data set for the WCF. However, because no land-cover data for Alaska are available for 2006, we employed NLCD Alaska 2001 data for ARF. Because Alaska’s North Slope is remote and rarely affected by human activities, it was assumed that no significant changes to the land cover would have occurred between 2001 and the outbreak of the fire in 2007. The NLCD data set covers the whole of the United States (including Alaska) at a spatial resolution of 30 m. Land cover is classified into 20 types (level II). The NLCD 2001 data set for the continental United States has been shown to boast 79% accuracy for the level II classes (Wickham et al. Citation2013), although no accuracy assessment of the Alaskan data for that year has been made. For NLCD 2006, the accuracy of the level II classes is 78% (Wickham et al. Citation2013).
2.3. Calculation of burn severity and regeneration
The differenced normalized burn ratio (dNBR) was adopted to delineate the wildfire boundary because it is known to have the highest degree of accuracy in burn severity assessments (Veraverbeke et al. Citation2011; Keeley, Brennan, and Pfaff Citation2008). Burn severity is estimated by calculating the normalized burn ratio (NBR) of the pre- and post-fire images (Key and Benson Citation1999):
Because near-infrared is sensitive to vegetation greenness and short-wave infrared is sensitive to bare soil and charcoal (Jia et al. Citation2006), the index is useful for burn severity assessment. When the NBRs of the pre- and post-fire images are differenced, the dNBR of each pixel can be obtained, as follows:
NBR values fall theoretically within the range of −1 to +1. Larger values indicate green vegetation, and smaller values burned areas, bare soil, water or cloud. dNBR values fall theoretically between −2 and +2. Negative values indicate vegetation regrowth, values near 0 indicate no change (unburned areas), and values greater than 0.1 indicate burned areas (Key and Benson Citation2006). The continuous dNBR values were then changed to ordinal severity levels by using a decision tree classifier. The thresholds of burn severities can be found in as proposed by Key and Benson (Citation2006).
Table 3. Thresholds of burn severity levels as proposed by Key and Benson (Citation2006).
Based on the burn severity classification map generated by the decision tree classifier, the wildfire perimeter was selected as the Region of Interest, and unburned pixels, waterbodies, cultivated crops and developed areas were further masked out in accordance with the NLCD land-cover data. Within the wildfire perimeter, only those pixels classified as burned areas (dNBR values ≥ 0.1) were used for data analysis because, for many large-scale wildfires, unburned islands may exist within the perimeter, including pixels that might exert an averaging effect on the results.
Based on the results of burn severity assessment, the assessment for vegetation regeneration can be conducted. The normalized difference vegetation index (NDVI; Rouse et al. Citation1973) was used as an indicator for such regeneration and is calculated as follows:
The NDVI was further used to calculate the regeneration index (RI) in accordance with Diaz-Delgado et al. (Citation1998). In calculating the RI, only post-fire scenes (either one scene or a time series of scenes) are required. The region outside the wildfire perimeter was used as the control plot. The NDVI of the control plot was calculated and compared with that within the wildfire perimeter. The RI equation is as follows:
The RI design is based on the assumption that nearby vegetation is the same as the vegetation that would appear within the wildfire perimeter if no wildfire had occurred. The selection of the control plot should be based on three main principles: (1) it should be as close to the wildfire perimeter as possible to avoid climatic effects; (2) its topography should generally be the same as that within the wildfire perimeter and (3) the vegetation types it features should be the same as those within the perimeter (Lhermitte et al. Citation2010). Another practical method, and the one adopted in this study, is to choose the ROI repeatedly to identify the nearest mean NDVI to the burn scar (pre-fire). In the pre-fire stage, the RI should be as close to 1 as possible ().
Figure 3. Trends of vegetation regeneration in the cases of WCF and ARF.
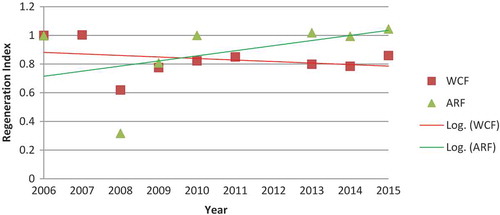
Figure 4. Burn severity classification of WCF.
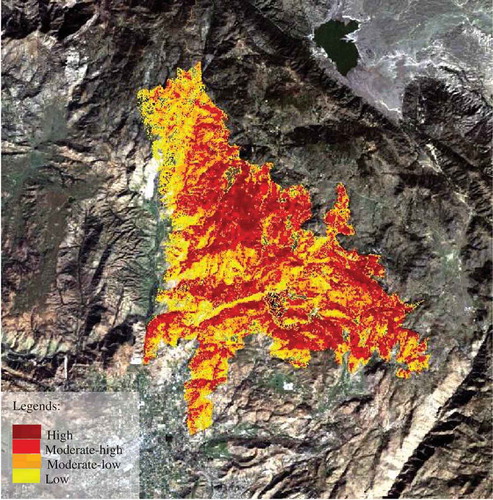
Figure 5. Burn severity classification of ARF. Black colour indicates the wildfire area which was beyond the scope of our study.
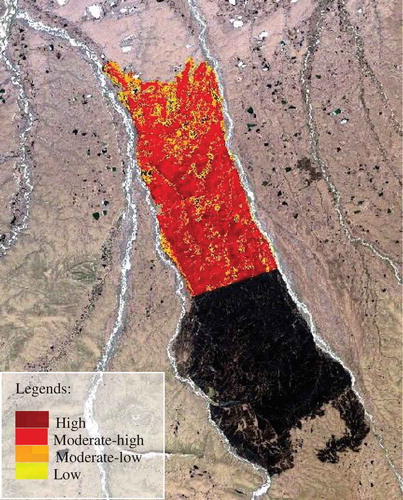
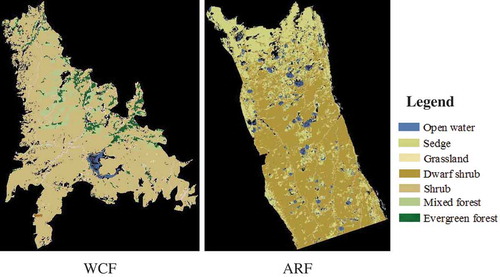
Figure 6. Land cover retrieved from NLCD.
In addition, FRAGSTATS (McGarigal and Marks Citation1995) was used for landscape analysis. FRAGSTATS is a program used for spatial pattern analysis for categorical maps. The number of patches (NP) was employed as a landscape metric to analyse the spatial heterogeneity of the landscapes after the wildfires. The calculations were based on NDVI changes, as shown in and .
Figure 7. Time series of NDVI of WCF from Landsat images through 2006–2015.
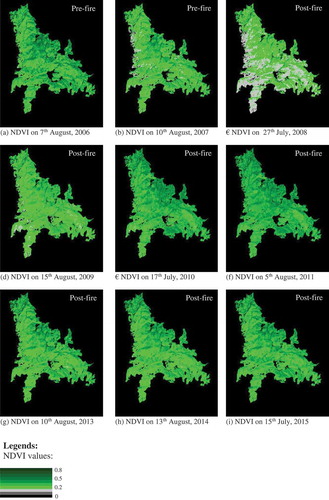
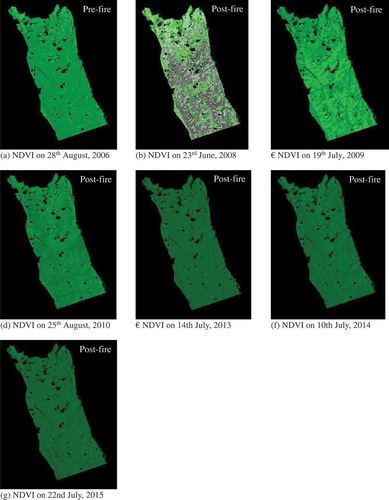
Figure 8. Time series of NDVI of ARF from Landsat images through 2006–2015. Legends refer to .
3. Results and discussion
3.1. Patterns of vegetation regeneration
and show the burn severity classifications within the WCF and ARF study areas, respectively. Due to the rugged landscape, the burn severity classification for the WCF displays a more heterogeneous pattern, with pixels classified as high burn severity juxtaposed with those classified as moderate–high, moderate–low and low burn severities. The spread of the WCF was hindered by the rivers in the southern and western interfaces of its perimeter. The pixels along the border of Lake Sutherland also fall within the wildfire perimeter, which may be attributable to the drying-out of the water along the waterside in the fall. According to the land-cover data in NLCD 2006, most of the vegetation within the burn scar is shrub/scrub (84%), with forest areas occupying just 14% (mixed and evergreen) and grassland just 2% (see and ).
Table 4. Land-cover information extracted from NLCD 2006 for WCF and NLCD 2001 for ARF.
The ARF burn severity classification exhibits a more homogeneous pattern due to its gentle landscape. Not only was the scale of ARF unprecedented in the past 5000 years (Hu et al. Citation2010), but the degree of combustion was also exceptionally severe, as most tundra fires have a low burn severity (Jones et al. Citation2009). Up to 77% of the pixels can be classified as moderate–high or high in severity, which is comparable to the results reported by Jones et al. (Citation2009). They found 82% of pixels to fall into the moderate-to-high and high-to-extreme severity, although their study area and classification threshold differed from ours. Within the wildfire perimeter, fens are juxtaposed as the unburned islands, but some of the fens are also under low burn severity due to their emergent herbaceous habitat. Within the burn scar, roughly two-thirds of the vegetation is made up of dwarf scrub and shrubland, and one-third of sedge and grassland (see and ).
illustrates the vegetation regeneration trends in the WCF and ARF areas, along with the logarithmic trend lines. The two wildfires present a similar pattern, i.e. their RI values dropped significantly in 2008 (the year immediately after the fires), and then rebounded rapidly in 2009 before increasing at a steadier pace from 2010. From the sixth to eighth years (2013–2015) after the fires, the vegetation regeneration in the two cases differed little. A minor drop in the RI occurred in 2014, followed by an obvious increase in 2015, which can probably be attributed to other megascale factors. According to the NCDC (Citation2016), the whole of California experienced a period of extreme to exceptional drought in 2014, whereas the Palmer Drought Index for Alaska was normal in that year.
Both study areas showed significant vegetation recovery in the years following the wildfires, although the RI of the WCF increased more gently than did that of ARF. However, in 2015, 8 years after the WCF, the area’s RI had still not returned to its original level, and it remained at a steady level after 2010. The implication is that the ecological structure did not resume after the wildfire, at least in terms of the aboveground biomass. The area’s vegetation composition offers one explanation, as forest areas require a longer time to regenerate. Ecological retrogression may occur when the vegetation cover decreases and the vegetation structure is simplified. From 2013 to 2015, the amount of vegetation in the WCF burn scar was 14–20% less than that in the control plot. The logarithmic trend line also indicates a general decrease in vegetation after the wildfire. This finding is comparable with the study carried out by Viedma et al. (Citation1997) on the Mediterranean coast of Spain. They showed that the NDVI reached 50% and 90% of the pre-fire state within 2 and 3–5 years of the wildfire, respectively. Wittenberg et al. (Citation2007), in contrast, found the vegetation cover to return to its pre-fire state within 3 years in the Mediterranean landscape they examined. Moreover, Hope, Tague and Clark (Citation2007) conducted a study in the California chaparral and reported that it took 10 years for the NDVI to return to its pre-fire level.
In comparison with the WCF, the ARF area showed a more dynamic change. After a significant post-fire drop in the RI, it increased rapidly in 2008 and 2009 and continued to climb in 2010 when it slightly surpassed the pre-fire condition. This early regrowth pattern can be attributed to the presence of sedge, which is particularly resilient to fire (Jones et al. Citation2009). Although we lack data for 2011 and 2012, the vegetation was observed to recover at a steady pace between 2013 and 2015. Hence, following ARF, the area’s vegetation recovered quickly, returning to its pre-fire state within 3 years in terms of the aboveground biomass. This finding is comparable to that of Jandt et al. (Citation2012), who found that 80% of the vascular plants in their study area recovered compared with the unburned transects in 2011. The logarithmic trend line for ARF in the current study also indicates a general increase in vegetation in the post-fire stage. However, the vegetation composition has changed dramatically in the years since the fire, with the percentage of graminoids increasing rapidly and the number of shrubs decreasing, in accordance with Jandt et al. (Citation2012). In addition, species composition may require two decades to recover as according to Vavrek et al. (Citation1999).
3.2. Spatial heterogeneity of post-fire vegetation recovery
The WCF broke out in a spatially heterogeneous landscape comprising mountain slopes, barren land, river valleys and lakes, as can be observed from both the NLCD 2006 land-cover data () and NDVI time series for 2006–2015 (). Mountain slopes, river valleys and lakes act as natural barriers to the spread of fire. The immediate post-fire image ()) shows that many light-green areas became grey (mainly in the southwestern part of the study area), which indicates the disappearance of vegetation. However, a remarkable rate of recovery can be seen when the 2009 and 2010 images (,)) are compared to the 2008 image ()).
The dark-green areas represent dense vegetation cover (mainly in the northeastern part of the study area), which is often distributed on north-facing slopes. In the immediate post-fire image from 2008, these areas become light green compared with the 2007 image ()). However, this is not a normal pattern. Because the bulk of those areas experienced a moderate–high or high burn severity (), the aboveground biomass should have been completely combusted. One possibility is that the vegetation comprised highly fire-adapted species that resprout quickly after a fire. Throughout the 10 years of time-series images, the vegetation does not return to its 2006 level in terms of NDVI, and the vegetation pattern is more homogeneous than it was before the fire, which is particularly evident in the 2010 and 2011 images. This indicates a general vegetation degradation after the fire.
Turning to the ARF case, the fire extended from the foot of the North Slope and moved towards the north. The landscape is gentle and occasionally undulating, with small depressions and ice wedges. Comparing the images for 2006 and 2008 shows a dramatic change following the fire (,)). The generally homogeneous burn pattern can also be compared with the burn severity classification in . It can be seen that irregular light-green areas are distributed throughout the burn perimeter. These are sedges around the lakes (in black), the vegetation least affected by the fire. The vegetation recovery pattern from 2008 to 2009 can be easily identified from the shift from light green to deeper green and from grey to light green. The areas surrounding waterbodies are greener than those farther away from water, indicating that water availability is a major factor for vegetation recovery immediately after a fire. This pattern is obscured in the images from 2010 and thereafter.
When the 2010–2015 images are examined carefully, it can be seen that the light-green areas are juxtaposed with darker green areas. The distribution appears to be random in nature and independent of the distribution of waterbodies. The same pattern can also be observed in the pre-fire image from 2006, albeit to a less obvious degree. According to Liu et al. (Citation2014), the ARF burn perimeter experienced subsidence after the fire because of permafrost melting. The increase in subsidence ranged from 2 to 8 cm compared with the pre-fire stage. Comparing the results of Liu et al. (Citation2014) with the light-green patterns found in this study, particularly in the 2014 image, a similar phenomenon can be observed. The light-green areas are very possibly areas that underwent a thermokarst process. Because burning can lead to permafrost thawing, the land surface will subside, particularly in the summer. Subsidence is associated with soil erosion and changes in hydrology, which affects the growth of vegetation.
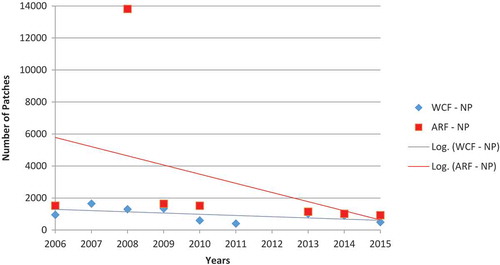
Concerning the changes in the NP, the two wildfires displayed a similar pattern. In the year immediately after the fires, both the ARF and WCF areas presented a higher NP, followed by a gradual decline in subsequent years (). The change was most dramatic for ARF in 2008, when the NP increased ninefold compared with 2006. The same pattern can also be seen in ). The NP in a landscape can be considered an index of spatial heterogeneity: the higher the NP, the greater the diversity or heterogeneity. As the calculation is based on NDVI analysis, an increase of NP immediately after the wildfires implies a barren environment while a decrease of NP implies that grasses dominate the post-fire environment, with large patches of grassland overwhelming the pre-fire shrubland.
Figure 9. Changes in number of patches after wildfires.
3.3. RI under different levels of burn severity
The vegetation RI under different levels of burn severity is illustrated in and for the WCF and ARF, respectively. Distinct patterns can be seen. Pixels classified with high burn severity in the WCF show a higher RI than the three other severity levels in 2008, the growing season immediately after the fire. The implication is that a rapid nutrient recycling mechanism was initiated. Due to reduced competition and increased nutrient availability, pioneer species colonized the severely burned environment quickly in the growing season immediately after the fire. This pattern can be observed in 2008 and 2009, whereas the recovery trends for all four levels of burn severity became gentler and remained steady over the next few years. Up to 2015, only the land surface that had experienced the highest degree of burn severity was able to obtain an RI value slightly higher than 1, i.e. a mean NDVI value higher than that in the control plot. For the three other severity levels, the RI had not reached 1 (presumably the original stage) 8 years after the fire. The relationship we identified between burn severity and vegetation regeneration is inconsistent with the finding by Keeley, Brennan and Pfaff (Citation2008) that post-fire recovery is associated with plant species rather than burn severity. However, Ireland and Petropoulos (Citation2015) reported a similar relationship to that in our study, namely a high degree of burn severity is associated with enhanced vegetation growth in the post-fire stage.
Figure 10. Regeneration index of vegetation under different burn severities in WCF. Note that there is a lack of data in 2012.
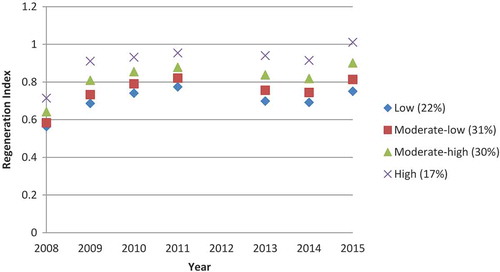
Figure 11. Regeneration index of vegetation under different burn severities in ARF. Note that there is a lack of data in 2011 and 2012.
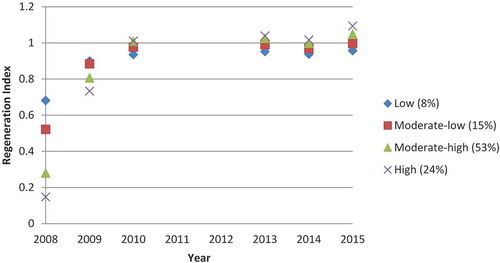
In the ARF area, the RI pattern in terms of burn severity was found to be opposite that in the WCF area in the year immediately after the fire. The land surface that experienced the highest degree of burn severity had the lowest RI value, which likely indicates complete combustion and no vegetation regeneration in the immediate post-fire growing season. The land surface that experienced a low degree of burn severity had a higher RI value in 2008, possibly because the vegetation was not completely consumed by the wildfire, allowing some to resprout in the next growing season. In the years between 2008 and 2010, the land surface that experienced a high degree of burn severity displayed a dramatic increase in RI, which has surpassed 1 since 2010. In short, the land surfaces subject to a low degree of burn severity experienced slower vegetation recovery than those subject to a high such degree.
4. Conclusion
The vegetation of different climatic zones may exhibit different fire regimes and post-fire recovery patterns. Although post-wildfire vegetation recovery in Mediterranean ecosystems is well studied, little is known about the vegetation–fire dynamics in tundra ecosystems. In the study reported herein, we used the WCF and ARF as representatives of Mediterranean and tundra ecosystems, respectively, to investigate post-wildfire vegetation regeneration. Both fires ended in the fall of 2007, allowing similar time periods for vegetation regrowth. The results show that the vegetation in the Mediterranean ecosystem under study had not recovered to its pre-fire state even 8 years after the fire. It is possible that the vegetation structure is simplified in environments subject to repeated burning, leading to ecological retrogression. Bond, Woodward and Midgley (Citation2005) and others have shown that many Mediterranean biomes are fire-dependent ecosystems and the result of a long history of wildfires. The tundra ecosystem under study, in contrast, proved highly resilient, with its aboveground biomass recovering within 3 years of the fire. The vegetation composition and ecological function may have changed in the post-fire stage (Jandt et al. Citation2008; Barrett et al. Citation2012), but those issues were beyond the scope of our study. It should be noted that the NDVI is used as a surrogate for post-fire vegetation regeneration in this paper. The index may mature within 10–20 years of a fire (Chu and Guo Citation2013), rendering later successional stages difficult to detect. However, it is still representative of early vegetation regeneration, i.e. within 8 years in this study.
Spatial heterogeneity was observed in vegetation recovery in both the WCF and ARF cases. That of the former can be attributed to the landscape pattern and that of the latter to the proximity of lakes and the thermokarst process. However, the NP decreased gradually over the years in both areas, which implies that a general degradation of vegetation occurs in post-fire landscape, leading to grassland dominance. We further found the land surfaces subject to a higher degree of burn severity to experience a quicker vegetation recovery rate, a pattern that was observed in both the Mediterranean and tundra ecosystems, albeit to a more obvious degree in the latter.
In addition to the comparative analysis of a Mediterranean and tundra ecosystem presented herein, further comparative studies of other ecosystems need to be conducted to enhance our understanding of wildfire regimes and vegetation responses. In particular, wildfire analyses comparing tropical, temperate and boreal forests or temperate grassland and tropical savannah are recommended.
Disclosure statement
No potential conflict of interest was reported by the authors.
References
- Alaska Fire Service. 2017. “Bureau of Land Management, U.S. Department of the Interior.” Accessed 10 August 2017. http://afs.ak.blm.gov/afs.php.
- Barrett, K., A. Rocha, M. J. Van De Weg, and G. Shaver. 2012. “Vegetation Shifts Observed in Arctic Tundra 17 Years after Fire.” Remote Sensing Letters 3 (8): 729–736. doi:10.1080/2150704X.2012.676741.
- Bond, W. J., F. I. Woodward, and G. F. Midgley. 2005. “The Global Distribution of Ecosystems in a World without Fire.” The New Phytologist 165: 525–538. doi:10.1111/j.1469-8137.2004.01252.x.
- Bowman, D. M., J. Balch, P. Artaxo, W. J. Bond, M. A. Cochrane, C. M. D’Antonio, R. DeFries, et al. 2011. “The Human Dimension of Fire Regimes on Earth.” Journal of Biogeography 38: 2223–2236. doi:10.1111/jbi.2011.38.issue-12.
- Brooks, M. L., C. M. D’Antonio, D. M. Richardson, J. B. Grace, J. E. Keeley, J. M. DiTomaso, R. J. Hobbs, M. Pellant, and D. Pyke. 2004. “Effects of Invasive Alien Plants on Fire Regimes.” BioScience 54: 677–688. doi:10.1641/0006-3568(2004)054[0677:EOIAPO]2.0.CO;2.
- Carrington, M. E., and J. E. Keeley. 1999. “Comparison of Post-Fire Seedling Establishment between Scrub Communities in Mediterranean and Non-Mediterranean Climate Ecosystems.” The Journal of Ecology 87: 1025–1036. doi:10.1046/j.1365-2745.1999.00419.x.
- Chu, T., and X. Guo. 2013. “Remote Sensing Techniques in Monitoring Post-Fire Effects and Patterns of Forest Recovery in Boreal Forest Regions: A Review.” Remote Sensing 6: 470–520. doi:10.3390/rs6010470.
- Cuevas-Gonzalez, M., F. Gerard, H. Balzter, and D. Riano. 2009. “Analysing Forest Recovery after Wildfire Disturbance in Boreal Siberia Using Remotely Sensed Vegetation Indices.” Global Change Biologic 15: 561–577. doi:10.1111/j.1365-2486.2008.01784.x.
- Davies, K. W. 2011. “Plant Community Diversity and Native Plant Abundance Decline with Increasing Abundance of an Exotic Annual Grass.” Oecologia 167: 481–491. doi:10.1007/s00442-011-1992-2.
- de Groot, W. J., A. S. Cantin, M. D. Flannigan, A. J. Soja, L. M. Gowman, and A. Newbery. 2013. “A Comparison of Canadian and Russian Boreal Forest Fire Regimes.” Forest Ecology Management 294: 23–34. doi:10.1016/j.foreco.2012.07.033.
- Diaz-Delgado, R., R. Salvador, and X. Pons. 1998. “Monitoring of Plant Community Regeneration after Fire by Remote Sensing.” In Fire Management and Landscape Ecology, edited by L. Traboud, 315–324. Fairfield, WA: International Association of Wildland Fire.
- Epting, J., and D. Verbyla. 2005. “Landscape-Level Interactions of Prefire Vegetation, Burn Severity, and Postfire Vegetation over a 16-Year Period in Interior Alaska.” Canada Journal Forest Researcher 35: 1367–1377. doi:10.1139/x05-060.
- Fry, J., G. Xian, S. Jin, J. Dewitz, C. Homer, L. Yang, C. Barnes, N. Herold, and J. Wickham. 2011. “Completion of the 2006 National Land Cover Database for the Conterminous United States.” Photogramm Engineering Remote Sensing 77 (9): 858–864.
- GeoMAC. 2017. Accessed 10 August 2017. http://www.geomac.gov/.
- Gitas, I., G. Mitri, S. Veraverbeke, and A. Polychronaki. 2012. “Advances in Remote Sensing of Post-Fire Vegetation Recovery Monitoring – A Review.” In Remote Sensing of Biomass – Principles and Applications, edited by L. Fatoyinbo. InTech.
- Gouveia, C., C. C. DaCamara, and R. M. Trigo. 2010. “Post-Fire Vegetation Recovery in Portugal Based on Spot/Vegetation Data.” Natural Hazardous Earth System 10: 673–684. doi:10.5194/nhess-10-673-2010.
- Hope, A., C. Tague, and R. Clark. 2007. “Characterizing Post-Fire Vegetation Recovery of California Chaparral Using TM/ETM+ Time-Series Data.” International Journal of Remote Sensing 28 (6): 1339–1354. doi:10.1080/01431160600908924.
- Hu, F. S., P. E. Higuera, J. E. Walsh, W. L. Chapman, P. A. Duffy, L. B. Brubaker, and M. L. Chipman. 2010. “Tundra Burning in Alaska: Linkages to Climatic Change and Sea Ice Retreat.” Journal of Geophysical Research Biogeoscience 115: G04002. doi:10.1029/2009JG001270.
- Ireland, G., and G. P. Petropoulos. 2015. “Exploring the Relationships between Post-Fire Vegetation Regeneration Dynamics, Topography and Burn Severity: A Case Study from the Montane Cordillera Ecozones of Western Canada.” Applications Geographic 56: 232–248. doi:10.1016/j.apgeog.2014.11.016.
- Jandt, R., K. Joly, C. R. Meyers, and C. Racine. 2008. “Slow Recovery of Lichen on Burned Caribou Winter Range in Alaska Tundra: Potential Influences of Climate Warming and Other Disturbance Factors.” Arctic Antarctica Alps Researcher 40 (1): 89–95. doi:10.1657/1523-0430(06-122)[JANDT]2.0.CO;2.
- Jandt, R. R., E. A. Miller, D. A. Yokel, M. S. Bret-Harte, C. A. Kolden, and M. C. Mack. 2012. “Findings of Anaktuvuk River Fire Recovery Study 2007 – 2011.” Accessed 10 August 2017. http://arcticlcc.org/projects/landscape/anaktuvuk-river-fire-monitoring/.
- Jia, G. J., I. C. Burke, A. F. H. Goetz, M. R. Kaufmann, and B. C. Kindel. 2006. “Assessing Spatial Patterns of Forest Fuel Using AVIRIS Data.” Remote Sensing Environment 102 (3–4): 318–327. doi:10.1016/j.rse.2006.02.025.
- Jones, B. M., C. A. Kolden, R. Jandt, J. T. Abatzoglou, F. Urban, and C. D. Arp. 2009. “Fire Behavior, Weather, and Burn Severity of the 2007 Anaktuvuk River Tundra Fire, North Slope, Alaska.” Arctic Antarctica Alps Researcher 41 (3): 309–316. doi:10.1657/1938-4246-41.3.309.
- Keeley, J. E., and F. W. Davis. 2007. “Chaparral.” In Terrestrial Vegetation of California, edited by M. G. Barbour, T. Keeler-Wolf, and A. A. Schoenherr, 339–366. Los Angeles: University of California Press.
- Keeley, J. E., T. Brennan, and A. H. Pfaff. 2008. “Fire Severity and Ecosystem Responses following Crown Fires in California Shrublands.” Ecology Applications 18 (6): 1530–1546. doi:10.1890/07-0836.1.
- Key, C. H., and N. C. Benson. 1999. The Normalized Burn Ratio, a Landsat TM Radiometric Index of Burn Severity Incorporating Multitemporal Differencing, 39.
- Key, C. H., and N. C. Benson. 2006. “Landscape Assessment (LA): Sampling and Analysis Methods. USDA Forest Service Gen. Tech. Rep. RMRS-GTR-164-CD.” Accessed 10 August 2017. https://www.frames.gov/rcs/0/598.html.
- Lhermitte, S., J. Verbesselt, W. W. Verstraeten, and P. Coppin. 2010. “A Pixel Based Regeneration Index Using Time Series Similarity and Spatial Context.” Photogrammetry Engineering Remote Sensing 76 (6): 673–682. doi:10.14358/PERS.76.6.673.
- Lhermitte, S., J. Verbesselt, W. W. Verstraeten, S. Veraverbeke, and P. Coppin. 2011. “Assessing Intra- Annual Vegetation Regrowth after Fire Using the Pixel Based Regeneration Index.” ISPRS Journal Photogramm 66: 17–27. doi:10.1016/j.isprsjprs.2010.08.004.
- Liu, L., E. E. Jafarov, K. M. Schaefer, B. M. Jones, H. A. Zebker, C. A. Williams, J. Rogan, and T. Zhang. 2014. “InSAR Detects Increase in Surface Subsidence Caused by an Arctic Tundra Fire.” Geophysical Researcher Letters 41 (11): 3906–3913. doi:10.1002/2014GL060533.
- Mack, M. C., M. S. Bret-Harte, T. N. Hollingsworth, R. R. Jandt, E. A. G. Schuur, G. R. Shaver, and D. L. Verbyla. 2011. “Carbon Loss from an Unprecedented Tundra Wildfire.” Nature 475: 489–492. doi:10.1038/nature10283.
- McGarigal, K., and B. Marks. 1995. “FRAGSTATS: Spatial Analysis Program for Quantifying Landscape Structure.” USDA Forest Service Gen. Tech. Rep. PNW-GTR-351.
- Montenegro, G., R. Ginocchio, A. Segura, J. E. Keely, and M. Gomez. 2004. “Fire Regimes and Vegetation Responses in Two Mediterranean-Climate Regions.” Revista Chileana de Historia Natural 77: 455–464.
- National Climatic Data Center (NCDC). 2016. Accessed 26 June 2016. https://www.ncdc.noaa.gov/monitoring-content/sotc/drought/2014/13/20141230_usdm.png.
- National Interagency Coordination Center (NICC). 2017. Accessed 10 August 2017. http://www.nifc.gov/nicc/index.htm.
- National Oceanic and Atmospheric Administration (NOAA). 2017. Accessed 10 August 2017. http://www.ncdc.noaa.gov/.
- Petropoulos, G. P., H. M. Griffiths, and D. P. Kalivas. 2014. “Quantifying Spatial and Temporal Vegetation Recovery Dynamics following a Wildfire Event in a Mediterranean Landscape Using EO Data and GIS.” Applications Geographic 50: 120–131. doi:10.1016/j.apgeog.2014.02.006.
- Pierson, F. B., C. J. Williams, S. P. Hardegree, M. A. Weltz, J. J. Stone, and P. E. Clark. 2011. “Fire, Plant Invasions, and Erosion Events on Western Rangelands.” Rangeland Ecology Management 64: 439–449. doi:10.2111/REM-D-09-00147.1.
- Rouse, J. W., R. H. Haas, J. A. Schell, and D. W. Deering. 1973. “Monitoring Vegetation Systems in the Great Plains with ERTS, Third Earth Resources Technology Satellite-1 Symposium.” NASA SP-351 I: 309–317.
- Vavrek, M. C., N. Fetcher, J. B. Mcgraw, G. R. Shaver, F. S. Chapin, and B. Bovard. 1999. “Recovery of Productivity and Species Diversity in Tussock Tundra following Disturbance.” Arctic Antarctica Alps Researcher 31 (3): 254–258. doi:10.2307/1552254.
- Veraverbeke, S., S. Lhermitte, W. Verstraeten, and R. Goossens. 2011. “Evaluation of Pre/Post-Fire Differenced Spectral Indices for Assessing Burn Severity in a Mediterranean Environment with Landsat Thematic Mapper.” International Journal of Remote Sensing 32 (12): 3521–3537. doi:10.1080/01431161003752430.
- Viedma, O., J. Meliá, D. Segarra, and J. Garcia-Haro. 1997. “Modeling Rates of Ecosystem Recovery after Fires by Using Landsat TM Data.” Remote Sensing Environment 61: 383–398. doi:10.1016/S0034-4257(97)00048-5.
- Vila, J. P. S., and P. Barbosa. 2010. “Post-Fire Vegetation Regrowth Detection in the Deiva Marina Region (Liguria-Italy) Using Landsat TM and ETM+ Data.” Ecology Model 221: 75–84. doi:10.1016/j.ecolmodel.2009.03.011.
- Wickham, J. D., S. V. Stehman, L. Gass, J. Dewitz, J. A. Fry, and T. G. Wade. 2013. “Accuracy Assessment of NLCD 2006 Land Cover and Impervious Surface.” Remote Sensing Environment 130: 294–304. doi:10.1016/j.rse.2012.12.001.
- Wittenberg, L., D. Malkinsona, O. Beeric, A. Halutzya, and N. Teslera. 2007. “Spatial and Temporal Patterns of Vegetation Recovery following Sequences of Forest Fires in a Mediterranean Landscape, Mt. Carmel Israel.“ Catena 71 (1): 76–83
- Zyryanova, O., A. Abaimov, T. Bugaenko, and N. Bugaenko. 2010. “Recovery of Forest Vegetation after Fire Disturbance.” In Permafrost Ecosystems: Siberian Larch Forests, edited by A. Osawa, O. Zyryanova, Y. Matsuura, R. Kajimoto, and R. W. Wein, 83–96. New York: Springer.