
ABSTRACT
With the advancement of physical sensors and scientific modelling, we fortunately are able to track, monitor and even predict most of natural destructive forces, e.g. hurricanes and tornadoes. Compared to other natural disasters, earthquakes are particularly traumatic because they occur without explicit and timely warning and therefore are extremely difficult, if at all possible, to detect timely. Meanwhile, anomalous animal behaviours have been widely observed the day even several days before an Earthquake. Therefore, animals can be used as intelligent geo-sensors to tell or estimate when and where an earthquake will potentially occur. This paper presents a framework synthesizing crowdsourcing reports of anomalous animal behaviour from both active sources (designed mobile app and websites) and passive sources (social networks like Twitter, Facebook) for earthquake early prediction. To demonstrate the effectiveness of the proposed framework, a proof-of-concept prototype is then developed to collect, visualize, analyse and mine such crowdsourcing data to detect a potential earthquake.
1. Introduction
Natural hazards are severe events that pose a threat to the sustainment and survival of our society. Natural hazards become disasters when they cause extensive damage, casualties and disruption. According to a report from United Nations (Escap Citation2015), over $1.15 trillion was lost during the past 45 years, and four types of disasters – earthquakes, tsunamis, floods and storms – were responsible for 91.8 percent of the total economic losses. Besides, over 3.5 million people had been killed by natural disasters during the past 45 years. Hereinto, earthquakes and tsunamis were the main cause of deaths, despite their relatively infrequent occurrences. Natural hazards have been increasing both in frequency and severity in the 21st century due to climate change, increasing population and the reliance on aging infrastructure. Recently, major catastrophic disasters have caused havoc around the world, such as the massive earthquakes in Nepal, the extreme heat wave in India, the tsunami in Japan, and the extremely cold winter in the northeast of US and Europe.
Disaster management is an alternative for improving resilience and thus to avoid or reduce the impact of natural disasters (Baharin, Shibghatullah, and Othman Citation2009). It can be defined as an ongoing process including a series of activities before, during and after a disaster, which could be divided into the following aspects: mitigation, preparedness, response and recovery (Poser and Dransch Citation2010). Apparently, disaster management plays a very important role during natural disasters. The preparedness, including monitoring and early warning, is one of the very first challenges we need to consider. However, inadequate attention has been paid to enhance the preparedness of natural hazards and how to effectively prepare and minimize the impact of a natural hazard, especially earthquake remains a challenge.
Compared to other natural disasters, earthquakes are particularly traumatic because they occur without explicit and timely warning based on our current knowledge, unlike other natural destructive forces, e.g. hurricanes and tornadoes, which mostly can be easily tracked, monitored and even predicted. But it is always one of the hottest and most significant research topics for human beings. During the past decades, to predict an earthquake, many approaches and attempts have been conducted, e.g. the empirical approaches, probabilistic seismic hazard assessment, dynamical systems approach (Aki Citation2013; Bakun et al. Citation2005; Dieterich and Kilgore Citation1996; Florido et al. Citation2015; Guangmeng and Jie Citation2013; Hayakawa and Hobara Citation2010; Jones and Molnar Citation1979; Kagan and Knopoff Citation1987; King Citation1986; Kirschvink Citation2000; Kunitsyn et al. Citation2014; Marzocchi and Zechar Citation2011; Mogi Citation2013; Moustra, Avraamides, and Christodoulou Citation2011; Uyeda, Nagao, and Kamogawa Citation2009; Varotsos, Alexopoulos, and Lazaridou Citation1993; Whitcomb, Garmany, and Anderson Citation1973; Yin et al. Citation1995). Hereinto, empirical approaches, replying on a variety of observations, ranging from patterns of seismicity, measurements of strain and electromagnetic fluctuations to reports of anomalous animal behaviours, have been emphasized by many scientists (Mogi Citation1985; Rikitake Citation1975; Rikitake Citation1988; Suzuki Citation1982) for accurate short-term prediction of earthquakes.
During the past decades, many reports of anomalous animal behaviours or other abnormal phenomena before earthquakes have been reported. Unfortunately, most of these reports were made after the occurrence of the earthquake, even though they may happen before the earthquakes. It is certainly possible that animals could respond to certain signals that are undetectable to human beings. It is notable that a successful earthquake prediction was made by the Chinese and resulted in the evacuation of the city of Haicheng in northeast China prior to the 4 February 1975 magnitude 7.3 earthquake using observations of abnormal animal behaviour (Tong Citation1988). 90% of the buildings in the city were destroyed, however, thanks to the successful prediction and timely evacuation, very few people were killed. It was reported by the Chinese government that the successful prediction was based on a number of precursory phenomena, including foreshocks, groundwater anomalies, and anomalous animal behaviours through crowdsourcing. Unfortunately, a similar prediction was not made for the Tangshan earthquake with a magnitude of 7.8 after 16 months, while a successful prediction was made in Qinglong County, which is just 115 km away from Tangshan at the same time. The death toll in this earthquake from official reports was 242,000, whereas unofficial reports placed it as high as 655,000. A number of precursory phenomena were reported, including anomalous tilt, gravity and water-level observations, and anomalous animal behaviours, but no official prediction was made mostly due to the cost of the evacuation, concerns of public panic and doubts on the reliability of the prediction. The successful prediction cases here could shed light on the strength of crowdsourcing for earthquake prediction as well as the limitations involved, the cost of the survey, reliability, etc.
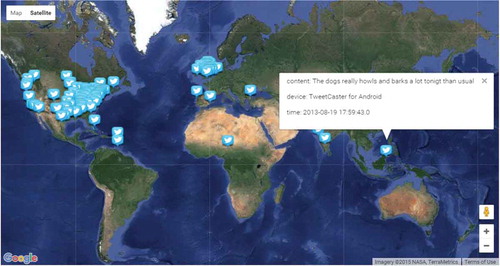
With the recent flourish of smart devices (e.g. smartphones and tablets), and location based services, people are sharing their experiences, stories and photos in their daily lives through the Internet at an unprecedented speed and scale. For example, about a billion registered users and 100 million daily action users were publishing 550 million tweets per day in July 2015, and that number is escalating rapidly (Smith Citation2015). In fact, numerical empirical studies have shown that if combined effectively, such crowdsourcing data can be used to track and monitor events, and indicate society situations as they are evolving at different spatio-temporal granularity across the world (Singh, Gao, and Jain Citation2010). The phenomenon has been termed ‘citizen-as-sensors’ (Goodchild Citation2007). The fundamental idea is that human actors in a connected environment when augmented with ubiquitous mechanical sensory systems can form the most intelligent sensor web (Sheth, Henson, and Sahoo Citation2008). Such intelligent sensor webs have the most realistic implications for applications such as earthquake prediction, while instrumental surveillance sensor networks and other approaches cannot tell or estimate effectively when and where an earthquake will occur. However, even with a small percent of social network users contributing information about the time and locations of anomalous animal behaviours (), meaningful spatio-temporal patterns about potential disasters can be observed and detected.
Figure 1. Spatial distribution of tweets mentioning about ‘dog barking’ between Aug 15th, 2013 and Aug 20th, 2014.
Indeed there have been some successful prediction cases, but it’s still hard to say how successful these efforts are, and some of the scientists even argued that earthquakes cannot be predicted reliably (Geller Citation2011; Geller et al. Citation1997). To some extent, we agree with these scientists, based on the existing studies so far, earthquakes cannot or have not been reliably predicted. Nevertheless, we also want to argue that earthquakes can be predicted somehow (reliably or effectively) in the future alongside the emergence of state-of-the-art technologies and methods, such as GIS, web 2.0 technology, crowdsourcing, volunteered geographic information (VGI), and high-performance/cloud computing resources.
This paper aims to develop a framework that can collect and mine the abnormal animal behaviours contributed by citizens from both active sources (designed mobile app and websites) and passive sources (social media outlets like Twitter, Facebook) to quantitatively help the prediction of earthquakes, and to finally justify our argument that earthquakes can be predicted somehow (reliably or effectively) alongside the emergence of state-of-the-art technologies and methods. While much more data can be harvested from passive sources using various application programming interfaces (APIs), many of them are merely daily greetings to or short conversations with friends; another major format is short descriptions with web links to external sources. Only a small percentage of messages are useful. Additionally, identifying these informative messages is not straightforward. Data mining techniques are required to extract useful information from the mass of data, and yet success is not guaranteed. Therefore, active sources collected from developed mobile app and spatial web portal will be largely used within the proposed framework. To demonstrate the effectiveness of the proposed framework, a web and mobile-based hybrid geoportal is designed and developed to collect the abnormal phenomena around the public’s daily life, such as the anomalous animal behaviours, which will be manipulated, analysed and finally visualized through interactive maps.
This study contributes to the integration of geo-sensors from both animals (sensing a potential earthquake and therefore behaving abnormally) and citizens (witnessing the anomalous behaviours) by developing a framework and prototype that can collect and track these geo-sensors from both active and passive sources for earthquake prediction. Rather than providing a successful case study and validating the proposed framework, this paper strategically initiates discussion and encourages more efforts on this field. In the rest of this manuscript, a more comprehensive introduction to VGI for disaster management, the detailed research framework, and demonstration of the geoportal will be introduced, respectively, and followed by the summary and conclusions.
2. VGI and disaster management
Crowdsourcing information, or VGI, is defined as the widespread engagement of large numbers of citizens to the creation of geographic information (Goodchild Citation2007). Recently, the spatially enabled information and communications technologies (ICT), e.g. web 2.0, Global Positioning System (GPS) and broadband, have undoubtedly enabled the booming VGI and allowed the public to contribute and use geographic information and create maps through the Internet (Goodchild Citation2007). Further smart devices with enabled location based services have also empowered the (near) real-time geospatial data collection and dissemination (Lane et al. Citation2010). Apparently, the ease and capability of citizens as volunteers to create and publish geographic information as well as the need of resources for rapid communication during crisis events constitute a new disaster management context (Goodchild and Glennon Citation2010; Wald et al. Citation2012).
Recently, VGI has been broadly utilized in disaster management, especially during the disaster response stage. The VGI postings have been successfully demonstrated to be capable of providing an alternative to official sources during the Santa Barbara wildfires of 2007–2009 with significant time efficiency in the collection and sharing of information (Goodchild and Glennon Citation2010). During the 2010 Haiti Earthquake, a mapping community was formed immediately by the public all around the world, and then the geospatial data about Port-au-Prince were quickly generated based on Open Street Map (OSM), and utilized effectively in the rescue efforts (Li and Goodchild Citation2012). In addition, in response to the flooding in Queensland in 2011, the Australian Broadcasting Corporation employed the data contributed by citizens (McDougall Citation2011). The flood extent mapping for rudimentary post-disaster assessment was also successfully empowered by VGI through georeferenced images and social media content. Besides, similar efforts had also been done for the recent earthquake in Nepal.
On the other hand, the main issues that have been raised regarding the use of VGI are reliability and quality of VGI (Elwood Citation2008; Flanagin and Metzger Citation2008). The first concern originates from the user and information credibility. It is quite challenging to know whether the information citizens’ share is accurate. For example, during the Haiti earthquake, rumours circulated in Twitter that UPS would ‘ship any package under 50 pounds to Haiti’ or ‘several airlines would take medical personnel to Haiti free of charge to help with earthquake relief’ (Leberecht Citation2010). These turned out to be hearsay rather than eyewitness accounts, and subsequently clarified by UPS and airline companies as false information. As a result, Twitter, has been long criticized as it may propagate misinformation, rumours, and, in extreme case, propaganda (Leberecht Citation2010). In fact, based on the analysis of credibility of information in tweets corresponding to fourteen high impact news events of 2011 around the globe, Gupta and Kumaraguru (Citation2012) claim that only ‘30% of total tweets about an event contained situational information about the event while 14% was spam’.
Another concern comes from the location reliability. Users with location services enabled on smart mobile devices can post content (e.g. text messages or photos) with locations, which typically are represented as a pair of coordinates (latitude and longitude). The locations along with the place names mentioned in the content text are then used to identify the areas of anomalous animal behaviours (A2B). During this process, we rely on the assumption that users will report information about the A2B events they witnessed and experienced at the exact locations where these events occurred. However, the locations in the time of posting content and locations of event occurred are not necessarily consistent.
In addition, the extreme abundance of the VGI information has also brought an issue about its structure, storage and dissemination, i.e. the design of the Spatial Data Infrastructure (SDI) (Bishr and Janowicz Citation2010). Regardless of these problems and challenges, e.g. data collection and dissemination, data quality and security, data management, and SDI, VGI could still play a very important role in supporting disaster management for all these stages in the Disaster Cycle (). However, it seems most of these contemporary efforts on the role of VGI in disaster management predominantly centre on the response phase of the Disaster Cycle. Apparently, there is huge room for the applications of VGI and other ICTs to disaster management on the other phases based on the characteristics of VGI and other ICTs.
Despite the quality issues, successful earthquake prediction cases in history, such as the earthquake prediction in Haicheng, China in the 1970s by the mass reports and crowdsourcing, showed the promising potential of leveraging citizens-as-sensors for detecting an upcoming earthquake. Considering the opportunities and limitation of using VGI information for earthquake prediction, a framework is proposed to collect and utilize multi-sourced VGI from both active (mobile app) and passive (social media outlets) sources, and a crowdsourcing information validation mechanism is also used to improve the quality of VGI information.
The proposed framework integrates the state-of-the-art technologies and methods we have, e.g. web 2.0, VGI, mobile technology, big data analytics, and an open-ended and user-friendly geoportal will be designed and developed to collect near real-time information of the abnormal phenomena, including anomalous animal behaviours. During a disaster, the mobile technology can be used to disseminate pre-disaster warnings and post-disaster announcements, to receive information about relief needs, and to exchange information about disaster events (Fajardo and Oppus Citation2010; Lane et al. Citation2010; Stephenson Citation2008). By enabling the access of the broadest category of preparations or response information in even one click, it could make such a dramatic change in how we prepare and respond to disasters (Stephenson Citation2008). Progress has been made to leverage such technology to support disaster response and management and to better prepare humanitarian aid workers by governmental agencies and non-profit organizations (Gonsalves Citation2017). One well-known example is FEMA app which provides weather and shelters information, opens a communication channel between FEMA and the public, and enables users to share disaster photos. This framework therefore will include a web and mobile-based hybrid geoportal where both mobile and web interfaces will allow the public to actively contribute the crowdsourcing information (Goodchild Citation2007; Sui, Elwood, and Goodchild Citation2012). The propose framework will help predict the earthquake and justify our argument that earthquakes will and can be predicted somehow (reliably or effectively) alongside the emergence of state-of-the-art technologies and methods. The details of the framework and geo portal prototype will be introduced in the Section 3 and Section 4.
3. Framework
shows a general architecture for leveraging multi-sourced crowdsourcing information to detect natural disasters that are extremely difficult to predict using traditional approaches. The system is designed to include four integrated components, including: (1) data resources. We will develop an automatic system to crawl and integrate multi-sourced, unstructured, heterogonous data, such as citizen active reports, social media data and web news reports. Citizen active reports will be collected from a developed mobile app or web service, and feeds of anomalous animal behaviours from different social media such as Twitter, Facebook and Flickr will be also monitored and tracked; (2) data repository. The data repository component is responsible for archiving and retrieving datasets; (3) web/mobile server. This component provides data processing and high-level analytical functions; and (4) spatial web/mobile portal (SWMP). The SWMP component provides information analysis for end users through geo-visualization or animation with interactive tools. Even though a stand-alone desktop client could be used to serve as a data client, a web or mobile portal with an online interactive graphic user interface (GUI) (Roth Citation2013) is more accessible as the entry point for the public users to use the system.
Figure 2. Architecture of the proposed framework.
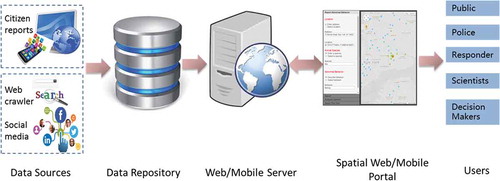
In this architecture, the data repository and SWMP components are commonly included in a web or mobile system. The core components in the architecture are the data source and web/mobile server components, which implement and provide the capabilities of efficient A2B discovery, and analysis. These components are elaborated below.
3.1. Data sources
Multi-sourced data can be integrated to discover A2Bs. The primary active data source we will leverage is from the reports of citizens or volunteers. Through a web or mobile interface, citizens can report the A2Bs they experienced or witnessed. Social media are widely used as an intelligent ‘geo-sensor’ network to detect extreme events or disasters and gain situational awareness for emergency responders during a critical crisis by monitoring and tracking the feedback from the citizens. Using Twitter stream APIs, millions of tweet messages can be accumulated daily. We will use these social media as a primary passive source to complete the A2Bs database. Additional passive data sources that will be leveraged include local news that can be crawled by Google search APIs.
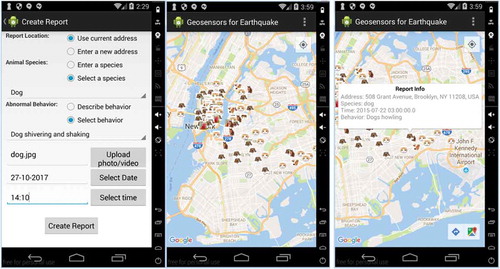
In this work, a major challenge is to determine A2Bs, and differentiate an A2B from a normal animal behaviour. In the history, several strange animal behaviours have been recorded in advance of a natural disaster, such as cats hiding, dogs shivering and shaking (indicating an upcoming thunderstorm), dogs howling and even biting owners, hens not laying eggs, cows not giving milk, horses circling and grouping in fear, bees abandoning hives, or birds abandoning nesting areas etc., all of which are clues of major geological vibrations, electromagnetic changes, or shifts in atmospheric pressure leading to natural hazards, such as earthquake (Bressan Citation2011). Any behaviour from the historical record list will be considered as an A2B. Based on this list, we will generate a set of keywords indicating each animal species and associated anomalous behaviours. Any message from the social media mentioning both types of information, such as ‘dog’ and ‘shiver’, will be treated as a valid A2B entry. In order to facilitate citizens to actively report such A2B, the developed SWMP portal (–) can allow citizens to select an A2B from the built-in list for reporting.
Figure 3. Workflow to build an A2Bs database.
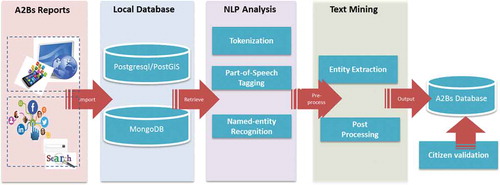
Figure 4. Report an anomalous animal behaviour through the spatial web portal.
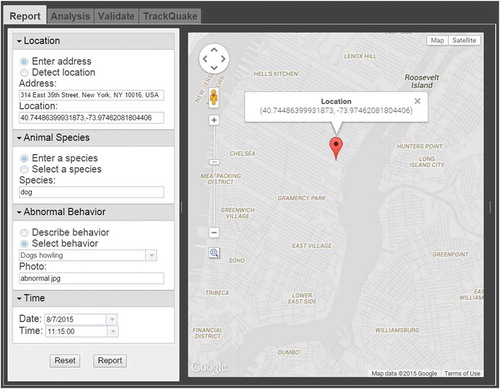
Figure 5. Collect and analyse the anomalous animal behaviours through the spatial mobile portal.
3.2. Data repository
After collecting multi-sourced A2Bs, we will import them into different types of databases to be processed for potential earthquake detection. Social media data and local news are not uniform and structured in nature, and are therefore stored in a non-traditional, NoSQL database system. In our design, MongoDB, a scalable open-source NoSQL database, instead of a relational database management system (RDMS), is used to manage those social media datasets efficiently. Citizen reports, provided through a web or mobile portal with required fields to fill out, have structured information and are appropriate to be managed and organized by a traditional spatial RDMS, such as PostgreSQL/PostGIS.
Since these multi-sourced data are heterogeneous, several data processing procedures are developed to extract relevant information for building an A2Bs database for earthquake event detection (). For each A2B entry, the database will store several key fields, including animal species, abnormal behaviours, photo of the A2B, reporter name, address when the A2B was witnessed, location represented as a point geometry, and time when the information was posted. The raw text of each document entry crawled from web or social media can be processed with the same procedure starting from natural language processing (NPL).
NPL tasks include from relatively straightforward tokenization and part-of-speech (POS) tagging, to more complex procedure named-entity recognition (NER), which identifies and categorizes atomic elements in text (e.g. animal species, abnormal behaviours, locations and time). Then, we will put all atomic elements through the text mining procedure that we develop to extract the values of the fields defined in A2Bs database. All the procedures mentioned earlier are designed to be automatic with minimal human intervention.
In order to improve the accuracy of text mining results for the A2Bs database, the SWMP (section 3.4) will include an interface to display the data and allow the public users to validate and correct them voluntarily, as well as submit their own reports for A2Bs. This crowdsourcing data verification will facilitate improved A2B reporting in an increasingly networked world.
3.3. Web/mobile server
The Web/Mobile Server provides the key functions to support data search, analysis, visualization or animation services. Users can request the services through the spatial portal to the server. To handle the user request from the end users, three service request handling modules are designed on the server side, including:
Request parser: After receiving a request from the web client, the request parser in the sever side will be invoked to parse and extract the query parameters, such as request type (reporting or validating an A2B event), and create a new service task based on the parameters. Then it adds the task into the service request queue, which is processed by the request integrator.
Request integrator: This module is used to schedule and dispatch the query tasks to the data repository server with the A2B database deployed. Based on the query parameters extracted by the request parser, the request integrator can determine what functions should be invoked to handle the request.
Response generator: This module is responsible for integrating and wrapping up the query results returned from the database. In addition, the response generator module can also perform the analytical or data mining functions, such as spatial clustering, over the query results to generate response results. Finally, it sends those response results in the format of JSON to the spatial portal for further visualization or animation.
3.4. Spatial web/mobile portal
The SWMP is a web-based or mobile-based spatial gateway for the purposes of reporting, validating and discovering A2Bs. With the portal, public users can search against the resource catalogue to discover the historical and latest A2Bs. Additionally, users can report or validate surrounding A2Bs. Within this framework, several functions should include within the SWMP component, including (1) A2B reporting, (2) A2B validating, (3) A2B query, (4) Event prediction, and (5) Data analysis/visualization. An A2B reporting module is designed for citizens to report various abnormal behaviours of different animal species they are witnessing or have witnessed. An A2B query module supports search against the database for multiple resources, e.g. historical abnormal behaviours and associated natural disasters. The data analysis/visualization module is used to provide functions for mapping, visualizing, analysing and animating A2Bs with interactive tools. This module enables end users to analyse and visualize spatio-temporal information of A2Bs. The following sections will elaborate other key modules.
3.4.1. A2B validating
VGI offers an alternative mechanism for the acquisition and compilation of geographic information, but suffers from a general lack of quality assurance at the same time (Li and Goodchild Citation2012). As a result, concerns have been raised about their quality. In order to address such concerns, we design the A2B validation module to enable public users to cast one vote to approve or disapprove each piece of A2B. Users can check the latest A2B reports through the web or mobile interface which displays metadata of reports, such as location, time, animal species and specific abnormal behaviours. If a citizen was at the neighbourhood during the temporal span as reported for an A2B, and he or she did not see it occur, then a disapproval can be submitted through the online interfaces. However, if they also witnessed the same A2B event, they can submit an approval for the event. Based on the number of approvals and disapprovals, we can determine whether a specific report is trustable. With such a validation procedure, we can improve the quality of VGI information.
3.4.2. Event prediction
Each collected A2B report has a pair of coordinates (latitude and longitude) revealing the specific location where it was witnessed. We can apply spatial clustering to learn the regions that may have potential natural disasters causing unusual animal behaviour. K-means (Ashbrook and Starner Citation2003) is a well-known clustering algorithm commonly used to identify Point of Interests (POIs). However, the K-means algorithm needs us to specify the number of clusters (K) in advance. This is quite challenging since we do not know appropriate values for the number of places that have strange animal behaviours.
The density-based spatial clustering of applications with noise (DBSCAN) (Ester et al. Citation1996) is also widely used because it can discover clusters of arbitrary shape with noise. It does not require specification of the number of clusters before clustering begins, but requires two inputs: the minimum number of points (minpts) forming a cluster, and the radius of the ε-neighbourhood of a point (eps). These two parameters are less likely to be changed within a particular application. Previous work provided limited guidance on setting a minpts and eps value for general datasets (e.g. A2B report points) (Ester et al. Citation1996; Zhou et al. Citation2004). For example, Ester et al. (Citation1996) show that using a minpts value smaller than four may misclassify random points as clusters while a minpts value of four or larger will unlikely produce clusters of varying results. Zhou et al. (Citation2004) chose to set the eps value to 20 m, which is approximate to the uncertainty in GPS readings. Eventually, trial-and-error may determine their appropriate values in our work.
After performing the spatial clustering, a set of clusters will be discovered with each cluster indicating a region of potential earthquake area. A circumscribed boundary of each cluster including all the points in the cluster is used to better represent the shape of the region. In fact, simpler features, such circumscribed circles and minimum rectangles may also be used to represent the potential regions. However, DBSCAN does not consider the population heterogeneity across space, and might fail to detect clusters properly when the clusters are of different point densities (Huang, Cervone, and Zhang Citation2017). In this study, the density of report points mentioning the animal abnormal behaviours might be different across regions and highly correlated with the built environment. To address this limitation, other more sophisticated spatial clustering algorithms, such as VDBSCAN (Liu, Zhou, and Wu Citation2007) could be leveraged to accommodate varying densities. In addition, density based methods, such as kernel density estimation (KDE), can also be used to mitigate the population influence of the data contributors. As a popular analytical technique to identify high concentration (i.e. ‘hotspots’) of point events, KDE has been widely used in many applications such as crime pattern analysis (Hart and Zandbergen Citation2014). KDE over a two-dimensional space can be represented as (Shi Citation2010):
where is the estimated density at location
, h is the kernel bandwidth,
is the total number of event points (e.g. the number of A2B reports), and
is the distance between the event point i and location
, and K is kernel function.
The end result is a smooth surface consisting of the discrete report points ‘smoothed’ over the study area, thereby producing a continuous probability density surface indicating the occurring risk of an upcoming event. The result could be single or dual density estimation depending on whether the KDE is applied to one or two variables. For a dual KDE, a kernel density is estimated for each variable individually and then the two density estimates are related with each other mostly through a quotient algebraic operation (Jansenberger and Staufer-Steinnocher Citation2004).
To minimize the impact of underlying population, we can leverage both KDE estimation techniques: (1) With the dual KDE: KDE can be performed to generate the reporting and population density map separately, and then a dual KDE map can be produced by the cell value of reporting density divided by its population density. To produce population density map, we may rely on survey data, such as the American Community Survey (ACS) data that describe the population characteristics within areal units, provided by the official organizations (e.g. the U.S. Census Bureau). The areal data can be converted into point data by deriving the centroid of each areal unit and assigning the population value at each areal unit to the centroid. (2) Using single KDE, the underlying population heterogeneity can be considered by modifying the Equation 1 to integrate the underlying population density of each event point i as a weight while deriving its contributions in calculating the density of a location s.
Besides the type of estimation technique to use (e.g. single vs. duel KDE), the produced density surface map highly depends on, the method for interpolation (e.g. the kernel function), the bandwidth (e.g. the size of the search radius used by the kernel), and the output format units (e.g. grid cell size) in which the KDE results will be generated (Hart and Zandbergen Citation2014). After producing the KDE surface, the grid cells with density than a predefined threshold f will be identified as ‘hotspot’ regions, and all geo-tagged points within these regions are then used to outline the potential event boundary (convex hull or concave hull). The determination of hotspot regions is very sensitive to the value of f, no guidelines and rules on its selections are available yet in our situation. We therefore should fully examine the effectiveness of various parameters for both spatial clustering based and density based methods, determine their most optimal combinations, and eventually select the most appropriate method to predict the location of an potential earthquake by validating the detected regions and comparing with the boundary of real-world earthquake events.
4. Demonstration
Based on the proposed framework, a system prototype has been developed and implemented to demonstrate how to report and detect A2Bs for potential earthquake events. Several open-sources are used for the prototype development. For instance, Twitter4J (2014), an unofficial Java library for the Twitter API, is used for accessing stream tweets, and Google Maps API (2014) for mapping A2B reports and the geo-tagged social media data. The portal supports several functions from submitting an A2B report, posting a query request to visualize or animate the query results.
Through the web or mobile user interface, users can report an A2B event by supplying various information about the event, such as the location, animal species, and abnormal behaviours (–). To help users enter the information efficiently and accurately, several options are provided for each information category. For example, in the location category, users can directly enter an address, the system will use the Google Geocoding APIFootnote1 to convert it into geographic coordinates. Users are also allowed to drop a pin on the Google Map ( right) indicating the location of the A2B event, and the system will then automatically detect the geographic coordinates of the location, and reverse geocoding will be performed to convert the coordinates into a human-readable address. With a mobile portal, the user can directly use the current position of the mobile as the event location ( left). Similarly, if the users know the animal species while entering the animal species information, they can directly put the name of the species in the text box. Otherwise, a dropdown list will be provided for users to select a specific species.
Finally, users need to provide an accurate description about the strange behaviours of the animals. As stated earlier, several strange animal behaviours indicate a potential natural disaster are recorded and provided for users to choose ( left; left). If an anomalous animal behaviour has not been recorded, the user can choose to describe the behaviour instead. Users can also upload the photos of unusual animal behaviours.
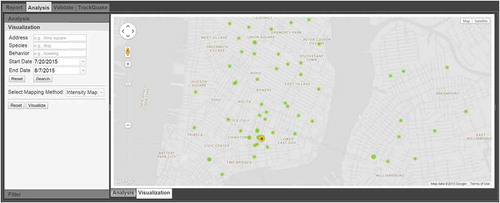
Users can explore the A2Bs in various themes by configuring the input parameters of the query, such as temporal information (timestamps when messages were posted), area of interest (AOI, also known as spatial domain information), and analytical methods (visualization or charting), etc. After obtaining query results, users are able to visualize the results to get an overall view of the spatial and temporal patterns of the A2Bs retrieved from the database (–). After fetching the A2Bs of a specific spatial and temporal scope from the database, we can perform spatial clustering to detect potential regions of natural disasters (). Users also allow editing, approving or rejecting a specific report ().
Figure 6. Spatial distribution of anomalous animal behaviours.
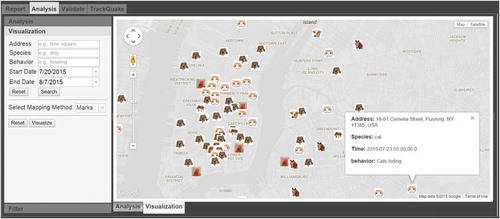
Figure 7. Temporal distribution of anomalous animal behaviours.
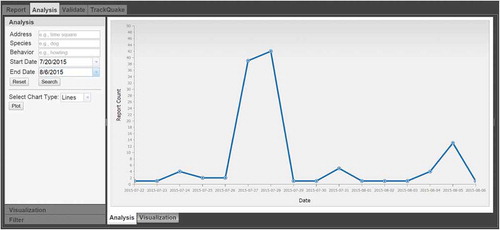
Figure 8. Detect anomalous animal behaviours.
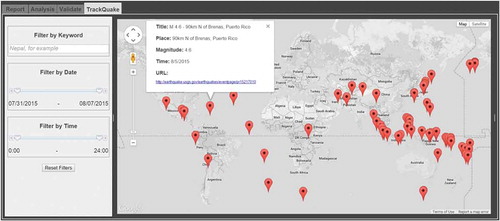
We can also track the earthquakes by using US Geological Survey (USGS) earthquake data.Footnote2 Our system can automatically harvest the latest earthquake data every 5 min from USGS. While the default is to show the earthquakes with magnitude more than 4.5 (), users can track other events by searching with different keywords, or temporal information.
Figure 9. Edit, approve or disapprove a report.
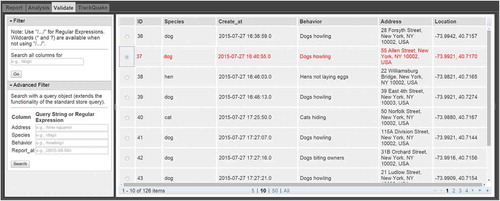
Figure 10. Track earthquake events.
5. Discussion and conclusion
The earthquake is always a scary and traumatic subject in mankind’s history. However, only a few number of earthquakes are successfully predicted. Correspondingly, the predication of earthquakes is always a hot topic that has drawn wide attention from academia, government, media and public, but has insignificant progress in the past. Some scientists even argued that earthquakes cannot be predicted reliably (Geller Citation2011; Geller et al. Citation1997). We agree with these scientists to a certain degree, based on the existing studies and mankind’s knowledge so far, earthquakes cannot or have not been reliably predicted. However, with the emergence of state-of-the-art technologies and methods, such as GIS, web 2.0 technology, VGI, and flexible computing infrastructure (e.g. cloud computing and mobile computing), it is definitely possible that earthquakes will and can be predicted somehow (reliably or effectively) in the future.
In this study, a framework is proposed for earthquake prediction. Within the framework, crowdsourcing data of anomalous animal behaviours from both active and passive sources are employed. This study leverages ‘citizen-as-sensors’ to locate anomalous animal behaviours, which prove to be reliable signals for a potential earthquake (Tong Citation1988), and cannot be detected using traditional instrumental surveillance sensor networks. In other words, this research has great potential to effectively predict where and when an earthquake might occur using various spatio-temporal analysis and mining strategies, and then justify our argument comprehensively, given enough datasets could be collected. Rather than pessimistically admitting that ‘earthquakes cannot be reliably predicted’, we argue that more efforts and practices would eventually pave the way for the timely and reliable predication of earthquakes. This work sheds the lights on how the evolving GIScience can contribute to this effort.
A proof-of-concept prototype is developed and implemented to collect, visualize and mine crowdsourcing data to detect a potential earthquake. In the future, we would like to continue to the development of this framework and prototype further to help predict earthquakes, which is still ongoing and different from the emphasis of this research. For example, more advanced and user-friendly functions will be developed for our developed hybrid spatial web and mobile portal. We will also promote our portal to different user communities for data collection, and develop more sophisticated algorithms for integrating data for multiple sources for earthquake location prediction instead of simply using density-based approach (Section 3.4.2). We also believe that successful and dependable earthquakes prediction, as what was done in Haichen, China, will come to us soon, but in an easier, more efficient and effective way.
Disclosure statement
No potential conflict of interest was reported by the authors.
Notes
References
- Aki, K. 2013. “A Probabilistic Synthesis of Precursory Phenomena.” In Earthquake Prediction, 566–574. Washington, DC: American Geophysical Union.
- Ashbrook, D., and T. Starner. 2003. “Using GPS to Learn Significant Locations and Predict Movement across Multiple Users.” Personal and Ubiquitous Computing 7 (5): 275–286. doi:10.1007/s00779-003-0240-0.
- Baharin, S. S. K., A. S. Shibghatullah, and Z. Othman. 2009. “Disaster Management in Malaysia: An Application Framework of Integrated Routing Application for Emergency Response Management System.” Paper presented at the Soft Computing and Pattern Recognition, 2009. SOCPAR’09. International Conference of, Malacca.
- Bakun, W., B. Aagaard, B. Dost, W. Ellsworth, J. Hardebeck, R. Harris, … J. Lienkaemper. 2005. “Implications for Prediction and Hazard Assessment from the 2004 Parkfield Earthquake.” Nature 437 (7061): 969–974. doi:10.1038/nature04067.
- Bishr, M., and K. Janowicz. 2010. “Can We Trust Information?-The Case of Volunteered Geographic Information.” Paper presented at the Towards Digital Earth Search Discover and Share Geospatial Data Workshop at Future Internet Symposium, Berlin.
- Bressan, D. 2011. “Can Animals Sense Earthquakes?.” Accessed December 12, 2018. https://blogs.scientificamerican.com/history-of-geology/can-animals-sense-earthquakes/.
- Dieterich, J. H., and B. Kilgore. 1996. “Implications of Fault Constitutive Properties for Earthquake Prediction.” Proceedings of the National Academy of Sciences 93 (9): 3787–3794. doi:10.1073/pnas.93.9.3787.
- Elwood, S. 2008. “Volunteered Geographic Information: Future Research Directions Motivated by Critical, Participatory, and Feminist GIS.” GeoJournal 72 (3–4): 173–183. doi:10.1007/s10708-008-9186-0.
- Escap, U. N. 2015. “Overview of Natural Disasters and Their Impacts in Asia and the Pacific, 1970–2014.”
- Ester, M., H.-P. Kriegel, J. Sander, and X. Xu. 1996. “A Density-Based Algorithm for Discovering Clusters in Large Spatial Databases with Noise.” Paper presented at the Kdd, Portland, OR.
- Fajardo, J. T. B., and C. M. Oppus. 2010. “A Mobile Disaster Management System Using the Android Technology.” WSEAS Transactions on Communications 9 (6): 343–353.
- Flanagin, A. J., and M. J. Metzger. 2008. “The Credibility of Volunteered Geographic Information.” GeoJournal 72 (3–4): 137–148. doi:10.1007/s10708-008-9188-y.
- Florido, E., F. Martínez-Álvarez, A. Morales-Esteban, J. Reyes, and J. Aznarte-Mellado. 2015. “Detecting Precursory Patterns to Enhance Earthquake Prediction in Chile.” Computers & Geosciences 76: 112–120. doi:10.1016/j.cageo.2014.12.002.
- Geller, R. J. 2011. “Shake-Up Time for Japanese Seismology.” Nature 472 (7344): 407–409. doi:10.1038/nature10105.
- Geller, R. J., D. D. Jackson, Y. Y. Kagan, and F. Mulargia. 1997. “Enhanced: Earthquakes Cannot Be Predicted.” Science 275 (5306): 1616–1620. doi:10.1126/science.275.5306.1616.
- Gonsalves, A. 2017. “Top Mobile Apps for Disaster Preparedness and Response.”
- Goodchild, M. F. 2007. “Citizens as Sensors: The World of Volunteered Geography.” GeoJournal 69 (4): 211–221. doi:10.1007/s10708-007-9111-y.
- Goodchild, M. F., and J. A. Glennon. 2010. “Crowdsourcing Geographic Information for Disaster Response: A Research Frontier.” International Journal of Digital Earth 3 (3): 231–241. doi:10.1080/17538941003759255.
- Guangmeng, G., and Y. Jie. 2013. “Three Attempts of Earthquake Prediction with Satellite Cloud Images.” Natural Hazards and Earth System Science 13 (1): 91–95. doi:10.5194/nhess-13-91-2013.
- Gupta, A., and P. Kumaraguru. 2012. “Credibility Ranking of Tweets during High Impact Events.” Paper presented at the Proceedings of the 1st Workshop on Privacy and Security in Online Social Media, Lyon.
- Hart, T., and P. Zandbergen. 2014. “Kernel Density Estimation and Hotspot Mapping: Examining the Influence of Interpolation Method, Grid Cell Size, and Bandwidth on Crime Forecasting.” Policing: An International Journal of Police Strategies & Management 37 (2): 305–323. doi:10.1108/PIJPSM-04-2013-0039.
- Hayakawa, M., and Y. Hobara. 2010. “Current Status of Seismo-Electromagnetics for Short-Term Earthquake Prediction.” Geomatics, Natural Hazards and Risk 1 (2): 115–155. doi:10.1080/19475705.2010.486933.
- Huang, Q., G. Cervone, and G. Zhang. 2017. “A Cloud-enabled Automatic Disaster Analysis System of Multi-sourced Data Streams: An Example Synthesizing Social Media, Remote Sensing and Wikipedia Data.” Computers, Environment and Urban Systems 66: 23–37.
- Jansenberger, E. M., and P. Staufer-Steinnocher. 2004. “Dual Kernel Density Estimation as a Method for Describing Spatio-Temporal Changes in the Upper Austrian Food 865 Retailing Market.” Paper presented at the 7th AGILE Conference on Geographic Information Science, Castellon.
- Jones, L. M., and P. Molnar. 1979. “Some Characteristics of Foreshocks and Their Possible Relationship to Earthquake Prediction and Premonitory Slip on Faults.” Journal of Geophysical Research: Solid Earth (1978–2012) 84 (B7): 3596–3608. doi:10.1029/JB084iB07p03596.
- Kagan, Y. Y., and L. Knopoff. 1987. “Statistical Short-Term Earthquake Prediction.” Science 236 (4808): 1563–1567. doi:10.1126/science.236.4808.1563.
- King, C. Y. 1986. “Gas Geochemistry Applied to Earthquake Prediction: An Overview.” Journal of Geophysical Research: Solid Earth (1978–2012) 91 (B12): 12269–12281. doi:10.1029/JB091iB12p12269.
- Kirschvink, J. L. 2000. “Earthquake Prediction by Animals: Evolution and Sensory Perception.” Bulletin of the Seismological Society of America 90 (2): 312–323. doi:10.1785/0119980114.
- Kunitsyn, V., E. Andreeva, I. Nesterov, A. Padokhin, D. Gribkov, and D. A. Rekenthaler. 2014. “Earthquake Prediction Research Using Radio Tomography of the Ionosphere.” In Universe of Scales: From Nanotechnology to Cosmology, edited by F. Freund and S. Langhoff, Vol. 150. Springer Proceedings in Physics. Cham: Springer.
- Lane, N. D., E. Miluzzo, H. Lu, D. Peebles, T. Choudhury, and A. T. Campbell. 2010. “A Survey of Mobile Phone Sensing.” Communications Magazine, IEEE 48 (9): 140–150. doi:10.1109/MCOM.2010.5560598.
- Leberecht, T. 2010. “Twitter Grows Up in Aftermath of Haiti Earthquake.” Accessed January 19, 2018. https://www.cnet.com/news/twitter-grows-up-in-aftermath-of-haiti-earthquake/.
- Li, L., and M. F. Goodchild. 2012. “The Role of Social Networks in Emergency Management: A Research Agenda.” In Managing Crises and Disasters with Emerging Technologies: Advancements: Advancements, edited by M. Jennex, 245-255. IGI Global.
- Liu, P., D. Zhou, and N. Wu. 2007. “VDBSCAN: Varied Density Based Spatial Clustering of Applications with Noise.” Paper presented at the Service Systems and Service Management, 2007 International Conference on, Chengdu.
- Marzocchi, W., and J. D. Zechar. 2011. “Earthquake Forecasting and Earthquake Prediction: Different Approaches for Obtaining the Best Model.” Seismological Research Letters 82 (3): 442–448. doi:10.1785/gssrl.82.3.442.
- McDougall, K. 2011. “Using Volunteered Information to Map the Queensland Floods.” Paper presented at the Proceedings of the 2011 Surveying and Spatial Sciences Conference: Innovation in Action: Working Smarter (SSSC 2011), Wellington.
- Mogi, K. 2013. “Seismicity in Western Japan and Long-Term Earthquake Forecasting.” In Earthquake Prediction, edited by D. W. Simpson and P. G. Richards, 43-51. Washington, DC: American Geophysical Union.
- Mogi, K. 1985. Earthquake Prediction. https://www.osti.gov/biblio/5659040
- Moustra, M., M. Avraamides, and C. Christodoulou. 2011. “Artificial Neural Networks for Earthquake Prediction Using Time Series Magnitude Data or Seismic Electric Signals.” Expert Systems with Applications 38 (12): 15032–15039. doi:10.1016/j.eswa.2011.05.043.
- Poser, K., and D. Dransch. 2010. “Volunteered Geographic Information for Disaster Management with Application to Rapid Flood Damage Estimation.” Geomatica 64 (1): 89–98.
- Rikitake, T. 1975. “Earthquake Precursors.” Bulletin of the Seismological Society of America 65 (5): 1133–1162.
- Rikitake, T. 1988. “Earthquake Prediction: An Empirical Approach.” Tectonophysics 148 (3): 195–210. doi:10.1016/0040-1951(88)90128-X.
- Roth, R. E. 2013. “Interactive Maps: What We Know and What We Need to Know.” Journal of Spatial Information Science 6: 59–115.
- Sheth, A., C. Henson, and S. S. Sahoo. 2008. “Semantic Sensor Web.” Internet Computing, IEEE 12 (4): 78–83. doi:10.1109/MIC.2008.87.
- Shi, X. 2010. “Selection of Bandwidth Type and Adjustment Side in Kernel Density Estimation over Inhomogeneous Backgrounds.” International Journal of Geographical Information Science 24 (5): 643–660. doi:10.1080/13658810902950625.
- Singh, V. K., M. Gao, and R. Jain. 2010. “Social Pixels: Genesis and Evaluation.” Paper presented at the Proceedings of the international conference on Multimedia, Firenze.
- Smith, C. 2015. “By The Numbers: 150+ Amazing Twitter Statistics.” Accessibile through http://expandedramblings.com/index.php/march-2013-by-the-numbers-a-few-amazing-twitter-stats/ Accessed September 21 2015
- Stephenson, W. D. 2008. “Growing Smartphone Use Will Have Dramatic Impact on Disaster Response.”
- Sui, D., S. Elwood, and M. Goodchild. 2012. Crowdsourcing Geographic Knowledge: Volunteered Geographic Information (VGI) in Theory and Practice. Springer Science & Business Media, Berlin.
- Suzuki, Z. 1982. “Earthquake Prediction.” Annual Review of Earth and Planetary Sciences 10: 235–256. doi:10.1146/annurev.ea.10.050182.001315.
- Tong, W. K. 1988. Abnormal Animal Behavior and the Prediction of Earthquakes. Chicago, IL: Northeastern Illinois University.
- Uyeda, S., T. Nagao, and M. Kamogawa. 2009. “Short-Term Earthquake Prediction: Current Status of Seismo-Electromagnetics.” Tectonophysics 470 (3–4): 205–213. doi:10.1016/j.tecto.2008.07.019.
- Varotsos, P., K. Alexopoulos, and M. Lazaridou. 1993. “Latest Aspects of Earthquake Prediction in Greece Based on Seismic Electric Signals, II.” Tectonophysics 224 (1): 1–37. doi:10.1016/0040-1951(93)90055-O.
- Wald, D. J., V. Quitoriano, C. B. Worden, M. Hopper, and J. W. Dewey. 2012. “USGS “Did You Feel It?” Internet-Based Macroseismic Intensity Maps.” Annals of Geophysics 54: 6.
- Whitcomb, J. H., J. D. Garmany, and D. L. Anderson. 1973. “Earthquake Prediction: Variation of Seismic Velocities before the San Francisco Earthquake.” Science 180 (4086): 632–635. doi:10.1126/science.180.4086.632.
- Yin, X.-C., X.-Z. Chen, Z.-P. Song, and C. Yin. 1995. “A New Approach to Earthquake Prediction: The Load/Unload Response Ratio (LURR) Theory.” Pure and Applied Geophysics 145 (3–4): 701–715. doi:10.1007/BF00879596.
- Zhou, C., D. Frankowski, P. Ludford, S. Shekhar, and L. Terveen. 2004. “Discovering Personal Gazetteers: An Interactive Clustering Approach.” Paper presented at the Proceedings of the 12th annual ACM international workshop on Geographic information systems, Washington, DC.