
ABSTRACT
This study aimed at characterizing the spatial and temporal characteristics of vegetation abundance (represented by At-Sensor Normalized Difference Vegetation Index (ASNDVI) and/or Land Surface Normalized Difference Vegetation Index (LSNDVI)) and surface temperature (represented by At-Sensor Brightness Temperature (ASBT) and/or Land Surface Temperature (LST)) and investigating the types of the relationships between these variables in different seasons in different years using Landsat data in Greater Amman Municipality in Jordan. Correlation analysis using Pearson’s correlation coefficient showed that using either ASNDVI or LSNDVI and either ASBT or LST should lead to the same results. Change analysis from 1987–2016 using map algebra showed that the majority of the municipality was subjected to both no change and small increase in vegetation abundance in summer and winter and both no change and small increase in surface temperature in summer and both no change and small decrease in surface temperature in winter. Vegetation abundance variability reflected partly the land cover characteristics of the municipality while surface temperature variability indicated the potential of the presence of an inverted surface urban heat island pattern. Correlation analysis using contingency tables showed the presence of negative relationship in summer and positive relationship in winter between vegetation abundance and surface temperature.
1. Introduction
According to recent estimates of the United Nations, the world population reached 7.3 billion as of mid-2015 and is projected to increase by more than 2.4 billion people within the next 35 years, reaching 9.7 billion in 2050 (UN Citation2015). This dramatic and fast increase in population is projected to be concentrated in urban areas; about two-thirds of the world population will be urban in 2050, which is roughly the reverse of the global rural-urban population distribution of the mid-twentieth century (UN Citation2014).
Although urban areas offer opportunities for people do not exist elsewhere, such as better education, health care, and employment, they are key drivers of global change. Rapid, unplanned, and uncontrolled urban growth is often associated with adverse social, economic, and/or environmental impacts. They include impacts on human health (Moore, Gould, and Keary Citation2003), cities ecology (Grimm et al. Citation2008), plants and animals species richness (McKinney Citation2008), structure and function of forested wetlands (Faulkner Citation2004) and coastal wetlands (Lee et al. Citation2006), agricultural lands (Kurucu and Chiristina Citation2008), surface microclimate and hydrology parameters (Carlson and Arthur Citation2000), and urban warming (Grimmond Citation2007).
Therefore, for humans to live in healthy, liveable, and sustainable urban areas, good urban planning and governance are needed. This should be supported by incorporating surface urban heat islands (including their spatial and temporal characteristics and their determinant factors) into policies and strategies designed and implemented for urban areas (Barata et al., Citation2011; Hewitt, Mackres, and Shickman Citation2014; UN-Habitat Citation2015).
One key determinant of surface urban heat islands is vegetation abundance and its change spatially and temporally (EPA Citation2017). Over the years, many vegetation indices that can be indirectly derived from satellite-based remote sensing sensors have been proposed (Silleos et al. Citation2006). These indices (either slope-based, distance-based, or orthogonal transformation) varied in complexity for the purpose of obtaining reliable information about the type, amount, and condition of vegetation. The main concept of these indices rely on making use of the strong contrast between the reflected energy in the red and near-infrared regions of the electromagnetic spectrum caused by healthy canopies of green vegetation. The vegetation index used in this study is the Normalized Difference Vegetation Index (NDVI), which was introduced by Rouse et al. (Citation1974). The NDVI is the most common vegetation index. Its values range from −1 to +1. The higher the value and closer to +1 the denser and healthier the vegetation present on land. Zero or negative values mean no vegetation (NASA Citation2017).
Since the launch of the first Landsat satellite in 1972, Landsat continued to provide free-of-charge remote sensing data that are described as being the world’s longest continuously acquired collection of civilian space-based moderate-resolution land remote sensing data (Wulder et al. Citation2016; USGS Citation2017). This makes these data suitable for monitoring indirectly spatial and temporal changes in social, economic, and environmental characteristics of urban areas. Hence, indirect Landsat-based NDVI data were used. The exoatmospheric top-of-atmosphere reflectance values of the red and near-infrared bands of Landsat sensors are used to produce At-Sensor NDVI (ASNDVI). Extracted land surface reflectance values from exoatmospheric top-of-atmosphere reflectance values by implementing some kind of atmospheric correction technique on the red and near-infrared bands of Landsat sensors are used to produce Land Surface NDVI (LSNDVI) (Rouse et al. Citation1974).
Furthermore, strengths of surface urban heat islands can be quantified through measuring differences in surface temperatures between developed and undeveloped urban areas spatially and temporally (EPA Citation2017). The thermal bands available in Landsat sensors provide valuable information about the At-Sensor Brightness Temperature (ASBT) assuming that the earth’s surface is a blackbody with spectral emissivity of one (Chander, Markham, and Helder Citation2009). If corrected to actual land surface emissivities, ASBT can be converted to Land Surface Temperature (LST) (Lo and Quattrochi Citation2003; Sobrino, Jimenez-Munoz, and Paolini Citation2004), which is positively correlated with ambient air temperature (Nichole Citation1996; Kawashima et al. Citation2000; Gallo et al. Citation2011; Lin et al. Citation2016). Again, these data also were used.
This study builds upon previous work that were conducted in different areas in the world such as Indianapolis in the United States (Weng, Lu, and Schubring Citation2004), Shanghai in China (Yue et al. Citation2007; Wang et al. Citation2017), Santiago in Chile (Pena Citation2008), Ho Chi Minh in Vietnam (Van and Bao Citation2010), Hong Kong (Liu and Zhang Citation2011), and Yazd in Iran (Zareie et al. Citation2016). It extends previous work and focus on evaluating the usability of Landsat Thematic Mapper (TM) and Operational Land Imager/Thermal Infrared Scanner (OLI/TIRS) sensors for characterizing the spatial and temporal characteristics of vegetation abundance and surface temperature throughout different seasons in different years in Greater Amman Municipality in the Hashemite Kingdom of Jordan. The municipality represents a typical semiarid urban area with uncontrolled and unplanned growth resulted partly from rapid increase in the population affected greatly by numerous waves of displacement and refugee movements reflecting wider political circumstances in the Middle East as early as 1948.
However, although multiple scientists emphasized the importance of applying atmospheric correction on the red and near-infrared regions of the electromagnetic spectrum before deriving NDVI from these bands (e.g. Lo and Quattrochi Citation2003; Stathopoulou, Cartalis, and Petrakis Citation2007), Sobrino, Jimenez-Munoz, and Paolini (Citation2004) expected that since NDVI is constructed from a normalized difference, the differences between NDVI maps before correction and NDVI maps after correction should be low. In addition, although previous studies such as the ones that were conducted by Weng, Lu, and Schubring (Citation2004), Yue et al. (Citation2007), Van and Bao (Citation2010), and Zareie et al. (Citation2016) asserted the importance of transforming ASBT to LST using land surface emissivities, Lo and Quattrochi (Citation2003) stated that the blackbody temperatures are just adequate for use in surface temperature mapping from thermal infrared images. Furthermore, although multiple studies observed negative relationship between vegetation abundance and surface temperature (e.g. Lo and Quattrochi Citation2003; Gioia et al. Citation2014; Zhou et al. Citation2014; Zareie et al. Citation2016), this relationship had been shown to be more complex and influenced by other factors in different seasons (e.g. Yuan and Bauer Citation2007; Yue et al. Citation2007). Therefore, this study also aims at answering the questions: (1) ‘Are there significant differences between ASNDVI and LSNDVI maps and between ASBT and LST maps in different seasons in different years in urban areas including Greater Amman Municipality?’ and (2) ‘What are the types and strengths of the relationships between vegetation abundance and surface temperature in different seasons in different years in urban areas including Greater Amman Municipality?’.
The outcomes of this study will benefit decision makers nationally and internationally who are involved in incorporating surface urban heat islands into policies and strategies designed and implemented for urban areas.
2. Study area, data, and methods
2.1 Study area
The study area is Greater Amman Municipality (). It is located between latitudes 31°48՜ N and 32°5՜ N and longitudes 35°44՜ E and 36°13՜ E.
Figure 1. Location map of Greater Amman Municipality in Amman Governorate in the Hashemite Kingdom of Jordan.
Greater Amman Municipality is the largest municipality in Amman Governorate with an area of about 624 km2. It encapsulates the metropolitan region of Amman City – the capital of the Hashemite Kingdom of Jordan – and forms the country’s economic, political, and cultural centre.
The population of Greater Amman Municipality (as the case for the whole Hashemite Kingdom of Jordan) has been affected greatly by numerous waves of displacement and refugee movements reflecting wider political circumstances. Since its independence in 1946, the kingdom has been avoiding terrorism and instability and therefore considered to be among the safest of Arab countries in the Middle East. In 1948 and 1967, the country received a great influx of Palestinian refugees from the wars with Israel. In 1991 and 2003, the country received another great influx of refugees from Kuwait and Iraq during the two Gulf wars. Very recently and as a result of the ongoing civil war in Syria in the aftermath of the Arab Spring the country received and is still receiving another great influx of Syrian refugees. Most of the refugees preferred to stay in Greater Amman Municipality. The population of Greater Amman Municipality has grown from merely about 50,000 in 1946 to about 1,203,000 in 1987 (with an increase of about 28,122 inhabitants per year in 41 years) to about 2,584,600 in 2014 (with an increase of about 51,170 inhabitants per year in 27 years). In 2015 the population of the municipality has grown to about 4,019,100. This means an increase of about 1,434,500 inhabitants in just 1 year. The majority of this last increase is attributed to Syrians fleeing their country and seeking safe haven in the kingdom (DOS Citation2016a; DOS Citation2016b).
Greater Amman Municipality has a semiarid climate with mildly hot and breezy summers, which usually last from May–September, and cool winters, which usually last from December–March, with some to minimal precipitation. Due to mainly differences in elevation, snow may accumulate in winter in western and northern parts of the municipality while at the same time it could be raining at other parts (JMD Citation2017).
2.2 Satellite data
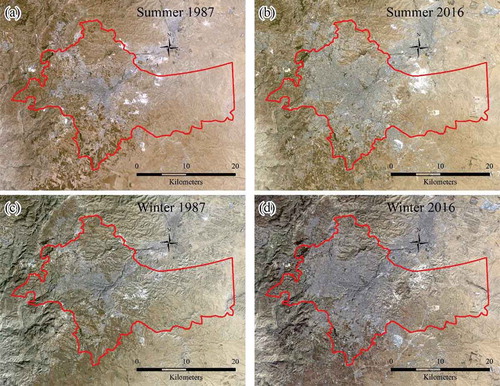
Two cloud-free Level 1T Landast-5 TM scenes represent summer and winter of the year 1987 and two cloud-free Level 1T Landsat-8 OLI/TIRS scenes represent summer and winter of the year 2016 for path 174 and row 038 with Universal Transverse Mercator (UTM) Zone 36 N coordinate system were obtained from the United States Geological Survey (USGS) EarthExplorer website (USGS Citation2016a) (). The two Landsat-5 TM scenes were collected on 13 July 1987 and 18 January 1987 while the two Landsat-8 OLI/TIRS scenes were collected on 12 July 2016 and 3 February 2016. July represents the hottest month of the year while January and February represent the coldest months of the year in Greater Amman Municipality (JMD Citation2017).
Figure 2. Natural colour composites of subsets of (a) Landsat-5 TM image acquired on 13 July 1987, (b) Landsat-8 OLI/TIRS image acquired on 12 July 2016, (c) Landsat-5 TM acquired on 18 January 1987, and (d) Landsat-8 OLI/TIRS image acquired on 3 February 2016. The red polygons represent the borders of Greater Amman Municipality.
The TM sensor collects seven spectral bands (three visible, one near-infrared, two shortwave infrared, and one thermal) with 8-bit radiometric resolution. The spatial resolution for all the bands is 30 m except for the thermal band 6, which is 120 m but resampled to 30 m (USGS Citation2016b). The OLI/TIRS sensors collect 11 spectral bands (3 visible, 1 near-infrared, 2 shortwave infrared, 2 thermal, in addition to 1 coastal/aerosol, 1 cirrus, and 1 panchromatic) with 12-bit radiometric resolution. All the bands have a spatial resolution of 30 m except the panchromatic band 8, which has a 15-m spatial resolution, and the two thermal bands 10 and 11, which have a 100-m spatial resolution. However, these panchromatic and thermal bands are resampled to 30 m (USGS Citation2016c).
2.3 Vegetation abundance data
The first parameter needed to accomplish the goals of this study is vegetation abundance. The pixel values (i.e. Digital Numbers (DNs)) of the red bands (i.e. band 3 for TM sensor and band 4 for OLI sensor) and near-infrared bands (i.e. band 4 for TM sensor and band 5 for OLI sensor) for the four Landsat images were converted to at-sensor spectral radiance () (W/(m2 sr μm)) by applying Equation 1 (Chander, Markham, and Helder Citation2009; USGS Citation2016d):
where is band-specific rescaling gain factor ((W/(m2 sr μm))/DN),
is band-specific rescaling bias factor (W/(m2 sr μm)), and
is quantized calibrated pixel value (DN).
The eight at-sensor spectral radiance images resulted from applying Equation 1 were converted to exoatmospheric top-of-atmosphere reflectance () (unitless) by applying Equation 2 (Chander, Markham, and Helder Citation2009; USGS Citation2016d):
where is Earth-Sun distance (astronomical units),
is mean exoatmospheric solar irradiance (W/(m2 μm)), and
is Sun elevation (degrees).
Again, the eight at-sensor spectral radiance images resulted from applying Equation 1 were converted to land surface reflectance () (unitless) by implementing the Dark Object Subtraction atmospheric correction into Equation 3 (Moran et al. Citation1992; Chavez Citation1996):
where is the path radiance (W/(m2 sr μm)) and given by Equation 4 assuming unit atmospheric transmittance in both the viewing direction and illuminating direction and zero downwelling diffuse irradiance (Moran et al. Citation1992; Chavez Citation1996):
The eight exoatmospheric top-of-atmosphere reflectance images resulted from applying Equation 2 were converted to ASNDVI while the eight land surface reflectance images resulted from applying Equation 3 were converted to LSNDVI by applying Equations 5 and 6, respectively (Rouse et al. Citation1974):
where and
are the exoatmospheric top-of-atmosphere reflectance in the near-infrared and red bands, respectively, and
and
are the land surface reflectance in the near-infrared and red bands, respectively.
Finally, all four ASNDVI and four LSNDVI images were clipped according to the borders of Greater Amman Municipality. Hence, four maps represent summer and winter ASNDVI for the years 1987 and 2016 and four maps represent summer and winter LSNDVI for the years 1987 and 2016 were produced for Greater Amman Municipality.
2.4 Surface temperature data
The second parameter needed to accomplish the goals of this study is surface temperature. The pixel values (i.e. DNs) of the thermal bands (i.e. band 6 for TM sensor and band 10 for TIRS sensor) for the four Landsat images were converted to at-sensor spectral radiance () (W/(m2 sr μm)) by applying Equation 1 as described earlier. Then, the obtained images were converted to effective ASBT (Kelvin) by applying Equation 7 (Chander, Markham, and Helder Citation2009; USGS Citation2016d):
where is calibration constant 1 (W/(m2 sr μm)) and
is calibration constant 2 (Kelvin).
The four ASBT images resulted from applying Equation 7 were converted to LST (Kelvin) by applying Equation 8 (Artis and Carnahan Citation1982):
where is wavelength of emitted radiance (μm),
is constant (μm Kelvin), and
is land surface emissivity (unitless), which was derived from LSNDVI values considering the three different cases as in Equation 9 (Sobrino, Jimenez-Munoz, and Paolini Citation2004; Stathopoulou, Cartalis, and Petrakis Citation2007):
where is
of soil,
is
of vegetation, and
is
of mixed soil and vegetation and given by Equation 10 (Sobrino, Jimenez-Munoz, and Paolini Citation2004; Stathopoulou, Cartalis, and Petrakis Citation2007):
where is surface roughness and
is proportion of vegetation, which was calculated according to Equation 11 (Carlson and Ripley Citation1997):
Finally, all four ASBT and four LST images were converted to degrees Celsius (°C) by subtracting 273.15 from their values and then were clipped according to the borders of Greater Amman Municipality. Hence, four maps represent summer and winter ASBT for the years 1987 and 2016 and four maps represent summer and winter LST for the years 1987 and 2016 were produced for Greater Amman Municipality.
2.5 Correlation and change analysis
First, correlation analysis using Pearson’s product-moment correlation coefficient (r) (Chen and Popovich Citation2002) was applied to obtain information about the relationships between ASNDVI and LSNDVI and between ASBT and LST for both summer and winter seasons in the years 1987 and 2016 in Greater Amman Municipality. This correlation coefficient measures the linear relationships between variables measured on continuous scales. It ranges from −1 (perfect negative correlation) to +1 (perfect positive correlation) with zero means no correlation.
Depending on the results obtained from this correlation analysis, one of the following two paths was followed. If the correlations were found not to be significant, the subsequent analysis was conducted for vegetation abundance (represented by ASNDVI and LSNDVI maps) and surface temperature (represented by ASBT and LST maps) for summers and winters of the years 1987 and 2016. If the correlations were found to be significant, the same subsequent analysis was conducted for vegetation abundance (represented only by LSNDVI maps) and surface temperature (represented only by LST maps) for summers and winters of the years 1987 and 2016 since they represent direct land surface characteristics.
Vegetation abundance and surface temperature maps for summers and winters of the years 1987 and 2016 for Greater Amman Municipality were first normalized to scale their values between zero and one by applying Equation 12 (Gelman and Hill Citation2007):
where and
could be for ASNDVI, LSNDVI, ASBT, or LST and the subscripts
and
represent the minimum and maximum values, respectively, for the
. This eliminated the impacts of imaging times and made the maps more comparable. The resulted normalized maps were then reclassified using ‘equal interval’ classification method to convert the normalized values to categorical ordinal scale with only five classes as shown in . This emphasized vegetation abundance and surface temperature values existed in each category relative to other categories and made the interpretation of the generated maps easier.
Table 1. The old values along with their new values and descriptions, which were used for reclassifying the normalized maps for Greater Amman Municipality.
Change analysis for summer during the 29-year period using map algebra was carried out by subtracting the normalized and reclassified maps of vegetation abundance and surface temperature for the year 1987 from their counterparts for the year 2016. The same change analysis was repeated for winter maps. Then, the resulted difference maps for both summer and winter seasons were again reclassified as shown in into only five ordinal classes showing areas in Greater Amman Municipality subjected to large decrease, small decrease, no change, small increase, or large increase. Again, this reclassification emphasized these categories relative to each other and made the interpretation of the resulted maps easier.
Table 2. The old values along with their new values and descriptions, which were used for reclassifying the difference maps for Greater Amman Municipality.
Finally, correlation analysis using contingency tables (Everitt Citation2000) was performed to characterize the relationships between normalized and reclassified vegetation abundance and normalized and reclassified surface temperature maps for both summer and winter seasons in the years 1987 and 2016 in Greater Amman Municipality. Contingency tables are two-way frequency tables used to present categorical data in terms of frequency counts. They show the observed frequency of two variables. There is a row for each factor level and a column for each response level. By computing expected frequencies for the cells in the contingency tables and comparing these expected values with the observed ones a Pearson Chi-Square (χ2) test is calculated. This test was used in this study to determine the significance of the contingency tables. The null hypothesis is whether the two variables are independent. In addition, the measure of association represented by Gamma (G) test was applied to describe the general direction and strength of the relationships. G is a measure of ordinal association that consider whether the first variable tends to increase as the second variable increases. It classifies pairs of observations as concordant or discordant. A pair is concordant if an observation with a larger value of the first variable also has a larger value of the second variable. A pair is discordant if an observation with a larger value of the first variable has a smaller value of the second variable. G values range from −1 (perfect negative association) to +1 (perfect positive association), while zero means no association. It appears with its standard error and confidence interval.
3. Results
3.1 The relationships between ASNDVI and LSNDVI and between ASBT and LST
Correlation analysis using Pearson’s product-moment correlation coefficient () showed significant strong positive correlations (more than 0.96) at less than 0.001 significance level between ASNDVI and LSNDVI and between ASBT and LST in both summer and winter seasons in the years 1987 and 2016.
Table 3. Pearson correlation coefficients along with their p-values computed between normalized and reclassified ASNDVI and normalized and reclassified LSNDVI and between normalized and reclassified ASBT and normalized and reclassified LST in different seasons in different years in Greater Amman Municipality.
Hence, the second path of analysis as described earlier, which concentrated on vegetation abundance represented only by LSNDVI and surface temperature represented only by LST, was followed.
3.2 LSNDVI variability
With regard to LSNDVI (; ), it was noticed that ‘Low’ and ‘Very Low’ classes dominated Greater Amman Municipality in summer of the year 1987. These two classes constituted about 99% of the total area of the municipality. However, in summer of the year 2016 ‘Low’ class alone dominated Greater Amman Municipality with percentage coverage of about 93% of the total area of the municipality. These trends were associated with both ‘No Change’ and ‘Small Increase’ in LSNDVI from summer of the year 1987 to summer of the year 2016 (; ); ‘Very Low’ class almost disappeared in summer of the year 2016 (; ). These two change classes were the major classes and constituted about 99% of the total area of the municipality.
Table 4. The areas covered by each class along with their percentages in each normalized and reclassified LSNDVI and normalized and reclassified LST map in the summer and winter in the years 1987 and 2016 in Greater Amman Municipality.
Table 5. The areas covered by each change class associated with the normalized and reclassified LSNDVI and normalized and reclassified LST along with their percentages during the 29-year period from 1987–2016 either in the summer or in winter in Greater Amman Municipality.
Figure 3. Normalized and reclassified LSNDVI maps of Greater Amman Municipality in (a) 13 July 1987, (b) 12 July 2016, (c) 18 January 1987, and (d) 3 February 2016.
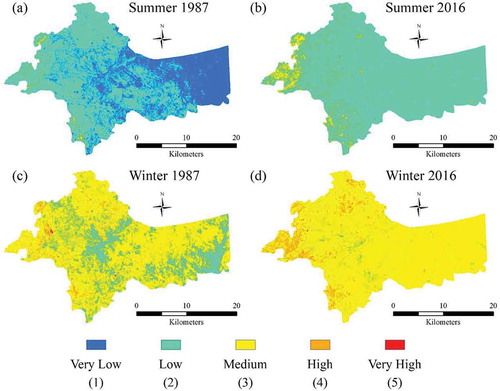
Figure 4. Reclassified change maps resulted from (a) subtracting the normalized and reclassified LSNDVI map of summer 1987 from its counterpart of summer 2016 and (b) subtracting the normalized and reclassified LSNDVI map of winter 1987 from is counterpart of winter 2016.
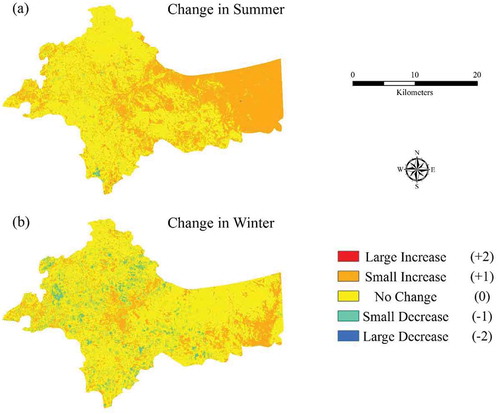
In winter (; ) it was noticed that ‘Medium’ and ‘Low’ classes dominated Greater Amman Municipality in the year 1987. These two classes constituted about 93% of the total area of the municipality. However, in winter of the year 2016 ‘Medium’ class alone dominated Greater Amman Municipality with percentage coverage of about 90% of the total area of the municipality. These trends were associated with both ‘No Change’ and ‘Small Increase’ in LSNDVI from winter of the year 1987 to winter of the year 2016 (; ); ‘Low’ class almost disappeared in winter of the year 2016 (; ). These two change classes were the major classes and constituted about 95% of the total area of the municipality.
3.3 LST variability
With regard to LST (; ), it was noticed that ‘High’ and ‘Medium’ classes dominated Greater Amman Municipality in summers of the years 1987 and 2016. These two classes constituted about 92% and 85% of the total area of the municipality in summer of the year 1987 and summer of the year 2016, respectively. These trends were associated with both ‘No Change’ and ‘Small Increase’ in LST from summer of the year 1987 to summer of the year 2016 (; ); the percentage coverage of ‘Very High’ class increased from about 3% of the total area of the municipality in summer of the year 1987 to about 14% of the total area of the municipality in summer of the year 2016 (; ). These two change classes were the major classes and constituted about 92% of the total area of the municipality.
Figure 5. Normalized and reclassified LST maps of Greater Amman Municipality in (a) 13 July 1987, (b) 12 July 2016, (c) 18 January 1987, and (d) 3 February 2016.
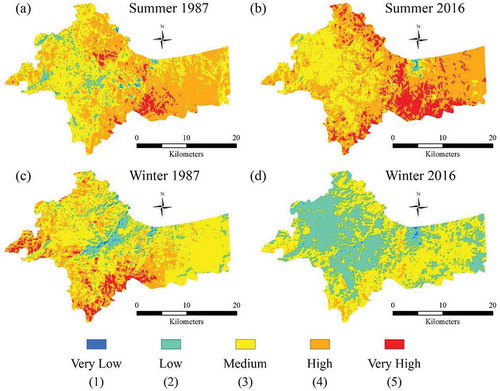
Figure 6. Reclassified change maps resulted from (a) subtracting the normalized and reclassified LST map of summer 1987 from its counterpart of summer 2016 and (b) subtracting the normalized and reclassified LST map of winter 1987 from is counterpart of winter 2016.
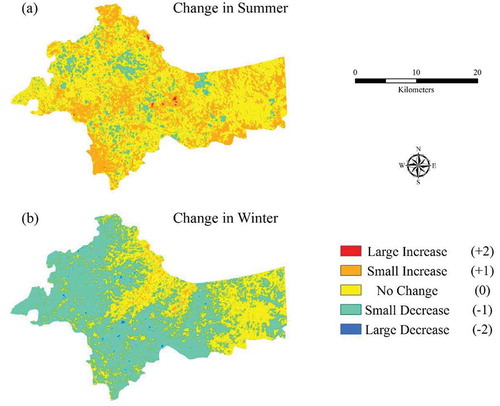
In winter (; ) it was noticed that ‘Medium’ class dominated Greater Amman Municipality in the years 1987 and 2016. This class constituted about 55% and 53% of the total area of the municipality in winter of the year 1987 and winter of the year 2016, respectively. These trends were associated with both ‘Small Decrease’ and ‘No Change’ in LST from winter of the year 1987 to winter of the year 2016 (; ); in winter of the year 1987 ‘High’ and ‘Low’ classes were the second and third major classes, respectively, however, this situation was reversed in winter of the year 2016 where ‘Low’ and ‘High’ classes were the second and third major classes, respectively. These two change classes were the major classes and constituted about 97% of the total area of the municipality.
3.4 The relationship between LSNDVI and LST
The results of correlation analysis using contingency tables between normalized and reclassified LSNDVI and normalized and reclassified LST for both summer and winter seasons in the years 1987 and 2016 were shown in –. Pearson Chi-Square (χ2) test computed from these tables showed the presence of significant correlations between these two variables in both summer and winter seasons in the years 1987 and 2016 and rejected the null hypothesis at less than 0.001 significance level that these two variables were independent.
Table 6. Contingency table for normalized and reclassified LSNDVI and normalized and reclassified LST for summer season in 2016 in Greater Amman Municipality.
Table 7. Contingency table for normalized and reclassified LSNDVI and normalized and reclassified LST for winter season in 2016 in Greater Amman Municipality.
Table 8. Contingency table for normalized and reclassified LSNDVI and normalized and reclassified LST for summer season in 1987 in Greater Amman Municipality.
Table 9. Contingency table for normalized and reclassified LSNDVI and normalized and reclassified LST for winter season in 1987 in Greater Amman Municipality.
These significant correlations between LSNDVI and LST were accentuated by G test (). The test showed that these two variables were significantly negatively associated in summer (the correlation coefficients were about −0.116 in the year 1987 and about −0.487 in the year 2016); the majority of the pixels (about 30% in 1987 () and about 54% in 2016 ()) were reclassified as having both ‘Low’ LSNDVI and ‘High’ LST. The test also showed that these two variables were significantly positively associated in winter (the correlation coefficients were about 0.344 in the year 1987 and about 0.370 in the year 2016); the majority of the pixels (about 40% in 1987 () and about 47% in 2016 ()) were reclassified as having both ‘Medium’ LSNDVI and ‘Medium’ LST.
Table 10. Gamma (G) coefficients along with their standard errors and confidence intervals computed for different seasons in different years between normalized and reclassified LSNDVI and normalized and reclassified LST in Greater Amman Municipality.
4. Discussion, conclusions, and recommendations
This study had the following main goals. The first goal was to explore the strength and direction of the relationships (1) between ASNDVI and LSNDVI maps, (2) between ASBT and LST maps, and (3) between ASNDVI or LSNDVI and ASBT or LST maps. These relationships were investigated in different seasons (i.e. summer and winter) in different years (i.e. 1987 and 2016) in Greater Amman Municipality, which represents a typical semiarid urban area. This urban area suffered from uncontrolled and unplanned growth resulted partly from rapid increase in the population affected greatly by numerous waves of displacement and refugee movements as early as 1948. Landsat data were used since they provide free-of-charge remote sensing data that are described as being the world’s longest continuously acquired collection of civilian space-based moderate-resolution land remote sensing data, which make them suitable for monitoring indirectly spatial and temporal changes in social, economic, and environmental characteristics of urban areas. The second goal was to characterize the spatial and temporal characteristics of vegetation abundance (represented by ASNDVI and/or LSNDVI) and surface temperature (represented by ASBT and/or LST) in Greater Amman Municipality for summer and winter seasons in the years 1987 and 2016. Vegetation abundance and its change spatially and temporally is a key determinant of surface urban heat islands. In addition, strengths of surface urban heat islands can be quantified through measuring differences in surface temperatures between developed and undeveloped urban areas spatially and temporally.
The results of this study emphasized what Sobrino, Jimenez-Munoz, and Paolini (Citation2004) expected and showed that the differences between ASNDVI and LSNDVI maps were very small and not significant in both summer and winter seasons in the years 1987 and 2016 in Greater Amman Municipality. This study also showed – as Lo and Quattrochi (Citation2003) concluded – that the differences between ASBT and LST maps also were very small and not significant in both summer and winter seasons in the years 1987 and 2016 in Greater Amman Municipality. Therefore, using either ASNDVI or LSNDVI and either ASBT or LST for surface urban heat island studies in urban areas that have semiarid climates should lead to the same results. However, this conclusion needs further investigation by applying the same methodology adopted in this study to other urban areas that have different climatic classifications. In addition, other land surface reflectance and land surface emissivity extraction techniques could be tested.
In addition, although the relationships between vegetation abundance (represented by ASNDVI and/or LSNDVI) and surface temperature (represented by ASBT and/or LST) in summer and winter seasons in the years 1987 and 2016 in Greater Amman Municipality were found not to be strong, they were significantly negative in summer and significantly positive in winter. The observed negative relationships in summer could be attributed to the natural cooling potential of vegetation from both evapotranspiration and shade. Actually, these negative relationships were the main reason behind adopting increasing vegetated surfaces in urban areas in strategies designed and implemented for ameliorating and mitigating the adverse impacts of urban heat islands (either surface or atmospheric) (Hewitt, Mackres, and Shickman Citation2014; EPA Citation2017). Moreover, the observed positive relationships in winter could be attributed to soil moisture conditions (Yuan and Bauer Citation2007; Yue et al. Citation2007). Usually, summers in Greater Amman Municipality are hot and dry while winters are cool and wet. Therefore, although vegetation abundance might be used for analysis of surface urban heat island effects during summers, it might not be suitable in winters. Hence, more detailed studies about this conclusion are recommended.
With regard to vegetation abundance (represented by ASNDVI and/or LSNDVI), its spatial characteristics reflected to some degree the spatial characteristics of land cover of the municipality. That is, the western parts are mostly covered with forests while the centre is highly urbanized and the east is mostly covered with rangelands. Furthermore, the spatial characteristics of the changes happened to vegetation abundance (represented by ASNDVI and/or LSNDVI) also reflected to some degree the changes in land cover. That is, from 1987–2016 there was a noticeable expansion of urbanized areas on the expense of forested areas and rangelands. On the contrary, with regard to surface temperature (represented by ASBT and/or LST), its spatial characteristics did not reflect the spatial characteristics of land cover of the municipality as described earlier. That is, the centre of the municipality, which is highly urbanized, had relatively lower surface temperatures as compared to its peripheries. This is contradictory to the basic notion of urban heat islands (either surface or atmospheric). Actually, an inverted surface urban heat island pattern was observed in Abu Dhabi metropolitan area in the United Arab Emirates, which represents an urban centre with arid climate (Lazzarini, Marpu, and Ghedira Citation2013). This might lead to the conclusion that in semiarid urban areas the spatial and temporal patterns of surface urban heat islands are more complex than expected and need further investigation. Hence, there is a need to develop a research, which concentrates on investigating the relationships between vegetation abundance and land cover and between surface temperature and land cover in semiarid urban areas including Greater Amman Municipality. Furthermore, the spatial characteristics of the changes happened to surface temperature (represented by ASBT and/or LST) might lead to the conclusion that summer of the year 2016 was relatively hotter than summer of the year 1987 and winter of the year 2016 was relatively colder than winter of the year 1987.
However, these results about vegetation abundance and surface temperature variabilities need further investigation and validation. Regardless the fact that different measures were adopted in producing the variables used in this study (such as using cloud-free Landsat data that were acquired in the same seasons, applying atmospheric and emissivity corrections, and applying normalization and reclassification techniques), which eliminated to some degree the impacts of atmospheric conditions and land surface emissivities and imaging times and made the maps more comparable, uncertainties might still present. This is actually the norm in all environmental studies. Furthermore, relying on data that represented just 2 years (i.e. 1987 and 2016) is not enough to describe the changes happened to the spatial and temporal characteristics of vegetation abundance and surface temperature and hence more data that represent other years should had been included. However, although Landsat satellites can provide vegetation abundance and surface temperature indicators as early as the 1970s (i.e. for more than 40 years) with relatively reasonable moderate ground resolutions suitable for studying urban areas, they cannot provide daily indicators of these variables that can be aggregated to produce monthly and yearly averages. First, the repeat cycles for Landsat satellites are 18 days (for Landsat-1, 2, and 3) or 16 days (for Landsat-4, 5, 7, and 8). Second, the availability of Landsat imagery for a certain area (as the case for all passive satellite-based remote sensing sensors) depends heavily on the general atmospheric conditions of that area specifically cloud cover. Therefore, even if multiple good-quality imageries for multiple years were included for an area, they would represent only discontinuous and irregular snapshots for that area. This hinders the usability of these imageries for producing continuous time-series of vegetation abundance and surface temperature, which are very important for studying past temporal and spatial changes and predicting future temporal and spatial trends and cycles for urban areas and identifying outliers.
This study shed light on the importance of incorporating surface urban heat islands (represented by surface temperature) and its determinant factors (specifically vegetation abundance) into policies and strategies designed and implemented for urban areas including Greater Amman Municipality.
Disclosure statement
No potential conflict of interest was reported by the author.
References
- Artis, D. A., and W. H. Carnahan. 1982. “Survey of Emissivity Variability in Thermography of Urban Areas.” Remote Sensing of Environment 12: 313–329. doi:10.1016/0034-4257(82)90043-8.
- Barata, M., E. Ligeti, G. De Simone, T. Dickinson, D. Jack, J. Penney, M. Rahman, and R. Zimmerman. 2011. “Climate Change and Cities: First Assessment Report of the Urban Climate Change Research Network.” In Climate Change and Human Health in Cities, Editors C. Rosenzweig, W. D. Solecki, S. A. Hammer, and S. Mehrotra, 179–213. UK: Cambridge University Press, Cambridge.
- Carlson, T. N., and S. T. Arthur. 2000. “The Impact of Land Use – Land Cover Changes Due to Urbanization on Surface Microclimate and Hydrology: A Satellite Perspective.” Global and Planetary Change 25: 46–65.
- Carlson, T. N., and D. A. Ripley. 1997. “On the Relation between NDVI, Fractional Vegetation Cover, and Leaf Area Index.” Remote Sensing of Environment 62: 241–252. doi:10.1016/S0034-4257(97)00104-1.
- Chander, G., B. L. Markham, and D. L. Helder. 2009. “Summary of Current Radiometric Calibration Coefficients for Landsat MSS, TM, ETM+, and EO-1 ALI Sensors.” Remote Sensing of Environment 113: 893–903. doi:10.1016/j.rse.2009.01.007.
- Chavez, P. S. 1996. “Image-Based Atmospheric Corrections – Revisited and Improved.” Photogrammetric Engineering and Remote Sensing 62: 1025–1036.
- Chen, P. Y., and P. M. Popovich. 2002. Correlation: Parametric and Nonparametric Measures. Sage University Papers Series on Quantitative Applications in the Social Sciences, 07-139. Thousand Oaks, CA: Sage.
- DOS. 2016a. Population and Housing Census, 2015: Main Results. Amman: Department of Statistics Press.
- DOS. 2016b. Jordan Household International Migration Survey, 2014: Final Report. Amman: Department of Statistics Press.
- EPA (2017). Heat Island Compendium, Chapter 1: Urban Heat Island Basics. United States Environmental Protection Agency. URL: https://www.epa.gov/heat-islands/heat-island-compendium (accessed on 19 January 2017).
- Everitt, B. S. 2000. The Analysis of Contingency Tables. 2nd edition, Monographs on Statistics and Applied Probability 45. Boca Raton, FL: Chapman and Hall/CRC.
- Faulkner, S. 2004. “Urbanization Impacts on the Structure and Function of Forested Wetlands.” Urban Ecosystems 7: 89–106. doi:10.1023/B:UECO.0000036269.56249.66.
- Gallo, K., R. Hale, D. Tarpley, and Y. Yu. 2011. “Evaluation of the Relationship between Air and Land Surface Temperature under Clear- and Cloudy-Sky Conditions.” Journal of Applied Meteorology and Climatology 50: 767–775. doi:10.1175/2010JAMC2460.1.
- Gelman, A., and J. Hill. 2007. Data Analysis Using Regression and Multilevel/Hierarchical Models. New York: Cambridge University Press.
- Gioia, A., L. Paolini, A. Malizia, R. Oltra-Carrio, and J. A. Sobrino. 2014. “Size Matters: Vegetation Patch Size Surface Temperature Relationship in Foothills Cities of Northwestern Argentina.” Urban Ecosystems 14: 1161–1174. doi:10.1007/s11252-014-0372-1.
- Grimm, N. B., S. H. Faeth, N. E. Golubiewski, C. L. Redman, J. Wu, X. Bai, and J. M. Briggs. 2008. “Global Change and the Ecology of Cities.” Science 319: 756–760. doi:10.1126/science.1150195.
- Grimmond, S. 2007. “Urbanization and Global Environmental Change: Local Effects of Urban Warming.” The Geographical Journal 173: 83-88.
- Hewitt, V., E. Mackres, and K. Shickman (2014). Cool Policies for Cool Cities: Best Practices for Mitigating Urban Heat Islands in North American Cities. American Council for an Energy-Efficient Economy and Global Cool Cities Alliance, Report Number U1405.
- JMD (2017). Jordan Meteorological Department. URL: http://jometeo.gov.jo/(accessed on 10 January 2017).
- Kawashima, S., T. Ishida, M. Minomura, and T. Miwa. 2000. “Relations between Surface Temperature and Air Temperature on a Local Scale during Winter Nights.” Journal of Applied Meteorology 39: 1570–1579. doi:10.1175/1520-0450(2000)039<1570:RBSTAA>2.0.CO;2.
- Kurucu, Y., and N. K. Chiristina. 2008. “Monitoring the Impacts of Urbanization and Industrialization on the Agricultural Land and Environment of the Torbali, Izmir Region, Turkey.” Environmental Monitoring and Assessment 136: 289–297. doi:10.1007/s10661-007-9684-4.
- Lazzarini, M., P. R. Marpu, and H. Ghedira. 2013. “Temperature-Land Cover Interactions: The Inversion of Urban Heat Island Phenomenon in Desert City Areas.” Remote Sensing of Environment 130: 136–152. doi:10.1016/j.rse.2012.11.007.
- Lee, S. Y., R. J. K. Dunn, R. A. Young, R. M. Connolly, P. E. R. Dale, R. Dehayr, C. J. Lemckert, et al. 2006. “Impact of Urbanization on Coastal Wetland Structure and Function.” Austral Ecology 31: 149–163. doi:10.1111/aec.2006.31.issue-2.
- Lin, X., W. Zhang, Y. Huang, W. Sun, P. Han, L. Yu, and F. Sun. 2016. “Empirical Estimation of Near-Surface Air Temperature in China from MODIS LST Data by considering Physiographic Features.” Remote Sensing 8: 629. doi:10.3390/rs8080629.
- Liu, L., and Y. Zhang. 2011. “Urban Heat Island Analysis Using the Landsat TM Data and ASTER Data: A Case Study in Hong Kong.” Remote Sensing 3: 1535–1552. doi:10.3390/rs3071535.
- Lo, C. P., and D. A. Quattrochi. 2003. “Land-Use and Land-Cover Change, Urban Heat Island, Phenomenon, and Health Implications: A Remote Sensing Approach.” Photogrammetric Engineering and Remote Sensing 69: 1053–1063. doi:10.14358/PERS.69.9.1053.
- McKinney, M. L. 2008. “Effects of Urbanization on Species Richness: A Review of Plants and Animals.” Urban Ecosystems 11: 161–176. doi:10.1007/s11252-007-0045-4.
- Moore, M., P. Gould, and B. S. Keary. 2003. “Global Urbanization and Impact on Health.” International Journal of Hygiene and Environmental Health 206: 269–278. doi:10.1078/1438-4639-00223.
- Moran, M. S., R. D. Jackson, P. N. Slater, and P. M. Teillet. 1992. “Evaluation of Simplified Procedures for Retrieval of Land Surface Reflectance Factors from Satellite Sensor Output.” Remote Sensing of Environment 41: 169–184. doi:10.1016/0034-4257(92)90076-V.
- NASA (2017). Measuring Vegetation (NDVI and EVI). URL: http://earthobservatory.nasa.gov/Features/MeasuringVegetation/measuring_vegetation_1.php (accessed on 12 January 2017).
- Nichole, J. E. 1996. “High-Resolution Surface Temperature Patterns Related to Urban Morphology in A Tropical City: A Satellite-Based Study.” Journal of Applied Meteorology 35: 135–146. doi:10.1175/1520-0450(1996)035<0135:HRSTPR>2.0.CO;2.
- Pena, M. A. 2008. “Relationships between Remotely Sensed Surface Parameters Associated with the Urban Heat Sink Formation in Santiago, Chile.” International Journal of Remote Sensing 29: 4385–4404. doi:10.1080/01431160801908137.
- Rouse, J. W., R. H. Haas, J. A. Schell, and D. W. Deering (1974). “Monitoring Vegetation Systems in the Great Plains with ERTS.” Third Earth Resources Technology Satellite-1 Symposium, Volume I: Technical Presentations, Section A, NASA SP-351, 309–317.
- Silleos, N. G., T. K. Alexandridis, I. Z. Gitas, and K. Perakis. 2006. “Vegetation Indices: Advances Made in Biomass Estimation and Vegetation Monitoring in the Last 30 Years.” Geocarto International 21: 21–28. doi:10.1080/10106040608542399.
- Sobrino, J. A., J. C. Jimenez-Munoz, and L. Paolini. 2004. “Land Surface Temperature Retrieval from LANDSAT TM 5.” Remote Sensing of Environment 90: 434–440. doi:10.1016/j.rse.2004.02.003.
- Stathopoulou, M., C. Cartalis, and M. Petrakis. 2007. “Integrating Corine Land Cover Data and Landsat TM for Surface Emissivity Definition: Application to the Urban Area of Athens, Greece.” International Journal of Remote Sensing 28: 3291–3304. doi:10.1080/01431160600993421.
- UN (2014). “World Urbanization Prospects: The 2014 Revision, Highlights.” ST/ESA/SER.A/352.
- UN (2015). “World Population Prospects: The 2015 Revision, Key Findings and Advance Tables”. United Nations, Department of Economic and Social Affairs, Population Division, Working Paper No. ESA/P/WP.241.
- UN-Habitat (2015). “Integrating Climate Change into City Development Strategies (CDS), Climate Change and Strategic Planning.” United Nations Human Settlements Programme (UN-Habitat), HS Number: HS/075/15E.
- USGS (2016a). EarthExplorer. United States Geological Survey. URL: http://earthexplorer.usgs.gov/(accessed on 8 August 2016).
- USGS (2016b). Landsat 5 History. United States Geological Survey. URL: https://landsat.usgs.gov/landsat-5-history (accessed on 30 December 2016).
- USGS (2016c). Landsat 8 History. United States Geological Survey. URL: https://landsat.usgs.gov/landsat-8-history (accessed on 30 December 2016).
- USGS. 2016d. Landsat 8 (L8) Data Users Handbook. LSDS-1574. Version 2.0. 29 March 2016. Department of the Interior and United States Geological Survey. Sioux Falls, South Dakota: .EROS.
- USGS (2017).Landsat Missions. United States Geological Survey. URL: https://landsat.usgs.gov/(accessed on 20 January 2017).
- Van, T. T., and H. D. X. Bao. 2010. “Study of the Impact of Urban Development on Surface Temperature Using Remote Sensing in Ho Chi Minh City, Northern Vietnam.” Geographical Research 48: 86–96. doi:10.1111/j.1745-5871.2009.00607.x.
- Wang, H., Y. Zhang, J. Y. Tsou, and Y. Li. 2017. “Surface Urban Heat Island Analysis of Shanghai (China) Based on the Change of Land Use and Land Cover.” Sustainability 9: 1538. doi:10.3390/su9091538.
- Weng, Q., D. Lu, and J. Schubring. 2004. “Estimation of Land Surface Temperature-Vegetation Abundance Relationship for Urban Heat Island Studies.” Remote Sensing of Environment 89: 467–483. doi:10.1016/j.rse.2003.11.005.
- Wulder, M. A., J. C. White, T. R. Loveland, C. E. Woodcock, A. S. Belward, W. B. Cohen, E. A. Fosnight, J. Shaw, J. G. Masek, and D. P. Roy. 2016. “The Global Landsat Archive: Status, Consolidation, and Direction.” Remote Sensing of Environment 185: 271–283. doi:10.1016/j.rse.2015.11.032.
- Yuan, F., and M. E. Bauer. 2007. “Comparison of Impervious Surface Area and Normalized Difference Vegetation Index as Indicators of Surface Urban Heat Island Effects in Landsat Imagery.” Remote Sensing of Environment 106: 375–386. doi:10.1016/j.rse.2006.09.003.
- Yue, W., J. Xu, W. Tan, and L. Xu. 2007. “The Relationship between Land Surface Temperature and NDVI with Remote Sensing: Application to Shanghai Landsat 7 ETM+ Data.” International Journal of Remote Sensing 28: 3205–3226. doi:10.1080/01431160500306906.
- Zareie, S., H. Khosravi, A. Nasiri, and M. Dastorani. 2016. “Using Landsat Thematic Mapper (TM) Sensor to Detect Change in Land Surface Temperature in Relation to Land Use Change in Yazd, Iran.” Solid Earth 7: 1551–1564. doi:10.5194/se-7-1551-2016.
- Zhou, W., Y. Qian, X. Li, W. Li, and L. Han. 2014. “Relationships between Land Cover and the Surface Urban Heat Island: Seasonal Variability and Effects of Spatial and Thematic Resolution of Land Cover Data on Predicting Land Surface Temperatures.” Landscape Ecology 29: 153–167. doi:10.1007/s10980-013-9950-5.