
 ?Mathematical formulae have been encoded as MathML and are displayed in this HTML version using MathJax in order to improve their display. Uncheck the box to turn MathJax off. This feature requires Javascript. Click on a formula to zoom.
ABSTRACT
The search for suitable marine areas is a prerequisite at an early stage of any offshore renewable energy system project. This paper introduces a methodological framework for identifying the maritime areas the most appropriate to implement an offshore wind turbine farm in the Hong Kong bay. The framework is based on the combined use of Multi-Criteria Decision Analysis (MCDA) and Geographical Information Systems (GIS). At the first stage of the analysis, unsuitable areas for the deployment of an offshore wind turbine have been first identified. At the second stage of the analysis, eligible marine areas have been ranked using a MCDA and different scenarios. Finally, a cost analysis has been performed to refine the whole approach as well as a comparison to previous studies in the Hong Kong bay.
1. Introduction
Renewable energy is one of the greatest challenges for developing countries. With an estimated population of 1.404 billion people, an important objective for China is to develop clean and sustainable ways to produce energy. In particular, marine renewable energy like offshore wind turbines has become a subject of increasing interest in the recent years. The main principle of wind turbines is to capture wind strength and convert it into electricity. The objective of such installations is to be as productive as possible, while minimizing additional costs, as well as environmental and social impacts. An important issue before planning the development and implementation of an offshore wind turbine farm is to search for the most appropriate technologies and some potential sites for implementing them.
We consider the issue of locating the most suitable areas for the deployment of offshore wind turbines as a geographical and multi-criteria decision problem. The idea behind this approach is to provide the maximum flexibility at the decision level in order to favour different scenarios and priorities. In fact, the maritime domain has its own constraints due to a combination of anthropic and environmental issues (Douvere Citation2008). For the deployment of an offshore wind turbine farm a series of human-based and natural constraints should be considered such as human activity (e.g., fishing areas, maritime navigation routes), and physical parameters (e.g., wind, water depth). The aim of this paper is to develop a decision-aided system whose objective is to estimate some suitable locations for offshore wind turbines in the Honk Kong bay by considering different levels of such constraints and combining GIS with MCDA. The search for an adequate zone for an offshore wind turbines installation generally starts by the identification of some possible regions at the macro level according to a series of technical criteria such as wind resource, restricted constraints (e.g., maximal depth, telecommunication cable, distance to coast, main ship lane or military area) and constraint subject to discussion (e;g., recreational area, reserve and conservation area, presence of particular species, fishing zone, distance to port) . In a second step, different solutions are studied at the micro level and by taking into account different parameters such as technical feasibility and cost evaluation according to different turbine types. This work has been divided in three steps:
First, environmental, technical and socio-economic data from the Hong Kong bay have been gathered, geo-referenced and processed.
A restriction area based on several constraints, and where there is no suitable option to deploy wind turbines, has been defined.
GIS and MCDA have been combined with a cost-based analysis to identify some potential locations for an offshore wind turbine farm. The objective is to highlight several suitable areas.
The results of this methodological and experimental framework strongly depend on the criteria chosen, the data, the characteristic of the wind turbines and on the specification of such deployment. Note that this experimental setup can be overall considered as a decision-aided system, and that is also dependent on the user needs and their own constraints. The rest of the paper is organized as follows. Section 2 introduces the scientific and technological backgrounds while Section 3 develops the GIS-based analysis. Section 4 develops the case study in the Hong Kong Bay while Section 5 comparison to previous studies. Finally, Section 6 gives the conclusions and briefly outlines further work.
2. Technological backgrounds
The world production of energy is essentially and currently oil- and coal-based but world production of renewable energy grows every year, even if hydro and solid bio-fuels remain the most used forms of renewable energy (International Energy Agency Citation2016). Indeed, renewable energy has become one of the most important challenges of this century because of global warming, and as the supply of fossil fuels could be exhausted within a hundred years (Multon Citation2013). In the context of Hong Kong, offshore wind energy appears as a potential solution worth being studied as a few areas are first available on ground, and that the bay might offer some potential solutions with enough regular wind over long periods of time. A large number of previous works have previously studied the potential of wind energy for resource assessment in Hong Kong (Li Citation2000; Lu, Yang, and Burnett Citation2002; Gao and Hongxing Citation2014), or turbine optimization (Gao, Yang, and Lin Citation2014). However, and to the best of our knowledge, none of these works applies a marine spatial planning approach that takes into account both user conflicts and environmental constraints.
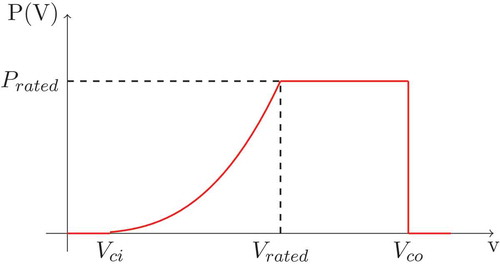
In order to produce energy, a wind turbine needs a minimal and regular wind speed, called cut-in speed. When wind increases, energy production increases proportionally to the cube of wind speed. For a wind speed called rated speed, the generator reaches its maximal power (i.e., rated power). When wind speed is too high, during a storm for example, wind turbines have to be stopped, this wind speed is called cut-off speed. Between rated speed and cut-off speed, the energy production is constant. For the deployment of an offshore wind farm, wind has to be mostly between the rated speed and the cut-off speed, and at least superior to the cut-in speed. Wind turbines also have to be connected via submarine cables and an offshore transformer platform in some cases.
The turbine characteristics allow to calculate the power generated following the equation given below:
where is the air density, A the wind turbine swept area,
the cut-in speed,
the rated speed,
the cut off speed,
the rated power and W the wind speed, and
the power coefficient.
The power of a turbine depends on the wind speed, swept area of the turbine and air density which depends on the altitude (). This is the reason why on the one hand the wind speed is an important parameter and on the other hand the characteristics of the turbine are also crucial (i.e., its swept area and its hub height).
Figure 1. Turbine power versus wind speed.
Overall, we consider three turbine models. The offshore wind farm SL 5000/128 from the Chinese company Sinovel, the 6.2M152 and the SWP-3.6–120 from the German companies Siemens and Senvion. These turbines have been chosen because of their relative difference of characteristic in order to illustrate different developer solution in our approach. The turbine characteristics are summarized in . In the farm, we suppose that turbines are separated from a distance of minimum five times their diameter to avoid turbulence.
Table 1. Wind turbine properties (https://en.wind-turbine-models.com/).
3. GIS method and analysis
3.1. Methodological background
Different methods such as the ones involving an Environmental Impact Assessment have been applied to define some possible locations for a wind farm (Copping et al. Citation2014). By using a pairwise comparison explained below, we are given the option of selecting and pairwise scaling the criteria selected. This approach has also the advantage of flexibility and relative facility of use.
This method is used to determine the weight of a criteria for the multi-criteria decision analysis. It stems from the Analytic Hierarchy Process (AHP), that is, a decision-making framework (Saaty Citation2013). By using a pairwise comparison, we can select what criteria is more important than another, and the weights of every criteria are chosen accordingly.
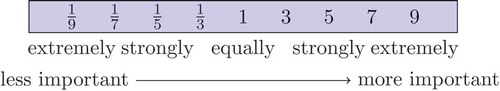
The first step of this method is to compare the different criteria pairwise with index values that range from 1 to 9. When two criteria have the same importance, their index value is 1. When the first one is much more important than the second one, the index is 9 and so on. All graduations are possible in between. On the contrary, if the first one is far less important than the second one, their index value is 1/9, as shown in .
Figure 2. Pairwise comparison scale (Eastman Citation1999).
Valued by this index approach a comparison matrix A is derived with diagonal values given to the unit, the right upper half of the matrix is filled until each criterion has been compared to every other one. For consistency reasons, the lower left half of the matrix is thus filled with the corresponding fractions. A is a n x n matrix where n is the number of criteria. In the matrix A the following equations are respected: and
(Saaty Citation1980)
Once the matrix A is built, the normalized pairwise comparison matrix is derived by making equal to 1 the sum of the entries on each column, each value
of the matrix
is computed as follows:
Finally, the criteria weight vector w (e.g., an n-dimensional column vector) is built by averaging the entries on each row of as follows:
This method is applied to define the weight of each criteria in order to further process them within the raster-based analysis. As all layers should be processed at a given common scale of analysis, raster layers are aggregated when necessary by appropriate aggregation operations (e.g., Sum, Min). Not only layers are aggregated to provide a common grid reference at a given level of scale, but layer values at the pixel level are normalized to facilitate cross-comparison across different layers. The advantage of such a method is to simplify the calculation without losing precision, and to facilitate multi-layer cross-comparison.
The main principle behind MCDA is to evaluate several conflicting criteria in order to take the most appropriate decision. This method is often used for problems with multiple criteria which are difficult to cross-evaluate a priori. The principle behind is to weight the different criteria according to the impact they will have on the result, and compare all of those criteria in order to reach the final decision.
The goal is to evaluate the Hong Kong bay potential area for the development of offshore wind turbine technologies. MCDA permits to compare several factors like wind, water depth, distance to shore and then to identify some possible areas for an offshore wind farm according to the predefined criteria (Maslov et al. Citation2014). The software used for this study is QGIS (Quantum Geographical Information System). By using an open-source software, another objective of our study is to make the proof that an open-GIS can be combined with a MCDA analysis, and this as an overall accessible method.
3.1.1. Criteria identification
First, several maps corresponding to some predefined criteria have been created, like the socio-economic one, by processing a series of input datasets. Then, all the input maps have been processed and a final evaluation map has been generated. This method is also effective and visual as it permits to integrate a large number of criteria to the analysis. An important component of the method is also to define the different criteria in a quantitative form that can be implemented within the supporting software.
In order to first identify the restricted area a series of buffers have been defined to fulfil some distance constraints (e.g., 200 meters from any submarine cable). Moreover, we also assume that the distance from the shore to the farm has to be of at least 1 km to avoid visual and noise disturbance from the coast and to not entail tourism activities. Moreover, the water depth has to be at 40 meters maximum. The buffer range order have been based on previous studies (Schillings et al. Citation2012; Kim, Park, and Maeng Citation2016; Möller Citation2011) to select no go areas, of course in a context of the decision-aid process the values needs to be taken with the cooperation of local stakeholders and specialists. Finally, the farm has to be at a minimum distance of 1 km from every fauna or flora zone to not disturb them. summarizes all data buffered using the data available for the example of the Hong Kong Bay. For the purpose of this preliminary decision-aided analysis, the precision of the buffer is considered as sufficient enough to provide a valuable input to the MCDA analysis.
Table 2. Buffer zones.
3.2. GIS analysis
The analysis is made of two parts. For the first part, the areas where a wind turbine cannot be located are eliminated, and for the second one, the possible locations among the areas remaining are derived.
3.2.1. Restricted area derivation
In order to define suitable locations for the deployment of a renewable energy system, a restricted area is created. In such an area, it is considered as impossible to deploy such system because of human activities, natural reserves or protected areas. Defining such area permits, by elimination, to define an area of available zones for an installation of a renewable energy system, which will be further analysed by multi-criteria analysis. This area is built from the buffers of the layers corresponding to criteria that define areas where a wind farm cannot be implemented.
3.2.2. MCDA data processing
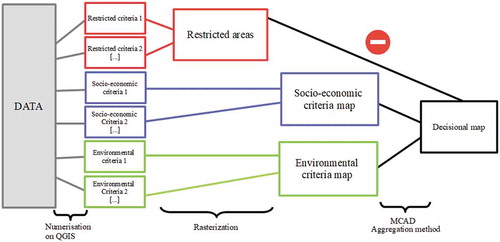
Geographical data have to be geo-referenced, rasterized and aggregated. Then all criteria are weighted using a pairwise comparison. Before processing the MCDA, vector datasets have to be converted to raster format with an appropriate resolution. These Vector layers are converted into a raster layer where Boolean values reflect the presence or not of the input vector data. The main principle of the approach is as follows: positive versus negative locations are valued by respective Boolean values (i.e., 1 and 0). Then distances to positive locations are materialized by the application of a buffer function. Next, the maps generated for each criteria are combined in order to deliver a suitability map. summarizes the main steps of this approach. Indeed, the generated suitability map has been correlated to the restricted areas thus providing a potential map that will be processed by the MCDA analysis.
Figure 3. Applied method the deployment of wind turbines.
The MCDA analysis is made according to a given set of criteria weights that elect some user constraints and wishes according to the different environmental and socio-economical factors.
4. GIS analysis applied to the Hong Kong bay
Site selection involves a choice based on different evaluation criteria, in case of offshore wind turbine the important criteria can be categorized as follow (adapted from (Mostashari Citation2011)):
Environmental issues: environmental impact (e.g., energy’s damage on the quality of the environment), noise impact, proximity to migratory paths for birds or other species, distance to protected area can be used as criteria (Vagiona and Karanikolas Citation2012), bird habitat and fish habitat in (Mekonnen and Gorsevski Citation2015).
Sea users issues: navigation and aviation pathx (e.g., distance to ship routes (Vagiona and Karanikolas Citation2012), fishery activity (Mekonnen and Gorsevski Citation2015)), aesthetic criteria (e.g., distance to shore (Mekonnen and Gorsevski Citation2015)).
Economics: proximity to facilities (e.g., power transmission grid, port for installation and maintenance and indirectly distance to shore (Vagiona and Karanikolas Citation2012), utilities (Mekonnen and Gorsevski Citation2015)), commercial feasibility, local economic benefit (Fetanat and Khorasanine-Jad Citation2015).
Technical resources: wind resources availability, physical feasibility (e;g., water depth, seabed nature) (Fetanat and Khorasanine-Jad Citation2015).
4.1. Geographical data
Several geographical data sources related to environmental, social, economical and technical factors have been considered by our study. The different data sources used are introduced in the next sub-sections.
4.1.1. Environmental data
Environment data is indeed an important dimension of our study due to the necessary protection constraints that should be taken into account. A suitable area has to be surely windy, but with minimal impact on birds or other wild animals. In particular, The World Wildlife Fund (WWF) databases provide a series of useful input data to take into account such sensitive fauna. Those data also concern flora or reef, and very important the legally protected areas. Overall, input data come from the WWF, the Hong Kong Agriculture Fisheries and Conservation Department (AFCD), the European Center for Medium-Range Weather Forecast (ECMWF) and the Environmental Resources Management (ERM) of Hong Kong. The commercial fisheries resources, protected areas, marine reserves, the fauna and the flora are represented with vector layers. Next, wind and water depth of the Hong Kong bay are better represented as continuous variables with raster layers.
4.1.2. Socio-economic data
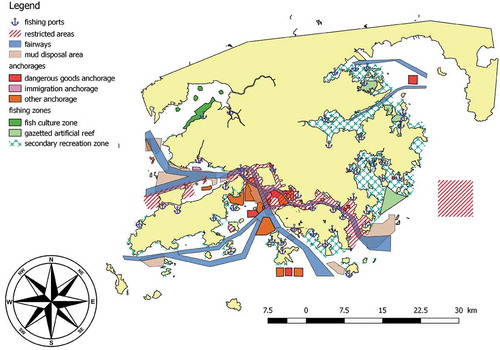
Socio-economical data on human activities concern for example maritime corridors, fishing zones or some existing restricted areas (). Those data come from the Hong Kong ERM, Hong Kong AFCD, the Hong Kong Aeronautical Information Services (AIP). The anchorages positions, fishing zones, restricted areas, fairways positions, mud disposal areas, recreation zones and ports positions are represented using vector layers. An additional raster layer that represents the density of fishing vessels in every area of Hong Kong is also integrated.
Figure 4. Socio-economic data map.
4.1.3. Technical data
In fact, wind turbines have as much as possible to be close to an electric land-based grid or in a zone where the water is not too depth. Those data come from the Hong Kong ERM. This includes submarine cables positions, power stations map and transmission network which are represented with a vector-based map. summarizes all the input data, including their type and whether they are positive factors or constraints to take into account. (Szurek, Blachowski, and Nowacka Citation2014)
Table 3. Geographical data formats.
All the input data have been processed within QGIS (e.g, ) on a reference map of the Hong Kong area and coastline. In the Hong Kong Bay, the geodesy used is Hong Kong 1980 Grid System.
4.2. MCDA application
Before processing the MCDA application, all of the vector datasets have been converted to raster format with a granularity of 10m and then reclassified as summarized in . A 10m pixel resolution has been chosen as a valuable approximation of the marine environment characteristics for the raster-based analysis. The respective vector datasets that represent some individual criteria are identified as MCDA inputs. Therefore, the aggregation method is applied: every layer is classified in 6 values and generated ()
Table 4. Raste-based criteria.
The final stage was to weight all criteria in order to highlight the most suitable zones for the deployment of offshore turbines. In order to do so, each criteria is weighted with a pairwise comparison (), and that permits to find the pairwise comparison matrix M and the weight of each criteria as shown in . Criteria are ranked as follows, with a priority given to the costs of the installation, profitability and maintenance of the wind farm, but also including the respect of the environment (even if this criteria is already considered by many of the buffers applied to the incoming constraints-based data). Indeed, the different ranking can be adapted and valued differently depending on the needs of every study. The options and choices made appear to be the most balanced and appropriate between costs, profitability and environmental protection.
Table 5. Weighted criteria.
An important criteria is the water depth (A), as indeed areas with small deeps avoid excessive costs during the installation.
Wind (B) is another important parameter to make sure the farm will be efficient enough.
Distance from electric grid (C) in order to install the shortest submarine cable as possible.
Distance from the shore (D) in order to avoid as much as possible noise and visual pollution.
Distance from a port (E) comes next, because of the installation and maintenance of the farm, which permits to decrease the project installation cost.
Fishing vessel density (F) is an important socio-economical criteria
Other criteria to take into account are the distance from the fauna and flora (G) and distance from recreation zone (H), which are not considered as the most important ones, but the farm needs to be as far as possible from them in order to not disturb their activities (environment protection is already assured by the different buffers applied).
In order to derive the weight for each criteria, a Python program has been used. It permits, with the comparison matrix in entrance, to calculate the weight of each criteria and then to apply pairwise comparison method. All the weights given are resumed in .
Table 6. Weighted data.
summarizes all the data applied by the raster algebra derivation. Prior to the pairwise comparison, all raster data have been normalized. Regarding the example of the aggregation rules applied to the distance to ports, the principle behind is to search for the areas that have to be the nearest possible from the ports.
5. Area selection
5.1. Refining the solution with a cost-based analysis
All vectors have been rasterized, aggregated and weighted in order to highlight the most suitable zones for the deployment of offshore turbines in the Hong Kong bay. The derived figure () shows that the East and the North-West of the bay seems to be the most suitable areas. In the East of the bay, the influence of the water depth can be perfectly seen, drawing the border of the two red zones. The other criteria are also visible, but rather depending on their respective weights. In fact, the water depth is the criteria with the highest weight, so this being the reason for identifying it when visualizing the output map.
Figure 5. Final decision map for the HK special administrative region.
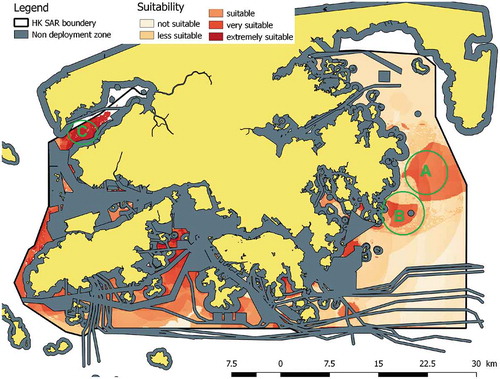
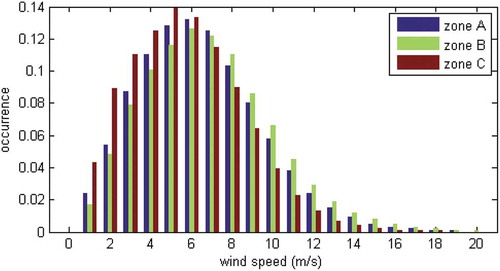
Two suitable zones appear in the East of the Hong Kong bay, and another one in the West (). Overall, three zones seem to be very suitable as they are large enough to welcome a wind farm and are highlighted as the reddest zones. The three zones are: A (North-East), B (South-East) and C (West). compares the wind in the three zones. Note that zone C is relatively small and can only welcome a maximum of 15 km2 wind farm.
Figure 6. Wind characteristics of the three zones.
summarizes the cost of the installation of the wind farm (Hong and Bernd Citation2011) while the cost for each zone. The cost is in €/MW and so does not depend on the model of the turbine this being the reason why the estimated cost for each zone do not consider the model of the turbines. Different types of foundations are possible: monopile, tripod, gravity base and suction caisson foundation depending on the depth. According to the range values of water depth given, the focus is on a monopile foundation solution. An alternative is to take into account gravity but the environmental impact of this solution required some additional studies. Such monopile solution is commonly adopted in various offshore wind farm projects under similar depth conditions. Moreover, construction time is shorter than for the other technologies (Lau Citation2011).
Table 7. Cost factors of an offshore wind farm.
Table 8. Estimated cost of a wind farm in each zone.
These three results are given in €per MW. In order to find the cost of the wind farm in each zone, an approximation is to time the nominal production of each turbine by the number of turbines in the farm. It then appears that the derived cost is almost the same for the A and B zones, this being coherent as they are located in the same area. However, a lower price appears for the C zone.
5.2. Deployment of the wind turbines
Two final criteria have an important impact when comparing the two areas: the cost of the farm installation and the energy it will produce. Ratios have been compared in order to identify the most cost-effective zone and all the comparison between the zones and depending on the turbines’ model are summarized in .
Table 9. Comparison between the zone according to the turbine models with cost in M/turbine, energy in MWh/turbine and ratio in €/MWh/turbine.
The energy production has been estimated over a period of 20 years according to the model of turbine and wind data in each area. It has been previously mentioned that the costs for zone A and B were roughly the same. However, zone B shows more occurrences in high wind speeds. That explains why the most profitable zone is the B zone for every model. It can be also mentioned that the turbines SWP3.6 and SL5000 are almost equivalent. Zone C is a less windy area, even with a lower installation cost, the cost of energy tends to be higher than turbine deployment in zone A. the most suitable turbine for this zone is the big one. But the turbine number is limited due to the small area available. The model SWP-3.6–120 seems to be the most profitable turbine as it has the lower price per generated MW. But the case of zone B and C, the 6.2M152 is more suitable. Finally, MCDA and cost analysis permit to find the most appropriate suitable zones to deploy an offshore wind farm and permits to choose which zone with which model is the most profitable one.
5.3. Site selection with environmental constraints reinforcement
In order to evaluate the efficiency of the MCDA method, let us change the weighting, by focusing on the environment instead of the coast of the farm. A new matrix M’ is so created and criteria have new weights showed in .
Table 10. Weighted data for the raster calculator with other results.
With A the fauna and flora, B the distance from the shore, C wind, D fishing vessel density, E recreation zone, F depth, G distance from a port and H distance from electrical grid.
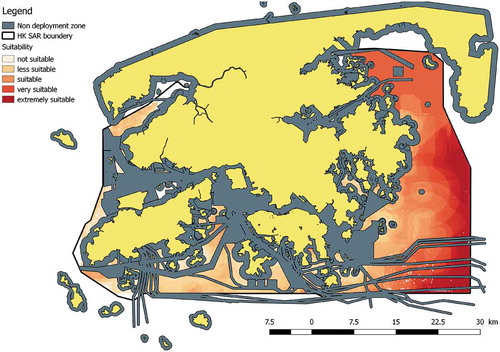
After processing the layers with the new weights, a different resulting map is shown in . The results are indeed slightly different than in the previous decision map, as suitable areas should be as far as possible from the shore, fauna and flora. In fact, the environment has been the main focus instead of the economical dimension. This explains the fact that the most suitable zones are located at the limit of the SAR boundary to avoid disturbing the fauna and flora and to minimize visual pollution. We can also remark that with these new constraint preferences the site C is far from being a suitable area.
Figure 7. Final decision map with different weights.
6. Comparison to previous studies
Several previous studies have been conducted in the Hong Kong bay for the deployment of offshore turbines. summarizes the different studies and highlights the different chosen zones.
Table 11. Comparison to previous studies.
Figure 8. Emerging zones according to different studies.
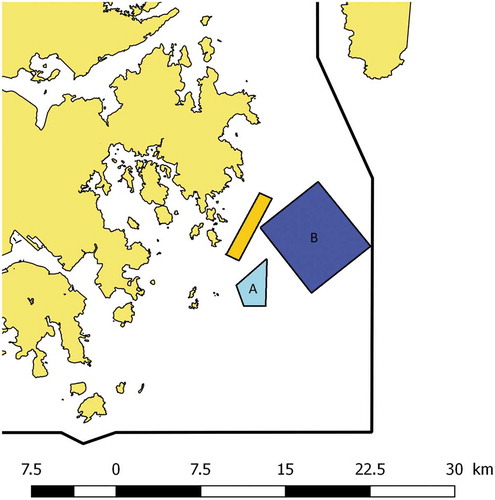
In the first study, related environmental, physical and social constraints have been considered in order to highlight the most appropriate location for the wind farm and in order to minimize potential environmental impacts on sensitive areas and minimize the maintenance. But it appears that the suggested farm is close to the shore and also to animals natural habitat. Moreover, visual pollution is not considered this being a criteria considered by our study. Moreover, our study is flexible enough to refine the criteria considered according to different points of view, but converges to the results highlighted by this previous study when the relative importance of the different criteria chosen will be close enough. In the second study, the considered region of the study is much large, this generating many implementation possibilities, the main criteria being the wind efficiency. However, according to our own incoming data, it appears that wind power is more important southeastern to the chosen zone in this study.
These two studies have defined a non-deployment zone first but not using similar criteria. They have not considered for instance the submarine cables. They also highlight a zone according to their priority, the environment for one and the wind efficiency for the other, but without a multi-criteria analysis. A MCAD allows to take into account all the criteria needed which increase the precision of the location of the chosen zone and the flexibility given to the analysis.
Overall, the three chosen zones are located in the same area. The chosen zone depends on the method applied, and when considering a MCDA approach, on the criteria and their respective weights. This is the reason why different zones are possible, but they are all in the same area, which is cohesive because whatever the method used, the similar requirements are taken into account. This applies at the exception of the Western zone, because all criteria but the wind were respected; thus, it was a very suitable area according to the MCDA but it was not finally the most appropriate one. Overall a possible location for offshore turbine wind farm has been identified at 7.5 km East of the Sai Kung peninsula, using the 6.2M152 turbine. This area seems to approximately correlate with the one proposed in the report (Wind prospect Citation2009).
The cost-based analysis shows that the cost of the energy depends on the turbines selected for the project. But it appears that the biggest turbine may provide the better cost. When priority is given to the environment, cost-based criteria (e.g., water depth, distance) are relegated to the second plan. It then appears in that scenario that the suitable areas are then located at the Hong Kong boundaries. Further investigations as the number of turbine according to a budget or a minimal energy production, grid connection, optimal wind turbine layout configuration are amongst the factors still to explore.
In order to improve the MCDA approach, additional data are surely needed particularly regarding the incoming data precision and quality. While the MCDA approach highlights several zones according to the predefined criteria, additional verification are needed to select the most appropriate area and further cost-based analysis. In fact, our MCDA-based approach should be considered as a preliminary analysis that should identify some possible options that favour further analysis.
This preliminary method should be also completed by an evaluation of some additional parameters for instance to determine the topology of the farm. An additional precise exploration of the subsoil in the area is also an important factor to consider, in order to refine the installation cost and impact on the environment. Finally, a cost analysis based on the distance between the Hong Kong bay and the wind turbine factory, as well as another one for the installation of the connection to the grid system and maintenance structure, will give some complementary important information on the installation cost of the wind farm.
7. Conclusion
The aim of this study was to define some suitable areas for the deployment of an offshore wind farm in the bay of Hong Kong. Nowadays, there is a will from the Hong Kong administration to develop its own renewable energy production, and offshore wind farms may contribute to the solution (Lo Citation2017). The research developed in this paper has applied a MCDA method in combination with a GIS-based approach. In order to highlight such possible areas, the first step was to eliminate unsuitable zones due to some environmental or socio-economical constraints. The MCDA approach highlights a series of most suitable zones according to some weighted criteria pairwise, and predefined by the user. Finally, a cost and profitability study refines the choice of a wind farm location. This location has been evaluated according to the distance to the land for electrical network and connection to submarine cables.
This study can be considered as an approximation that deserves additional refinement to, for example, integrate additional data, but it can be considered as valuable enough to identify some potential zones for further exploration. The main principle is not to provide a definitive solution but rather to provide different options according to some preferences when considering both anthropic and environmental criteria. The whole framework is extensible so additional criteria can be taken into account such as seabed properties and additional socioeconomic factors. The method used to define this farm could also be adapted for other studies such as the deployment of other renewable energy systems, offshore or in land, by gathering the relevant data and by weighing the criteria appropriately.
Disclosure statement
No potential conflict of interest was reported by the authors.
References
- Copping, A., H. Battey, J. Brown-Saracino, M. Massaua, and C. Smith. 2014. “An International Assessment of the Environmental Effects of Marine Energy Development.” Ocean & Coastal Management 99: 3–13. doi:10.1016/j.ocecoaman.2014.04.002.
- Douvere, F. 2008. “The Importance of Marine Spatial Planning in Advancing Ecosystem-Based Sea Use Management.” Marine Policy 32 (5): 762–771. doi:10.1016/j.marpol.2008.03.021.
- Eastman, J. R. 1999. “Multi-Criteria Evaluation and GIS.” Geographical Information Systems 1 (1): 493–502.
- ERM (Hong-Kong Environmental Ressources Management Hong Kong). 2006. “Liquefied Natural Gas (LNG) Receiving Terminal and Associated Facilities- Environmental Impact Assessment Report.”
- Fetanat, A., and E. Khorasanine-Jad. 2015. “A Novel Hybrid MCDM Approach for Offshore Wind Farm Site Selection: A Case Study of Iran.” Ocean & Coastal Management 109: 17–28. doi:10.1016/j.ocecoaman.2015.02.005.
- Gao, X., and Y. Hongxing. August 2014. “Investigation into the Optimal Layout Patterns for a Hong Kong Wind Farm.”
- Gao, X., H. Yang, and L. Lin. 2014. “Study on Offshore Wind Power Potential and Wind Farm Optimization in Hong Kong.” Applied Energy 130: 519–531. doi:10.1016/j.apenergy.2014.02.070.
- Hong, L., and M. Bernd. 2011. “Offshore Wind Energy Potential in China: Under Technical, Spatial and Economic Constraints.” Energy 36 (7): 4482–4491. doi:10.1016/j.energy.2011.03.071.
- International Energy Agency. 2016. “World energy outlook 2016” (International Energy Agency, Paris, 2016).
- Kim, T., J.-I. Park, and J. Maeng. 2016. “Offshore Wind Farm Site Selection Study around Jeju Island, South Korea.” Renewable Energy 94: 619–628. doi:10.1016/j.renene.2016.03.083.
- Lau, F. F. H. 2011. “Development of Renewable Energy Projects in Hong Kong.” In Symposium on Electrical and Mechanical Safety & energy Efficiency
- Li, G. 2000. “Feasibility of Large Scale Offshore Wind Power for Hong Kong – A Preliminary Study.” Renewable Energy 21 (3–4): 387–402. doi:10.1016/S0960-1481(00)00038-0.
- Lo, K. 2017. “Renewable Energy Development in Hong Kong: Potential, Progress, and Barriers.” Current Sustainable/Renewable Energy Reports 4 (2): 50–55. doi:10.1007/s40518-017-0068-2.
- Lu, L., H. Yang, and J. Burnett. 2002. “Investigation on Wind Power Potential on Hong Kong Islands – An Analysis of Wind Power and Wind Turbine Characteristics.” Renewable Energy 27 (1): 1–12. doi:10.1016/S0960-1481(01)00164-1.
- Maslov, N., D. Brosset, C. Claramunt, and J.-F. Charpentier. 2014. “A Geographical-Based Multi-Criteria Approach for Marine Energy Farm Planning.” ISPRS International Journal of Geo-Information 3 (2): 781–799. doi:10.3390/ijgi3020781.
- Mekonnen, A. D., and P. V. Gorsevski. 2015. “A Web-Based Participatory GIS (PGIS) for Offshore Wind Farm Suitability within Lake Erie, Ohio.” Renewable and Sustainable Energy Reviews 41: 162–177. doi:10.1016/j.rser.2014.08.030.
- Möller, B. 2011. “Continuous Spatial Modelling to Analyse Planning and Economic Consequences of Offshore Wind Energy.” Energy Policy 39 (2): 511–517. doi:10.1016/j.enpol.2010.10.031.
- Mostashari, A. 2011. Collaborative Modeling and Decision-Making for Complex Energy Systems. Singapore: World Scientific.
- Multon, B. 2013. Marine Renewable Energy Handbook. London, UK: John Wiley & Sons.
- Saaty, T. 1980. “The Analytic Hierarchy Process, NY.” New York, USA: McGraw-Hill.
- Saaty, T. L. 2013. “Analytic Hierarchy Process.” In Gass, Saul I., Fu, Michael C. (Eds.)., Encyclopedia of Operations Research and Management Science, 52–64. New York: Springer.
- Schillings, C., T. Wanderer, L. Cameron, J. T. van der Wal, J. Jacquemin, and K. Veum. 2012. “A Decision Support System for Assessing Offshore Wind Energy Potential in the North Sea.” Energy Policy 49: 541–551. doi:10.1016/j.enpol.2012.06.056.
- Szurek, M.-L., J. Blachowski, and A. Nowacka. 2014. “GIS-based Method for Wind Farm Location Multi-Criteria Analysis.” Mining Science 21: 65−81.
- Vagiona, D. G., and N. M. Karanikolas. 2012. “A Multicriteria Approach to Evaluate Offshore Wind Farms Siting in Greece.” Global NEST Journal 14 (2): 235–243.
- Wind prospect, BMT Asia Pacific Limited, Hong Kong Offshore Wind Limited. 2009. “Hong Kong Offshore Wind Farm in Southeastern Waters Executive Summary.”
- WWF (World Wildlife Fund Hong Kong). 2012. “WWF Launches Hong Kong’s First Marine Biodiversity Map Reveals Fascinating Ocean Treasures.”