
 ?Mathematical formulae have been encoded as MathML and are displayed in this HTML version using MathJax in order to improve their display. Uncheck the box to turn MathJax off. This feature requires Javascript. Click on a formula to zoom.
ABSTRACT
Searching for a parking spot in metropolitan areas is a great challenge, especially in highly populated areas such as downtown districts and job centres. On-street parking is often a cost-effective choice compared to parking facilities such as garages and parking lots. However, limited space and complex parking regulation rules make the search process of on-street legal parking very difficult. To this end, we propose a data-driven framework for understanding and predicting the spatiotemporal legality of on-street parking using the NYC parking tickets open data, points of interest (POI) data and human mobility data. Four popular types of spatial analysis units (i.e. point, street, census tract, and grid) are used to examine the effects of spatial scale in machine learning predictive models. The results show that random forest works the best with the minimum root-mean-square-error (RMSE) for predicting ticket counts and with the highest accuracy scores for spatiotemporal legality classification across all four spatial analysis scales. Moreover, several prominent categories of places such as those with retail stores, health-care services, accommodation and food services are positively associated with the number of parking violation tickets.
1. Introduction
Parking is an important element in the transportation system and plays an important role in people’s travel decisions. Parking availability information and pricing can influence people’s departure and arrival time, travel mode choices, and activity duration. Almost all U.S. cities have minimum parking requirements for each type of land use, which determines the minimum number of parking spaces that should be provided by land developers. Most on-street parking is free or underpriced compared to garages and parking lots and therefore it is often over-demanded. This makes searching for a parking spot in metropolitan areas a great challenge comparable to the Hunger Games, especially in highly populated areas such as downtown districts, job centres, etc. First, the supply and demand of parking spaces is unbalanced with the increasing number of vehicles but limited parking facilities in urban areas. Second, the urbanization process is accelerating in most metropolitan areas and attracting more job opportunities, human flows, business and social activities. These popular destinations together with underpriced parking generates more travel demand and parking needs. Third, parking availability and legality are highly variable spatially and temporally.
Figure 1. The kernel density map for the spatial distributions of parking violation tickets in the New York city over the fiscal years of 2017 and 2018.
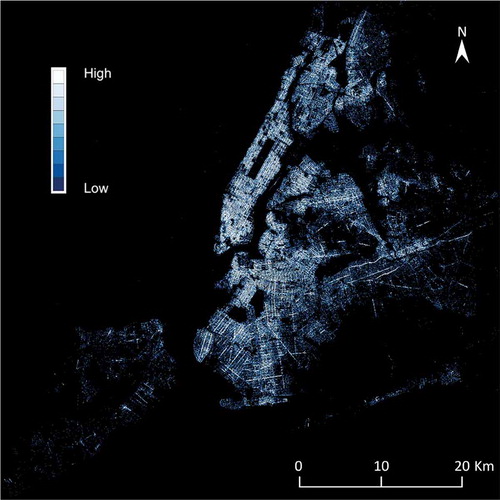
On-street parking is often a cost-effective choice compared to parking facilities such as garages and parking lots. However, limited space and complex parking regulation rules make the search process very difficult. Moreover, there is almost no real-time information about available on-street parking spots and it is legal or illegal to park. Even if the driver is a local resident, compound parking rules can still surprise the driver and generate tickets due to various reasons such as street cleaning schedules, proximity to a fire hydrant, and no standing or no stopping rules during certain time periods. New York City (NYC) is among the most ticketed and the highest ticket cost cities in the United StatesFootnote1. There are over 10.8 million parking violation tickets generated in NYC in the fiscal year 2017 and 11.7 million in fiscal year 2018. shows the kernel density estimation (KDE) map of all parking violation tickets over the two fiscal years. It is worth noting that the spatial distributions of these tickets without overlaying any geographic backgrounds already outline the majority of streets in NYC. The Manhattan Borough in NYC already generates over $200M revenue in on-street parking fines per year by itself. The motivation of this research is to first understand the spatiotemporal patterns of on-street parking violation tickets and then build reliable machine learning models to predict the spatiotemporal legality of on-street parking using NYC open dataFootnote2.
Another important aspect that needs attention when analysing the point-based parking violation data is the scale effect and the modified area unit problem (MAUP). The scale effect may cause variations in statistical results among different spatial aggregation levels and MAUP affects results when point-based measures are spatially aggregated into different zoning configurations (Openshaw Citation1984; Fotheringham and Wong Citation1991). How much detail a machine learning model needs while still producing an acceptable error rate is worth of exploration. To this end, we propose a data-driven framework for understanding and predicting the spatiotemporal legality of on-street parking by training machine learning models using the NYC parking tickets open data. And four types of spatial analysis units (i.e. point, street, census tract, and grid) are used to examine the impact of spatial aggregation scale in machine learning predictive models.
The remainder of the paper is organized as follows. First, in Section 2, we present the literature review on parking availability prediction studies in transportation and computer sciences. Then, in Section 3, we introduce the datasets and preprocessing steps in order to feed the data into machine learning models. In Section 4, we formulate the problem into regression and classification approaches, and briefly introduce a set of machine learning models used in this study. In Section 5, we test our framework at different spatial scales and compare the model performance. In Section 6, we show the designed Web prototype for exploring the parking legality information in NYC. Finally, we conclude this work with some considerations on the potential of this work for urban transportation planning and driver decision-making in Section 7.
2. Related work
Parking has long been studied in the transportation domain. Parking availability and parking fees are important attributes influencing people’s travel demand and mode choice (Christiansen et al. Citation2017). Researchers (Shoup Citation2006, Citation2017) argue that parking in the U.S. is underpriced. The low price of parking reduces the total cost of travel and creates induced travel demand with a mode shift from public transit and other active travel modes to driving. Studies also explored the congestion externality created by cruising for parking (Arnott and Inci Citation2006; Inci and Lindsey Citation2015). Parking management policy such as parking regulation rules, pricing, and time limitation are widely used to balance the parking demand and supply (Litman Citation2018). With better parking information provided, drivers can enhance their parking decision-making and prevents parking overflow from one place to another (Caicedo, Blazquez, and Miranda Citation2012).
There have been many research efforts towards improving the search efficiency for an available parking space given its impact on driving time, traffic, and even air pollution (Teodorović and Panta Citation2006). One study found that 30% of the average traffic cruising in investigated areas was actually caused by searching for parking, with an average search time of 8.1 min (Shoup Citation2006). Google AI research team developed a logistic regression model to predict parking difficulty (e.g. limited parking or easy) by utilizing anonymous aggregated trajectory information from mobile users who opt to share their location data (Cook, Li, and Kumar Citation2017). They used grids as a spatial unit for training the model. Using this, Google launched a new feature for the Google Maps App across 25 US cities that offers predictions about parking difficulty close to users’ destination. There also have been studies focused on detecting the availability of parking spaces either using instrument parking infrastructure with special sensors (Chatman and Manville Citation2014) as well as using crowd-sensing solutions (Chen, Santos-Neto, and Ripeanu Citation2012; Zheng, Rajasegarar, and Leckie Citation2015; Pflügler et al. Citation2016; Bock, Attanasio, and Di Martino Citation2017), but both types of studies rely on the existence of predefined parking spaces or the development of mobile applications such as PhonePark, iPark, and UPDetector (Xu et al. Citation2013; Yang, Fantini, and Jensen Citation2013; Ma, Wolfson, and Xu. Citation2014). This study focuses on determining the legality of a parking space at a given time and day and the location at different spatial scales by utilizing machine learning algorithms and using publicly available parking violation ticket information. One challenge on the prediction of spatiotemporal legality of parking using machine learning is the inconsistency or unbalanced observation data for training. Some efforts have been made in smoothing the training data using support-vector regression (SVR) model in the SFPark project (Bock, Di Martino, and Origlia Citation2017). With these methods, we hoped to be able to provide parking availability estimates while requiring none of the external infrastructure mentioned in the previous studies.
Utilizing machine learning and deep learning in geographic information science is quickly gaining popularity due to its effectiveness and the automation of some tiresome tasks, such as geographical classification and object detection, geographic knowledge discovery (Huang and Jensen Citation1997; Vatsavai et al. Citation2012; Jiang et al. Citation2012; Mao et al. Citation2018; Hu et al. Citation2019). It is already being used in a variety of fields, such as landslide susceptibility and hazard mapping, gully susceptibility mapping, wildfire, environmental modelling, and groundwater studies (Naghibi, Pourghasemi, and Dixon Citation2016). In this study, we examine the importance of spatial resolution when incorporating spatial data with machine learning. At the time of writing, machine learning models examining the spatial heterogeneity at different spatial resolutions are still an emerging study area (Lu et al. Citation2018; Yang et al. Citation2019). Such research incorporates Tobler’s First Law of Geography (Tobler Citation1970) and the scale effect, which is to say that more detailed spatial resolution should provide more related features and likely produce less error than less detailed spatial resolutions. The idea that a machine learning model is able to provide these predictions at all is Tobler’s First Law of Geography in practice, and potentially transferable according to the Third Law of Geography which focuses one the similarity of geographic configuration of locations in spatial predictions (Zhu et al. Citation2018). By examining different spatial resolutions or at aggregating into different spatial analysis units, we provide insights into how much detail a machine learning model needs while still producing an acceptable error rate.
3. Data
3.1. Parking violation tickets open data
As mentioned above, we downloaded over 10.8 million parking violation tickets generated in NYC in the fiscal year 2017 and 11.7 million in fiscal year 2018 from the NYC Open Data platform. Each ticket contains information including a summons number, violation code, street address, ticketing time, vehicle plate, etc.
3.2. Points of interest
In order to understand what kind of surrounding environments are associated with more parking violation tickets, such as the presence of an employment centre, retail stores, health-care services, shopping centres, and so on, we collected data for over 137,000 points of interest (POIs) in NYC from the Safegraph business venue databaseFootnote3. The POIs are first classified based on the North American Industry Classification System (NAICS) two-digit sector codes. To begin, the POIs are classified into 23 categories based on the NAICS two-digit sector codes, including Agriculture Forestry Fishing 11, Mining Oil and Gas Extraction 21, Utilities 22, Construction 23, Manufacturing (31,32,33), Wholesale Trade 42, Retail Trade 44, Retail Trade 45, Transportation Warehousing (48,49), Information 51, Finance Insurance 52, Real Estate & Rental Leasing 53, Professional Scientific Tech 54, Administrative Support and Waste 56, Educational Services 61, Health Care and Social Assistance 62, Arts & Entertainment & Recreation 71, Accommodation & Food Services 72, Other Services 81, Public Administration 92. In addition, the category of Parking Lots and Garages (NAICS Code: 812,930) is treated as a separate POI category since it is directly related to parking activity. This gives a total of 24 categories of POIs at the root level of categorization as part of model features (See in detail).
3.3. Human mobility patterns
In addition to the static spatial distribution of POIs information, we also retrieved the fine-resolution visit patterns of all POIs from the aforementioned SafeGraph database which covers dynamic human mobility patterns of millions of anonymous smartphone users. For each POI, the records of aggregated visitor patterns illustrate the number of unique visitors and the number of total visits to each venue during the specified time window, which could reflect the attractiveness of each venue. The mean hourly visits over a week were recorded as a 168-dimensional vector to show the dynamic stream of visit patterns. If a visitor stays for multiple hours, a visit will be shown in each hour during which the visitor stayed.
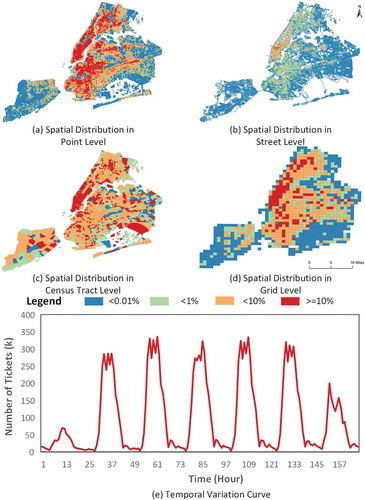
Figure 2. The spatial distribution of parking violation tickets at four spatial scales and the temporal variation curves of tickets.
3.4. Data preprocessing
In this study, we discretized the study area into four spatial scales (point level, street level, census tract level, and 1 km grid level) and the time into 168 hourly slots (7 days of a week 24 h of a day) to capture the snapshots of the legality of street parking. To perform an analysis at the selected spatiotemporal scale, we first found the coordinates of each tickets by using the online geocoding service through Google Maps API. Then, since we focus on the on-street parking legality, the violation ticket points that were more than 50 m away from the road were deleted. Finally, we distributed the number of tickets and corresponding attributes as follows for each spatial unit and each time slot.
At the point level, the following features were chosen: the location of , the time of day
, and the day of week
. The corresponding number of tickets
was used as the label data for model training. At the street level, besides the spatiotemporal characteristics
,
, and
, the street width
, street length
, street type
, and whether it is a two-way street
were selected to characterize each street. In sum, the training features can be represented as follows: [
,
,
,
,
,
,
]. As for the census tract level and 1 km grid level, the features were more complex. At these levels, we not only considered their spatiotemporal characteristics
,
, and
, their street attributes with the summation of street length
_
_
and street area
_
_
, but also considered the dynamic human mobility patterns and the POI distributions in the corresponding spatial unit. The POI data were aggregated to each spatial unit and represented as 24 features. In addition, the number of visits observed in the specified unit
, the number of unique visitors
, the number of visits of corresponding to the time of day
and the number of visits of corresponding to the day of week
were added to model the human mobility patterns. Thus, the training features can be represented as follows: [
,
,
,
_
_
,
,
,
,
,
,
,
,
]. shows the number of samples at each spatial scale and the ratio of positive and negative cases for parking legality classification (See Section 5.3 for more details).
Table 1. The number of samples at different spatial scales and the ratio of positive and negative cases for parking legality classification.
shows the spatial distributions of georeferenced parking violation tickets at four scales and their temporal variation curve of the summation of tickets. The figure of point level data was derived using kernel density estimation, and the other three figures were derived by aggregating the number of tickets to each spatial unit. In order to show the spatial distributions at different scales more clearly, the number of tickets in each scale were normalized to [0,1] with the Min-Max Feature scaling (Aksoy and Haralick Citation2001). The corresponding values were classified into four categories: safe, low probability, high probability, and extremely risky, to show the probability of getting tickets. In order to make the value of class ‘safe’ small enough and the interval of class ‘dangerous’ large enough to meet people’s awareness, the thresholds were set at 0.001, 0.01, and 0.1, respectively.
4. Methods
In this section, we provide the details of our proposed framework to understand and predict the parking legality. In this framework, we approach the parking legality prediction as a regression problem to predict the number of parking violation tickets given a location and time, and as a binary classification problem to interpret parking legality. To this end, a series of machine learning models are trained in four spatial scales with processed datasets that are mentioned in the previous section. The architecture of our proposed framework is shown in .
Figure 3. The proposed parking legality predictive framework using multi-source data and machine learning.
4.1. Prediction of parking violation counts
To investigate the impact of the spatial scale on different regression models, we selected the following six machine learning models for this study:
MLR: Multiple linear regression (MLR) attempts to model the relationship between two or more explanatory variables and a response variable by fitting a linear equation to the observed data (Galton Citation1886).
SVM: Support vector machines (SVM) construct a set of hyperplanes in a high-dimensional space. New samples are mapped into the same space and predicted based on the gaps which they fall into (Cortes and Vapnik Citation1995).
Decision Tree: It is a non-parametric supervised learning method to create a model that predicts the value of a target variable by learning simple decision rules inferred from the data features (Quinlan Citation1986).
Random Forest: The random forest (RF) constructs a multitude of decision trees and outputs the results by computing the mean of the predictions of each individual tree (Breiman Citation2001). RF is trained on different parts of the same training set, with the goal of reducing the variance.
GBRT: The gradient boosted regression trees (GBRT) use a gradient boosting method to construct a set of decision trees as base learners and outputs the result by computing the sum of the base learners (Friedman Citation2001). XGboost uses a more regularized model formalization to control over-fitting issue and thus is chosen in this study (Chen and Guestrin Citation2016).
DNN: Deep neural network (DNN) is a multi-hidden-layer artificial neural network whose artificial neurons can respond to a surrounding unit within a portion of the coverage (Goodfellow, Bengio, and Courville Citation2016). As shown in Figure 4, we constructed a DNN architecture consisting of four fully connected dense layers with reclinear activation functions and two dropout layers with a 0.5 rate to regularize the DNN and improve the generalization error. The output layer uses a linear activation function for regression and a sigmoid activation function to produce a probability between 0 and 1 for binary classification using a threshold of 0.5. The mean square error (MSE) is used as the loss function for regression training while the cross-entropy is used for classifier training.
Figure 4. The multilayer architecture of deep neural network used in this study.
Evaluation: The mean square error (MSE) is used as the cost function for training the models and the root-mean-square error (RMSE) is used for the model evaluation.
Where is the number of observed parking violation tickets at the location
,
is the corresponding predicted value, and
is the number of fed data into each model.
4.2. Prediction of parking legality
In addition to interpreting parking legality as a regression problem by estimating the number of violation tickets, it can also be interpreted as a binary classification problem of whether the corresponding time and place can be legally parked by analysing the historical parking violation ticket information. Therefore, a specified location and time with at least one ticket is marked as ‘positive case’ (i.e. the machine learning binary classification when the number of tickets ) to represent ‘Risky Parking’ and the others will be marked as ‘negative case’ (i.e. the number = 0 and no ticket issued) to represent ‘Legal Parking’. In addition to the aforementioned SVM, random forest, and DNN machine learning approaches that can also be used for the classification problem, four additional classification models are used in this study:
KNN: k-nearest neighbours algorithm (KNN) classifies an object by a vote of its neighbours, with the object being assigned to the most common class among its nearest neighbours in feature space (Cover and Hart et al. Citation1967).
Logistic regression: It uses a logistic function to model the relationship between one dependent binary variable and one or more nominal, ordinal, interval or ratio-level independent variables (Berkson Citation1944).
Naive Bayes: Naive Bayes is a probabilistic classifier that makes classifications using the Maximum A Posteriori decision rule in a Bayesian setting (Maron Citation1961).
SGD: Stochastic gradient descent (SGD) classifier implements linear support vector machines with SGD learning: the gradient of the loss is estimated each sample at a time and the model is updated along the way with a decreasing strength schedule (Zhang Citation2004).
Evaluation: There are four outcomes from the binary classification result (Mohri, Rostamizadeh, and Talwalkar Citation2018): true positives (TP), false positives (FP), True negatives (TN), and False negatives (FN). The following metrics including the overall accuracy, precision and recall, F1-score are used to evaluate the parking legality classification models.
5. Results
Figure 5. The result of selected variables vs. R-squared at the census tracts level and at the 1 km grid level.
Figure 6. The correlation analysis at the census tract level and the 1 km grid level.
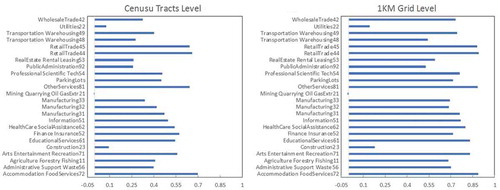
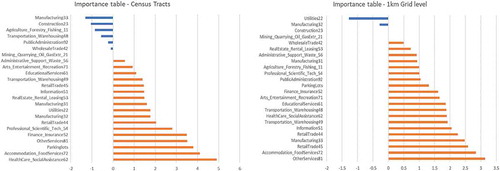
Figure 7. The importance ranking at the census tract level and the 1 km grid level.
5.1. Relationship between parking violation and POIs and visit patterns
For POI-based and mobility-based analyses, the POIs mentioned in Section 3 are aggregated to the census tracts level and the 1 km grid level, respectively, to conduct analysis. After the aggregation, for each analysis unit (a census tract or a grid cell) there is a sum of parking tickets and 24 categories of POIs in each unit.
The multi-linear regression is conducted first to obtain an overall relationship between the parking violation and its surrounding environments. Then, the correlation analysis and the importance ranking using the random forest regression method are also implemented to identify critical factors for the parking violation.
5.1.1. Census tracts level
In the census tracts level, when using all 24 categories of POIs to fit the number of parking tickets in the linear regression, an adjust around 0.59 is obtained. To select the most important variables, an exhaustive search for the best subsets of variables for predicting is implemented and the result is shown in . The figure shows the selected variables and their corresponding
. The total number of variables changes from 2 to 8. It is clear that some variables are always selected for predicting by the model. These categories of POIs should be more related to the existence of parking violation, including Retail Trade, Transportation and Warehousing, Educational Services, Health Care and Social Assistance, Accommodation and Food Services, and Parking Lots.
The results of the correlation analysis and the importance ranking from the random forest regression are presented in and . The results of the two methods are not very similar but there are some overlapping in top variables such as Accommodation and Food Services, Health Care and Social Assistance, Finance Insurance and Retail Trade. The existence of parking lots actually contributes to the increase of parking violation, which may not be intuitive. This might indicate that the current parking lots are still not enough for the parking needs of citizens in New York.
5.1.2. 1 km grid level
At the 1 km grid level, the result of multiple linear regression using all 24 variables is around 0.87, which indicates a good estimation. shows the best subsets of variables for prediction. The frequently selected variables are a little different from the result of the census tracts level, which are Retail Trade, Educational Services, Accommodation and Food Services, and Parking Lots. However, by examining the multicollinearity of different combinations of variables, there always exists high colinearity with the Variance Inflation Factor of over four among variables.
In this case, the results from correlation analysis () and the importance ranking from random forest regression () may be more reliable. The results of the correlation analysis at the 1km grid level are very similar to that of the census tracts level (except for the ParkingLots) where Accommodation and Food Services, Retail Trade and Other Services are the top three most correlated variables to parking ticket numbers. These three factors are also the top three important factors in the importance ranking.
In general, most categories of the POIs will lead to an increase in parking violation, especially when there are accommodation, food, and retail stores. Also, the existence of parking lots cannot prevent the parking violation, which shows that the need for parking lots is still not satisfied at the current stage.
5.2. Results for prediction of parking ticket counts
As shown in and , the prediction RMSE substantially changed across the four different spatial analysis units, which confirmed the existence of the scale effect. With the decrease of the spatial resolution (i.e. from point to street, from census tract to 1 km grids), the model performance also decreases and the RMSE increases across all models. During the model training, we took the cross-validation approach with 80% training data and 20% testing data. shows the MLR learning curves for predicting the number of parking violation tickets at different spatial scales. It shows that the model has the smallest bias at the point level and the bias is largest at the 1 km grid level. However, the generalization capability of the model is good given the convergence of the training curve and the validation curve except for the census tract level, which has a small gap. The results also show that the random forest model works the best with the minimum RMSE and outperforms other competitors by a large margin across all the spatial scales. Note that for the support-vector regression (SVR), we tried different kernel types (e.g. linear, second-degree polynomial, Gaussian RBF) and reported the best model result. The decision tree model built with recursive greedy algorithms ended up with a very complex structure with 36,797 and 13,459 leaf nodes at the census tract level and at the grid level, respectively. XGBoost and DNN are just as good as or better than simple MLR by a small margin at different spatial scales.
Table 2. Prediction of parking violation ticket counts using location and time features with different machine learning models.
Table 3. Prediction of parking violation ticket counts using all features with different machine learning models.
In addition, as expected, these machine learning models using all available features () achieve a better performance compared with the same model but fed with only the location and the time features (). The performance improvement is significant for the census tract level and the 1 km grid level. For instance, the RMSE of MLR reduced about 12% and 25% while the RMSE of random forest reduced over 25% and 31% at the census tract level and at the 1 km grid level, respectively. It confirmed our hypothesis that using the surrounding POI context and dynamic human mobility patterns can help improve the accuracy of machine learning for parking legality prediction. The predication error for a given location point and a time is less than three tickets using the random forest model, which is a promising result for decision-making support. After getting the predicted ticket number for a given location and time, we can then map it into descriptive terms (e.g. safe, low probability, high probability, and extremely dangerous) using the classification scheme as mentioned in Section 3.
Figure 8. The learning curves for predicting the number of parking violation tickets with cross-validation at different spatial scales.
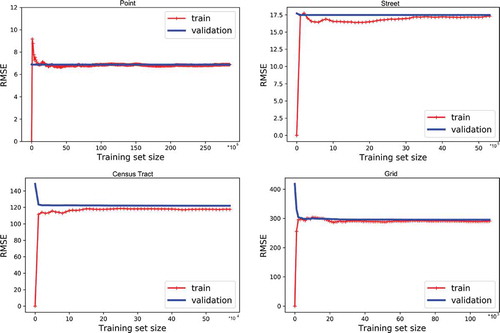
Figure 9. The accuracy and F1-score of different prediction models comparison using imbalanced and balanced samples with resampling process at the street scale.
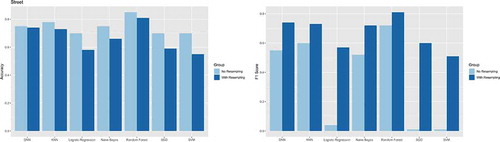
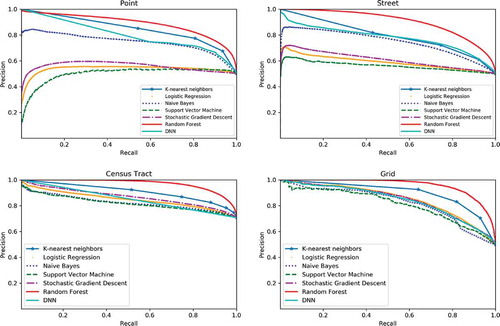
Figure 10. The precision and recall curves of the parking legality prediction results at different spatial scales.
5.3. Results for prediction of parking legality
Regarding the classification results, as shown in , random forest outperforms all other models and achieved both high accuracy scores (0.82, 0.85, 0.86, and 0.88) and high F1-scores (0.82, 0.72, 0.90, and 0.88) across all four spatial scales. The KNN and the DNN also perform well and fall behind the random forest by a small margin. Note that we chose k = 3 as the number of nearest neighbours in feature space with regard to the temporal autocorrelation patterns of parking legality over time and its impact on model performance). The autocorrelation coefficient for parking legality with a temporal lag of 3 hours is 0.28, 0.40, 0.38, and 0.55 at the point, street, census tract, and grid levels, respectively. Although the Naive Bayes model gets a good accuracy and F1 scores at the point level (0.73 and 0.75) and at the street level (0.66 and 0.72), it doesn't perform well at the aggregation levels with lower F1-scores at the census tract level (0.33) and at the 1 km grid level (0.54) due to the multicollinearity issue discussed in the Section 5.1.
Table 4. Prediction accuracy (AC) and F1-score of parking legality using all features with different machine learning models.
Another important issue requiring attention is the presence of imbalanced training data in practice. In our case, there is a class imbalance between the positive class and the negative class for parking legality. The imbalanced training data can cause the accuracy paradox such that we get excellent accuracy but the accuracy is only reflecting the dominating class distribution. Taking the no-resampling street-level data as an example, as shown in , all the models got a high overall accuracy (over 0.7) but relatively low F1-scores, and some of the models (e.g. logistic regression, SVM and SGD) even got close to 0. That is mainly because of the imbalanced training samples between positive (29.7%) and negative (70.3%) classes. Therefore, we resampled the training data with a more balanced distribution for both positives (50%) and negatives (50%). The F1-score increased significantly since we get a better precision and recall performance. Alternatively, one may want to check the detailed precision-recall curves with different recall rates as shown in to compare the model performance especially for highly skewed datasets (Davis and Goadrich Citation2006). It shows that the random forest outperforms all other models with the highest precision value across different recall rates in parking legality prediction at four spatial scales.
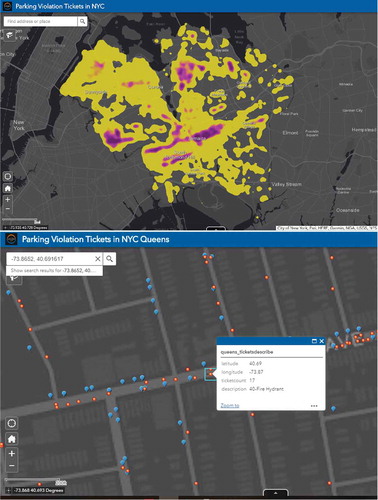
Figure 11. The Web interface of the multi-scale parking legality analysis platform based on Esri Web AppBuilder.
6. Prototype
With regard to the multi-level spatial variation of parking space availability and parking legality, we also worked to design and develop a parking legality Web GIS application by integrating the NYC parking violation open data with statistical analysis at different spatial scales. The machine learning models are encapsulated as web service APIs and deployed using the Flask web framework. As shown in , at a large-scale zoom level, it covers huge amount of data points. Thus, it is better to use KDE mapping for exploring the overall spatial patterns of parking legality while checking the detailed parking legality at a specific location with historical parking ticket statistics and violation type information.
7. Conclusion
In this study, we propose a data-driven framework for understanding and predicting the spatiotemporal legality of on-street parking by training a set of machine learning models using the NYC parking violation ticket open data. The models are tested at four types of spatial analysis units (i.e. point, street, census tract, and grid) and the results confirmed the impact of spatial scale in machine learning predictive models. The more detailed spatial resolution should provide more related features and likely produce less error than less detailed spatial resolutions. The experiment results show that random forest works the best with the minimum RMSE for predicting ticket counts and with the highest F1 scores for spatiotemporal legality classification across all four spatial scales. Given a search location and time for on-street parking, the mean testing error is less than 3 tickets for regression and the F1-score is 0.82 for parking legality prediction, which shows a good potential for street parking applications. Moreover, we also found that several prominent categories of POIs such as retail stores, health-care services, accommodation and food services are positively associated with the number of parking violation tickets. Last but not least, using the surrounding POI context and dynamic human mobility patterns can help improve the accuracy of legal vs. illegal parking prediction. However, one limitation of the proposed method is that the police cruising frequency across space over time may have potential impact on generating the parking violation tickets. With better on-street parking information provided in advance, drivers can enhance their parking decision-making. Our research may offer insights into parking management policy such as parking regulation rules, pricing, and time limitation to balance the parking demand and supply at different spatial scales using open data.
Acknowledgements
The authors would like to thank NYC Open Data support and Safegraph Inc. for providing the anonymous location data and POI visit patterns. Support for this research was provided by the University of Wisconsin–Madison Office of the Vice Chancellor for Research and Graduate Education with funding from the Wisconsin Alumni Research Foundation.
Disclosure statement
No potential conflict of interest was reported by the authors.
Additional information
Funding
Notes
References
- Aksoy, S., and R. M. Haralick. 2001. “Feature Normalization and Likelihood-based Similarity Measures for Image Retrieval.” Pattern Recognition Letters 22 (5): 563–582. doi:10.1016/S0167-8655(00)00112-4.
- Arnott, R., and E. Inci. 2006. “An Integrated Model of Downtown Parking and Traffic Congestion.” Journal of Urban Economics 60 (3): 418–442. doi:10.1016/j.jue.2006.04.004.
- Berkson, J. 1944. “Application of the Logistic Function to Bio-assay.” Journal of the American Statistical Association 39 (227): 357–365.
- Bock, F., Y. Attanasio, and S. Di Martino. 2017. “Spatio-temporal Road Coverage of Probe Vehicles: A Case Study on Crowd-sensing of Parking Availability with Taxis.” In The Annual International Conference on Geographic Information Science, 165–184. Wageningen, the Netherlands: Springer. doi:10.1177/1753193416662427.
- Bock, F., S. Di Martino, and A. Origlia. 2017. “A 2-step Approach to Improve Data-driven Parking Availability Predictions.” In Proceedings of the 10th ACM SIGSPATIAL Workshop on Computational Transportation Science, 13–18. Redondo Beach, CA: ACM.
- Breiman, L. 2001. “Random Forests.” Machine Learning 45 (1): 5–32. doi:10.1023/A:1010933404324.
- Caicedo, F., C. Blazquez, and P. Miranda. 2012. “Prediction of Parking Space Availability in Real Time.” Expert Systems with Applications 39 (8): 7281–7290. doi:10.1016/j.eswa.2012.01.091.
- Chatman, D. G., and M. Manville. 2014. “Theory versus Implementation in Congestion-priced Parking: An Evaluation of SFpark, 2011–2012.” Research in Transportation Economics 44: 52–60. doi:10.1016/j.retrec.2014.04.005.
- Chen, T., and C. Guestrin. 2016. “Xgboost: A Scalable Tree Boosting System.” In Proceedings of the 22nd acm sigkdd international conference on knowledge discovery and data mining, 785–794. San Francisco, California: ACM.
- Chen, X., E. Santos-Neto, and M. Ripeanu. 2012. “Crowdsourcing for On-street Smart Parking.” In Proceedings of the second ACM international symposium on Design and analysis of intelligent vehicular networks and applications, 1–8. Paphos, Cyprus: ACM.
- Christiansen, P., Ø. Engebretsen, N. Fearnley, and J. U. Hanssen. 2017. “Parking Facilities and the Built Environment: Impacts on Travel Behaviour.” Transportation Research Part A: Policy and Practice 95: 198–206.
- Cook, J., Y. Li, and R. Kumar. 2017. “Using Machine Learning to Predict Parking Difficulty.” https://ai.googleblog.com/2017/02/using-machine-learning-to-predict.html
- Cortes, C., and V. Vapnik. 1995. “Support-vector Networks.” Machine Learning 20 (3): 273–297. doi:10.1007/BF00994018.
- Cover, T. M., P. E. Hart et al. 1967. “Nearest Neighbor Pattern Classification.” IEEE Transactions on Information Theory 13 (1): 21–27. doi:10.1109/TIT.1967.1053964.
- Davis, J., and M. Goadrich. 2006. “The Relationship between Precision-Recall and ROC Curves.” In Proceedings of the 23rd international conference on Machine learning, 233–240. Pittsburgh, Pennsylvania: ACM.
- Fotheringham, A. S., and D. W. S. Wong. 1991. “The Modifiable Areal Unit Problem in Multivariate Statistical Analysis.” Environment and Planning A 23 (7): 1025–1044. doi:10.1068/a231025.
- Friedman, J. H. 2001. “Greedy Function Approximation: A Gradient Boosting Machine.” Annals of Statistics 29: 1189–1232. doi:10.1214/aos/1013203451.
- Galton, F. 1886. “Regression Towards Mediocrity in Hereditary Stature.” The Journal of the Anthropological Institute of Great Britain and Ireland 15: 246–263. doi:10.2307/2841583.
- Goodfellow, I., Y. Bengio, and A. Courville. 2016. Deep Learning. Cambridge, MA: MIT press.
- Hu, Y., S. Gao, S. Newsam, and D. Lunga. 2019. “GeoAI 2018 Workshop Report the 2nd ACM SIGSPATIAL International Workshop on GeoAI: AI for Geographic Knowledge Discovery Seattle, WA, USA-November 6, 2018.” SIGSPATIAL Special 10 (3): 16. doi:10.1145/3307599.
- Huang, X., and J. R. Jensen. 1997. “A Machine-learning Approach to Automated Knowledge-base Building for Remote Sensing Image Analysis with GIS Data.” Photogrammetric Engineering and Remote Sensing 63 (10): 1185–1193.
- Inci, E., and R. Lindsey. 2015. “Garage and Curbside Parking Competition with Search Congestion.” Regional Science and Urban Economics 54: 49–59. doi:10.1016/j.regsciurbeco.2015.07.003.
- Jiang, Z., S. Shekhar, P. Mohan, J. Knight, and J. Corcoran. 2012. “Learning Spatial Decision Tree for Geographical Classification: A Summary of Results.” In Proceedings of the 20th International Conference on Advances in Geographic Information Systems, 390–393. Redondo Beach, California: ACM.
- Litman, T. 2018. Parking Management Best Practices. New York, NY: Routledge.
- Lu, F., K. Liu, Y. Duan, S. Cheng, and D. Fei. 2018. “Modeling the Heterogeneous Traffic Correlations in Urban Road Systems Using Traffic-enhanced Community Detection Approach.” Physica A: Statistical Mechanics and Its Applications 501: 227–237. doi:10.1016/j.physa.2018.02.062.
- Ma, S., O. Wolfson, and B. Xu. 2014. “UPDetector: Sensing Parking/unparking Activities Using Smartphones.” In Proceedings of the 7th ACM SIGSPATIAL international workshop on computational transportation science, 76–85. Dallas-Fort Worth, Texas: ACM. doi:10.1177/1753193414560119.
- Mao, H., Y. Hu, B. Kar, S. Gao, and M. Grant. 2018. “GeoAI 2017 Workshop Report: The 1st ACM SIGSPATIAL International Workshop on GeoAI:@ AI and Deep Learning for Geographic Knowledge Discovery: Redondo Beach, CA, USA-November 7, 2016.” SIGSPATIAL Special 9 (3): 25. doi:10.1145/3178392.3178408.
- Maron, M. E. 1961. “Automatic Indexing: An Experimental Inquiry.” Journal of the ACM (JACM) 8 (3): 404–417. doi:10.1145/321075.321084.
- Mohri, M., A. Rostamizadeh, and A. Talwalkar. 2018. Foundations of Machine Learning. Cambridge, MA: MIT press.
- Naghibi, S. A., H. R. Pourghasemi, and B. Dixon. 2016. “GIS-based Groundwater Potential Mapping Using Boosted Regression Tree, Classification and Regression Tree, and Random Forest Machine Learning Models in Iran.” Environmental Monitoring and Assessment 188 (1): 44. doi:10.1007/s10661-015-5049-6.
- Openshaw, S. 1984. “The Modifiable Areal Unit Problem.” Concepts and techniques in modern geography.
- Pflügler, C., T. Köhn, M. Schreieck, M. Wiesche, and H. Krcmar. 2016. “Predicting the Availability of Parking Spaces with Publicly Available Data.” Informatik 2016.
- Quinlan, J. R. 1986. “Induction of Decision Trees.” Machine Learning 1 (1): 81–106. doi:10.1007/BF00116251.
- Shoup, D. 2017. The High Cost of Free Parking: Updated Edition. New York, NY: Routledge.
- Shoup, D. C. 2006. “Cruising for Parking.” Transport Policy 13 (6): 479–486. doi:10.1016/j.tranpol.2006.05.005.
- Teodorović, D., and L. Panta. 2006. “Intelligent Parking Systems.” European Journal of Operational Research 175 (3): 1666–1681. doi:10.1016/j.ejor.2005.02.033.
- Tobler, W. R. 1970. “A Computer Movie Simulating Urban Growth in the Detroit Region.” Economic Geography 46 (1): 234–240. doi:10.2307/143141.
- Vatsavai, R. R., A. Ganguly, V. Chandola, A. Stefanidis, S. Klasky, and S. Shekhar. 2012. “Spatiotemporal Data Mining in the Era of Big Spatial Data: Algorithms and Applications.” In Proceedings of the 1st ACM SIGSPATIAL international workshop on analytics for big geospatial data, 1–10. Redondo Beach, California: ACM.
- Xu, B., O. Wolfson, J. Yang, L. Stenneth, S. Yu Philip, and P. C. Nelson. 2013. “Real-time Street Parking Availability Estimation.” In 2013 IEEE 14th International Conference on Mobile Data Management, Vol. 1, 16–25. Milan, Italy: IEEE.
- Yang, B., N. Fantini, and C. S. Jensen. 2013. “iPark: Identifying Parking Spaces from Trajectories.” In Proceedings of the 16th International Conference on Extending Database Technology, 705–708. Genoa, Italy: ACM.
- Yang, X., Z. Fang, Y. Xu, L. Yin, J. Li, and S. Lu. 2019. “Spatial Heterogeneity in Spatial Interaction of Human movements—Insights from Large-scale Mobile Positioning Data.” Journal of Transport Geography 78: 29–40. doi:10.1016/j.jtrangeo.2019.05.010.
- Zhang, T. 2004. “Solving Large Scale Linear Prediction Problems Using Stochastic Gradient Descent Algorithms.” In Proceedings of the twenty-first international conference on Machine learning, 116. Banff, Alberta, Canada: ACM.
- Zheng, Y., S. Rajasegarar, and C. Leckie. 2015. “Parking Availability Prediction for Sensor-enabled Car Parks in Smart Cities.” In 2015 IEEE Tenth International Conference on Intelligent Sensors, Sensor Networks and Information Processing (ISSNIP), 1–6. Singapore: IEEE.
- Zhu, A.-X., G. Lu, J. Liu, C.-Z. Qin, and C. Zhou. 2018. “Spatial Prediction Based on Third Law of Geography.” Annals of GIS 24 (4): 225–240. doi:10.1080/19475683.2018.1534890.