
 ?Mathematical formulae have been encoded as MathML and are displayed in this HTML version using MathJax in order to improve their display. Uncheck the box to turn MathJax off. This feature requires Javascript. Click on a formula to zoom.
ABSTRACT
Mound tombs, popular in the south Yangzi River area in Shang and Zhou Dynasties, are regional cultural remains in China. With the aims of protecting and scientifically analysing cultural relics, laser scanning technology was adopted to study Zhaihuatou mound tombs located in Nonglin Village in Tianwang town, Jiangsu Province. Multiple tombs are held within one mound in good keep and with the typical construction of centripetalism. Accurate tomb LiDAR (Light Detection And Ranging) data were acquired by applying terrestrial laser scanning technology to the field mound excavation. Subsequently, a spatial morphological analysis of the tombs was conducted on the basis of archaeological rules and GIS spatial data processing methods. Using the theory of centripetalism construction of multi-tomb-one-mounds, we proposed an algorithm to determine the concentrated area of the geometric directions of tombs, and centripetalism theory was scientifically validated in comparing results with the excavation data. Spatial data clustering methods were used to analyse and deduce the spatial distribution characteristics of the tombs. We propose and demonstrate that the burial system is in the form of family-clan aggregation, and is useful for developing research on regional burials. Experimental data show that the proposed method is a novel example of how spatial analysis can foster more precise field archaeological excavations on a large scale, and it is significant to study various types of tombs, relics and ruins.
1. Introduction
Mound tombs, now regional culture remains in China, were popular in the south Yangzi River area in Shang and Zhou Dynasties-(ca 1600BCE) and (1046–256BCE) (Tian, Lv, and Tang Citation2005). The tombs were shaped by burying the dead in the ground (or shallow pit) and superimposing or breaking the former mound to bury the dead successively. This process was repeated and resulted in bread-shaped mounds. Most of these mounds are distributed in south Jiangsu, around Tai lake, and especially in Nanjing and Zhenjiang, cities that serve as important references to study local culture in the Wuyue area from the early stage of the Western Zhou Dynasty to the Spring and Autumn Period.
Excavation of the tombs can generate valuable information on funeral customs and burial forms, which helps us better understand past societies and their politics, religion and lifestyles (Xiaoyong Citation2005; Gengfu Citation2001). Thus, it is necessary to record field information at archaeological sites. However, the current data acquisition of tombs remains at low levels. Relic sketch maps are mostly based on manual work presented by 2D graphics, and archaeological analyses are based on information extracted from local chronicles, cultural relics census data and related texts. Such analytical methods face scientific limitations, especially in terms of accuracy. Moreover, due to the complex environments of archaeological sites, the irreversibility of excavation and human and natural factors, it is challenging to quickly record precise spatial information using traditional surveying methods. The site may even be destroyed because of low efficiency (low efficiency will prolong the excavation-span and increase the possibility of profile wall collapse due to bad weather, human factors and so on). Thus, traditional surveying and mapping methods do not fully meet the needs of digital archaeology.
In contrast, 3D laser scanning technology can be adopted to collect high-density spatial data quickly and precisely through a non-contact (no destruction). Therefore, this technology can protect excavation site and comprehensively record detailed feature information. 3D models based on LiDAR data are useful in reconstructing and renovating cultural relics, tombs, ancient buildings and display sites more effectively than 2D ichnography (Vincent & Levy, Citation2014). Moreover, in concert with other scientific and technological methods, these models support archaeological field research in producing realistic and measurable scenes of historic sites that can be used to identify and analyse traces of ancient human activities (Wei, Zhang, and Zhang Citation2012).
Applications and studies based on LiDAR data have been developed in recent years towards the aim of protecting cultural relics. Examples include an application based on LiDAR data of a 3D reconstruction of the Mengjingtang Tomb in Luoyang city (Zhou and Mao Citation2013), the 3D modelling of an unearthed pottery house from Hepu Han tomb based on LiDAR (Wang et al., Citation2015), the 3D modelling of the terracotta soldiers and horses of the Qin Dynasty in Shanxi Province (Yang Citation2006). Additionally, Rao, Mirko et al. presented a preliminary virtual reality reconstruction of the Etruscan painted tombs in Tarquinia, which could be combined with additional visualized information by the environment (Rao, Gadia, and Valtolina Citation2012). Stular, B. suggested evaluating the extent and nature of new archaeological information extracted from LiDAR-derived (from the Kobarid region, Slovenia) high-resolution relief models. A case study on the settlements from the Late Antiquity period focused on the endorsed methods of LiDAR-derived data uses (Stular Citation2011). Hesse, R. presented a data processing approach that generated local relief models (LRM) from LiDAR-derived high-resolution digital elevation models (DEMs) for archaeological prospection. The LRM raster map with local positive and negative relief variations could be used for mapping and prospecting archaeological features such as burial mounds, linear and circular earthworks, sunken roads, agricultural terraces, ridge, furrow fields, kiln podia and mining/quarrying sites (Hesse & Ralf, Citation2010). Schindling, J et al. explored the use of airborne LiDAR in archaeology and used a case study to investigate the potential of LiDAR data for identifying earthworks dating back to the pre-Roman period in central England. Additionally, in order to facilitate the detection of human activity on the landscape, a technique used to enhance image has been evaluated (Schindling and Gibbes Citation2014). Fernandez-Diaz, JC et al. described the workflow from mission planning to final data product based on airborne mapping LiDAR for archaeological research in Mesoamerica (Fernandez-Diaz et al. Citation2014). Evans, DH et al. presented the use of airborne LiDAR technology to create high-precision DEMs of the ground surface beneath the vegetation cover. LiDAR data revealed anthropogenic changes to the archaeological landscape on a vast scale at Angkor (Evans et al. Citation2013). Raimondi, Vet al. presented the results of a joint Italian-Swedish project focused on documenting and recording the status of some sections in areas closed to the public by using fluorescence hyperspectral imaging LiDAR, a technique used to remotely detect the growth of phototrophic biodeteriogens on the walls (Raimondi et al. Citation2013). A method of using a multi-baseline digital close-range photogrammetry technique in the 3D reconstruction of an underground tomb was proposed. The test showed that the precision of mapping and image texture satisfied the requirements for the preservation of cultural relics (Kreytenberg Citation2014; Wu, Feng, and Wang Citation2010). Lin, et al. considered three factors to analyse settlement modality in the Luoyang area: spatial distance among settlements, their scopes and some natural barriers. The space and attribute information were sufficiently mined to reveal the modality characters and union of settlement groups at a small scale (Yang, Pei, and Guo Citation2012).
Research efforts in digital archaeology primarily focus on 3D modelling or prospecting archaeological scenes in large regions using airborne LiDAR. Various schemes are also used to improve reconstruction precision. However, few of the existing methods consider spatial analyses based on LiDAR data, especially for specific field archaeological objects or sites. In this study, a series of data processing methods based on terrestrial LiDAR data and archaeological knowledge are proposed for the excavation of mound tombs. The study validates the theory of centripetalism construction for a multi-tomb-one-mound and burial system in the form of family-clan aggregation.
2. Study area
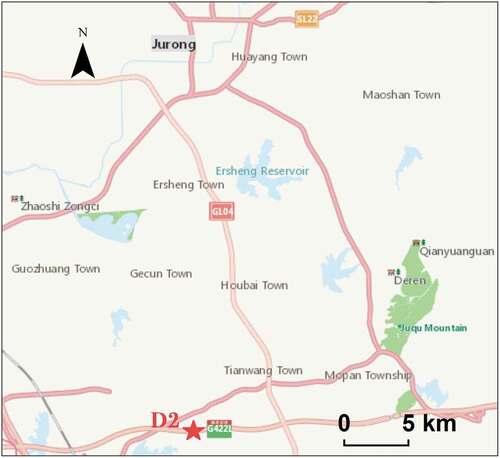
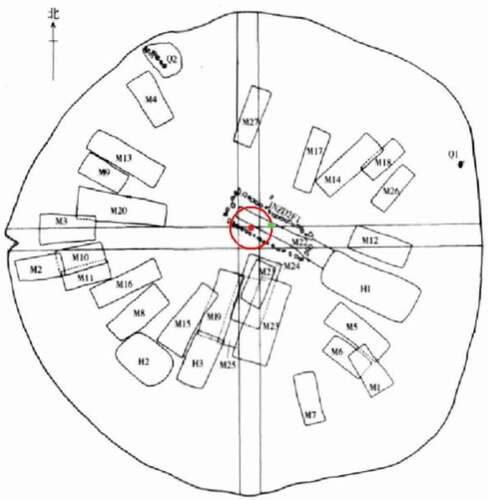
The study area, the Zhaihuatou mound necropolis (numbered as D1-D6), is located in Nonglin Village in Tianwang town, approximately 25 km south of Jurong City, Jiangsu Province and was excavated in 2005 by the Jiangsu Province Museum of Nanjing’s Institute of Archaeology. Tomb D2, one of the necropolises, was part of a multi-tomb in one mound with the typical construction of centripetalism and in good shape, and thus taken as the case study (). Namely, the tomb D2 is characteristic of several graves at different strata approximately around the necropolis centre According to the brief excavation report (The Museum of Nanjing Citation2007), the tombs approximately date back to the middle of the Spring and Autumn Period through analysis of the scope of the necropolis and the abundant remains and attendant funeral accessories. Twenty-seven graves, three ash pits and two intact sets of artefacts were found. The No.22 tomb is located in the central mound, and the other tombs are encircled or are located near the No.22 tomb. Tomb No.1 lays under the 2nd stratum, tomb No.2 lays under the 3rd stratum, tomb No.3~ No.12 lay under the 4th stratum, and No.13~No.27 lay under the 5th stratum.
Figure 1. Location of the study case
The excavation of the mound necropolis D2 was performed by quartering with square units given its special shape. The excavation based on quartering started in the middle of the mound, and two crossed one-metre-wide beams towards north-south and west-east remained. The tombs were then divided into four units by the two beams, which were numbered as I (northwest area), II (northeast area), III (southeast area) and IV (southwest area). The four square units were excavated synchronously stratum by stratum, and mound D2 could be restored by reverse manipulation in exposing the strata and clearing the relics (as ).
Figure 2. Necropolis D2
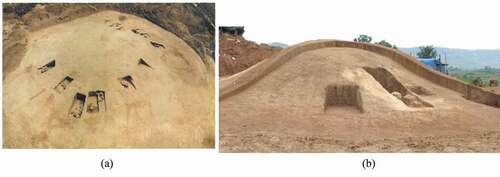
Due to the rescue excavation, we only completed the LiDAR data acquisition of the tombs between the 4th~5th strata (the observed mound is 23.242 m wide and 25.909 m length and 3.623 m height), which included tombs No.3, No.4, No.7 ~ No.10, No.12~ No.15 and ash pits No.1 and No.3 (as )). In this instance, the two pits are very similar to the other tombs in shape, structure and direction, yet have no burial accessories (The Museum of Nanjing Citation2007). In addition, calcification due to the southern climate increased the likelihood that the pits could be graves without burial accessories or occupants. For the consistency of data analysis in this study, the two ash pits were assumed to be tombs.
3. Data acquisition and processing
For a terrestrial laser scanning system, the 3D coordinates of some object can be calculated based on the spatial distance and horizontal and vertical angles between the scanner centre and the reflector object (as and Formula 1). In this study, the 3D laser scanner Riegl LMS- Z420i was adopted to collect vast amounts of high-density spatial data of the necropolis D2 site quickly and precisely. The scanner provides 2–1000 m measurement range, field of view up to 80°*360°, accuracy 10 mm within 100 m and minimum angle step width 0.004°. After a series of data processing for registration, data deduction and editing, the point cloud data could be used as a base for the following 3D reconstruction (not described in this paper) and spatial analysis.
Figure 3. 3D coordinates calculation based on laser scanner
The laser beam projected on the surface of the object (the light spot is called footprint) and return to the detector, the distance from the scanner to the footprint () is measured, and the rotation angle (
) and the pitch angle (
) are also recorded. So the 3D coordinates P(x, y, z) of the footprint can be calculated in the scanner’s own coordinate system (see ).
3.1. Data acquisition and registration
Due to the large scope and the complex environment surrounding necropolis D2, it was difficult to cover the entire excavated area using a single scanning station. We scanned the whole D2 according to the scope of the mound by setting up three scanning observatories with multiple targets as control tiepoints in each station, which were necessary for the registration of the point cloud data. And the tiepoints should have been visible to the two adjacent stations. Namely, the coordination systems of adjacent scanning stations could be registered by using enough same control tiepoints (at least three tiepoints). As shown in , there are original LiDAR data in three scanning stations with the sensor coordinate system. The LiDAR data in different scanning stations are registered (similar to unifying the coordinate systems) to build a complete 3D geometric model of the necropolis (Sheng, Zhang, and Zhang Citation2010). The registered data of D2 are shown in .
Figure 4. Original LiDAR points (a, b, c) and registration (d)
3.2. Data pre-processing
To improve calculating efficiency, data pre-processing involving data reduction and optimization of the entire LiDAR data should be conducted on the premise of maintaining data features intact and precise (as ). First, the multiple occurring noise points originating from the sensor in this term were removed from the surface of the model as isolated or deviating points. Second, for the subsequent burial space analysis, the required feature points, such as the graves and beam points in the scanning area, were segmented and retained based on the clustering algorithm. These data could be used to determine the boundary and principal direction of the burial and the spatial distance between adjacent burials, etc. Finally, sampling with a unified sampling proportion was adopted to effectively eliminate redundant data after de-noising, on the premise of maintaining the required geometric features intact and ensuring the accuracy of the analysis.
Figure 5. Flowchart of the data pre-processing
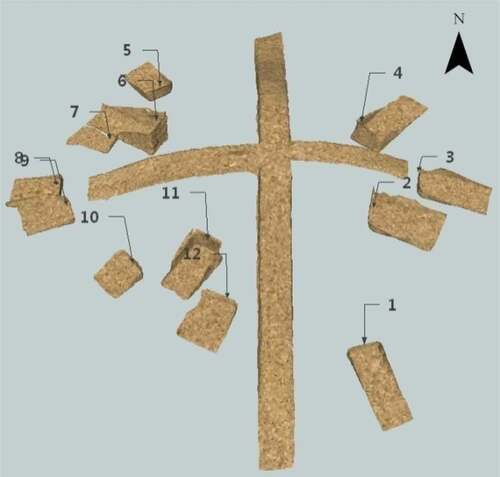
After the aforementioned processing, the scanned 12 graves were numbered as 1, 2, …, 12 in counter-clockwise order for reading convenience, respectively, corresponding to the tombs: M7, H1, M12, M14, M4, M13, M9, M3, M10, M8, M15, H3 in the brief report (). M22 was the centre grave.
Figure 6. Graves numbers
4. Spatial modality analysis of mound necropolis
The distribution pattern of the tombs not only shows the burial system at that point in time but also reflects funeral etiquette and customs of the local people, thereby yielding important information for the study of the evolution of the funeral mode and grave structure. In this study, we carried out a quantitative analysis on the centripetalism construction and the pattern of family-clan aggregation of the multi-tomb-one-mound, and put forth a spatial-temporal analysis approach for similar geographical issues.
4.1. Centripetalism of multi-tomb-one-mound
The structure of the mound necropolis includes three types: irregular, stepped and centripetal (Li, Zhou, and Yuan Citation2005). This study mainly studied the centripetal structure. The centripetal structure is characteristic of several graves at different strata approximately are around the necropolis centre. The available determination of the centripetalism of tombs mainly depends on visual judgement (The Museum of Nanjing Citation2007; Li, Zhou, and Yuan Citation2005), and rarely involves real data or scientific methods. To verify the centripetalism of the mound necropolis, we propose a mathematical method to calculate and analyse it on the basis of the LiDAR data collected between the 4th~5th strata.
Currently, the determination methods of the study region’s centre are mainly based on area, geometric centre, direction and integrated factors (Wang Citation2008). We adopted burial direction as the key factor to determine the centre of the tombs, because the direction of the grave usually corresponds to one of the grave occupants’ heads. According to archaeological definitions, this is an important aspect of funeral customs and burial forms and one of the representations of a historical-cultural community.
In theory, the orientation lines of all tombs with the centripetal structure should intersect at one point, but must be buffered at that point due to unavoidable errors in the process of tomb construction and field excavation. The argument and analysis based on experiments are as follows.
Due to the small variance in elevation for these graves, only the horizontal coordinates (the 3D coordinates were projected to the XOY plane, z-coordinate = 0) were adopted to clearly express their spatial relation. Namely, the line equations of the graves’ directions were calculated on the basis of principal component analysis using the LiDAR coordinates X and Y. According to the definition of burial orientation in archaeology, the recorded location of the occupant’s head in the excavation document was used to determine the main directions towards the centre grave M22 of the tomb mound (). Then, based on the aforementioned analysis regarding the buffer area of the mound tombs, it could be deduced that the orientation lines approximately concentrate on some region instead of one point. In this study, we conducted scientific verification on the space calculation and analysis using the precise3D scanning data of study area.
Figure 7. Inscribed circle of centripetalism
On basis of this reasoning, we deduced that the common region determined by the multiple orientation lines should intersect or be tangential to each line (boundary condition) and the size of the minimum common area should indicate the aggregation degree of the lines. Considering that the inscribed circle of a triangle composed of three non-parallel lines is exactly the minimum common area of the three lines, the minimum circle of all the inscribed circles composed of more than three lines simultaneously meets the intersection or is tangential to all lines, which is the minimum common area of all the lines. The specific algorithm and process are as follows ():
Figure 8. Flowchart of determining the common area of all orientation lines
Calculate and detect the existence of parallel lines among all the orientation lines. If yes, the parallel line pairs will not be included in any triangle simultaneously;
According to the three lines forming a triangle,
triangles can be obtained by permuting and combining the remaining non-parallel lines (
Calculate all vertexes coordinates of the
Determine the spatial relation between the
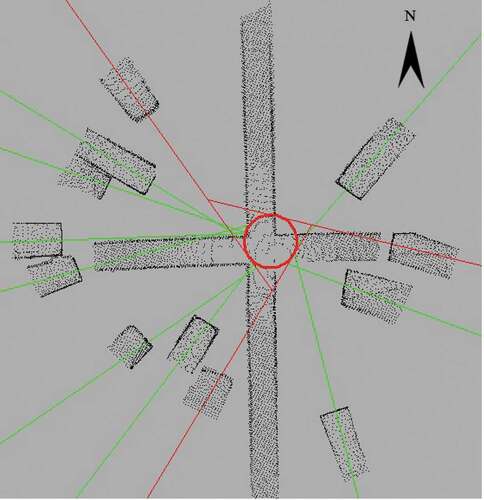
There were no parallel line pairs among the 12 graves direction based on the above algorithm, so 220 () triangles could be obtained by using permutations and combinations. The ultimate inscribed circle is shown as (the red circle determined by the three red lines was the least common area, and the other orientation lines were green), whose radius was 1.210 m and the centre coordinates were (−19.250, 1.521) m, approximately lying in the intersection of the two beams. According to a comparison with the registered general plane figure in the brief excavation report (), the distance between the geometric centre point of the central grave M22 (the green point (−20.220, 1.564) m) and the inscribed circle centre (the red point) was 0.971 m. Considering the error during constructing the tombs and archaeological excavation and partial samples, the calculated inscribed circle almost overlapped M22, which demonstrates the centripetalism of the mound tombs as well as the feasibility and accuracy of this analytical method.
Figure 9. Centres of the inscribed circle and grave M22
Burial orientations in different dynasties, cultures and clans had their own ways and principles. Generally, ancient burial orientation represented three kinds of connotation: the orientation of the birthplace of the grave occupant, the yearning place after the occupant’s death and the place of the occupant’s faith. In this study, the graves’ orientation was inferred as the third kind. According to a study by Li, Zhou, and Yuan (Citation2005), the occupant of the centre grave at the bottom has been respectable and admirable, with high status in the family. This formed the pattern of centripetalism for the surrounding tombs. Accordingly, we speculated and verified that these mound tombs were indeed of the family type; the occupant of the centre grave should be the elder of the family or the clan (The Museum of Nanjing Citation2007).
4.2. Spatial morphological analysis of clan-family pattern of multi-tomb-one-mound
According to the first law of geography, everything is related to everything else, but near things are more related to each other than are distant things. This law has important implications for tomb archaeology. The ancients had different social identities and roles at three levels: settlement, clan and family. This resulted in tomb organization within an area, group and set of burial systems. Namely, the density variable of the tombs reflected the kinship of the tomb occupants (LI Citation1991).
The density of tombs is usually measured based on the spatial distance of tombs (spatial temporal proximity). According to the excavation record, the scanned 12 tombs lying in the transition region of the adjacent 4th~5th strata could be approximately regarded as the same stratum’s surface. At the same time, based on the LiDAR data, we calculated that the elevation differences among the 12 tombs were small (maximum difference was approximately 1.3 m). Thus, we concluded that the 12 tombs were formed in the same period. From , we further found that the distribution of the 12 tombs followed a decentralized and centralized pattern with a certain regularity, and there were no overlaps or breaks among the tombs. This reasoning illustrates that the orientation of these tombs was not fortuitous: the ancients were able to locate their tombs accurately rather than casually, regardless of time span or missing family information. The density variable of the tombs reflects the level of the burial system and status of the tomb occupants.
On the basis of the aforementioned analysis, we divided these tombs by using the minimum distance of all adjacent tombs and a series of methods and rules. That included the multiple difference method and references to some accuracy targets including arithmetic mean value and mean square error and tolerance. The specific process () of analysing the spatial modality of the multi-tomb-one-mound is as follows:
Calculate the arithmetic mean value Thr of the minimum distance of all the adjacent registered tombs in the brief report, and new dataset T;
Record all scanned tombs’ numbers in the dataset M, and presume all these tombs as one group;
Segment the point cloud data of all scanned tombs, and calculate the minimum distances of all the adjacent tombs in dataset M and record them in dataset D{dj, j = 1,2, … n};
Calculate the mean square error δ of the dataset D;
If δ is less than Thr, go to (7);
If δ is larger than or equal to Thr, judge whether dj is larger than 2δ by traversal operator, if not, judge whether the division is finished; if yes, remove the dj from D, and record the numbers of the two adjacent tombs related to the dj in dataset T, and go to (4) after all the judgement is done;
All repeated recorded tomb in dataset T form a single group, and all the rest of adjacent tombs form dataset M, except the repeated tombs in dataset T form a group, respectively. The division is finished.
Figure 10. Tombs division based on multiple difference calculation
Based on the above algorithm, we calculated the arithmetic mean value Thr of the minimum distance of all the adjacent registered 29 tombs (including 3 ash pits, excluding the centre tomb M22) shown as , and the Thr was 0.464 m. Next, 12 tombs could be divided into 6 groups () by using the scanned LiDAR data and based on triple difference calculation (), 1and 4 was an independent group, respectively, and 2–3, 5-6-7, 8–9, 10–11-12 was a combined group, respectively. The division was more or less consistent with our initial inference based on visual inspection. We deduced each group as a family and all tombs as a clan, and the occupant of M22 may have been an important figure of the clan. Graves 1 and 4 do not belong to any of the family groups identified above. Perhaps they are the only members of their respective families that were buried here. They could also signify ‘tomb(s) on a borrowed mound’ (Du & Wang Citation2010); that is, they could be intrusive burials or internments unaccompanied by the types of earthwork additions and reorganization noted previously (see section 4.1). Lastly, since the entire mound was not excavated and as we were only able to record features between the mounds’ 4th and 5th strata (see section 2 and ), the family members associated with graves 1 and 4 may not have been scanned.
Figure 11. Division of 12 tombs (tombs in one ellipse as one family group)
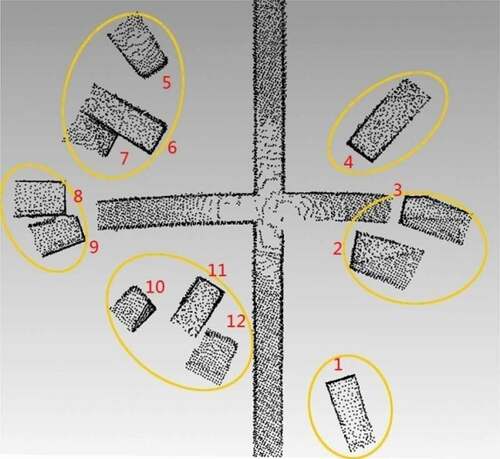
Table 1. Division process of the 12 tombs (m)
5. Discussion and conclusions
We precisely mapped tomb architecture and mortuary alignments in three-dimensions. We also developed algorithms that showed the special shape and structure of the mound with respect to grave location and orientation, affirming the importance of centripetalism as a design principle for mound construction through time. We presented the division method of tombs based on the theory of error and multiple differences, and used the distance calculated by using LiDAR data to deduce and conclude the burial system of the case study’s family-clan. The proposed methods not only apply to the modelling and analysis of mound tombs but also extend to the spatial analysis of various types of tombs and ruins.
Questions and next steps for future research primarily include (1) the attendant funeral accessories and bone identification, based on physicochemical methods, would be adopted as supplementary information to verify the spatial distribution of the family-clan pattern. (2) Due to a rescue excavation, LiDAR data for partial tombs were acquired and used to develop the study. (3) In further research, data acquisition should be undertaken from the beginning to the end during the entire excavation. According to the idea of ‘peel onions’ (Lin, LI, and Tian Citation2005), every tomb should be 3D scanned and measured for reverse application in order to simulate the formation processing of tomb and to ensure comprehensive and integrated spatial-temporal analyses of tombs among strata, both of which are conducive to exploring the law of distribution and relationships of the tombs.
Acknowledgements
The authors are very grateful to Institute of Archaeology, Museum of Nanjing for providing a chance to acquire the field data. Furthermore, sincere thanks is given for the comments and contributions of anonymous reviewers and members of the editorial team.
Disclosure statement
No potential conflict of interest was reported by the authors.
Additional information
Funding
References
- Daobo, W., H. Wei, S. Yan, and W. Wangming. 2015. “3D Modeling of Unearthed Pottery House fromHepu Han Tomb Based on LIDAR.” Journal of Hunan University of Science & Technology Natural Science Edition 30 (1): 92–96.
- Du, J. J., and G. F. Wang. 2010. “Several Questions about the Research on Mound Tombs.” Cultural Relics in Southern China 4: 120–142.
- Evans, D. H., R. J. Fletcher, P. Christophe, J.-B. Chevance, D. Soutif, B. S. Tan, S. Im et al. 2013. “Uncovering Archaeological Landscapes at Angkor Using Lidar.” Proceedings of the National Academy of Sciences of the United States of America 110 (31): 12595–12600. DOI:https://doi.org/10.1073/pnas.1306539110.
- Fernandez-Diaz, J. C., W. E. Carter, Shrestha, R. Shrestha, and C. Glennie. 2014. “Now You See It … Now You Don’t: Understanding Airborne Mapping LiDAR Collection and Data Product Generation for Archaeological Research in Mesoamerica.” Remote Sensing 6 (10): 9951–10001. doi:https://doi.org/10.3390/rs6109951.
- Gengfu, W. 2001. “A Preliminary Study of Mounded Tombs in Southern Jiangsu.” Huaxia Archaeology[J] 01: 50–62.
- Hesse & Ralf. 2010. “Lidar‐derived Local Relief Models – A New Tool for Archaeological Prospection.” Archaeological Prospection 17 (17): 67–72.
- Kreytenberg, G. 2014. “AnUnpublished Fragment from the Tomb for Cardinal Luca Fieschi Von Lupo Di Francesco and a New Proposal for the Reconstruction of the Monument.” Mitteilungen Des Kunsthistorischen Institutes in Florenz 56 (2): 153–170.
- Li, H. R., R. K. Zhou, and F. Yuan. 2005. “Multi-tomb in One Mound in the Form of Centripetal Structure.” China Cultural Heritage 6: 21–24.
- LI, Z. Y. 1991. “TheSociological Study of the Non-blood Relationships in Western Zhou DynastyCommune.” Jianghan Tribune 12: 62–66.
- Lin, L. G., H. R. LI, and M. L. Tian. 2005. “Decoding Mound Tombs in the Regions South of the Yangtze River.” China Cultural Heritage 6: 3–4+8-9.
- The Museum of Nanjing. 2007. “A Brief Excavation Report on Mound Tombs Located in Zhaihuatou Village, JurongCity, Jiangsu Province[R].” Cultural Relics 614 (7): 20–39.
- Raimondi, V., C. Alisi, K. Barup, M. P. Bracciale, A. Broggi, and C. Conti. 2013). “Fluorescence Lidar Measurements at the Archaeological Site House of Augustus at Palatino, Rome.” Society of Photo-Optical Instrumentation Engineers (SPIE) Conference Series-Ryn, Poland, 8893, 6480–6484.
- Rao, M., D. Gadia, and S. Valtolina. “2012. “Designing Virtual Reality Reconstructions of Etruscan Painted Tombs.” Multimedia for Cultural Heritage.Springer, Berlin Heidelberg, 247,154–165.
- Schindling, J., and C. Gibbes. 2014. “Lidar as a Tool for Archaeological Research: A Case Study.” Archaeological & Anthropological Sciences 6 (6): 411–423. doi:https://doi.org/10.1007/s12520-014-0178-3.
- Sheng, Y. H., K. Zhang, and K. Zhang. 2010. “Seamless Multi Station Merging of Terrestrial Laser Scanned 3D Point Clouds.” Journal of China University of Mining & Technology 39 (2): 233–237.
- Stular, B. 2011. “The Use of Lidar-derived Relief Models in Archaeological Topography the Kobarid Region (Slovenia) Case study[J].” Arheoloskivestnik 62: 393–432.
- Tian, M. L., C. H. Lv, and X. L. Tang. 2005. “Funeral Building of Mound Tomb.” China Cultural Heritage 6: 32–35.
- Vincent, M. L., T. E. Levy, and T. E. Levy. 2014. “OpenDig: Digital Field Archaeology, Curation, Publication, and Dissemination.” Near Eastern Archaeology 77 (3): 204–208. doi:https://doi.org/10.5615/neareastarch.77.3.0204.
- Wang, J. 2008. The Space Concept in Traditional Settlement Structure, 60–117. Beijing: China Architecture & Building Press.
- Wei, C. T., L. H. Zhang, and X. D. Zhang. 2012. “The Application of 3D Laser Scanning Technique in Tomb Protection.” Geomatics & Spatial Informationtechnology 35 (10): 4–6.
- Wu, X., W. Feng, and K. Wang. 2010. “Application of Multi-baseline Digital Close-range Photogrametry Technique in 3D Reconstruction of Underground Tomb.” Proceedings of 2010 International Conference on Test and Measurement (ICTM2010)-Phuket Thailand, 346,847–851.
- Xiaoyong, Z. H. I. 2005. “The Economic Life of Ancestors in Shang and Zhou Dynasties as Seen from the Clay Mound Tombs in South Anhui [J].” Southeast Culture[J] 04: 27–31.
- Yang, L., A. P. Pei, and N. N. Guo. 2012. “Spatial Modality of Prehistoric Settlement Sites in Luoyang Area.” ScientiaGeographicaSinica 32 (8): 993–999.
- Yang, Y. L. 2006. “3D Laser Scanning Technology Was Used to Protect Large Cultural Relics Sites for the First Time in China.” People’s Daily. http://news.xinhuanet.com/newscenter/2006-04/05/content_4384683.htm
- Zhou, L., and C. J. Mao. 2013. “The Application of 3D Laser Scanning Technique inTang Tomb located in Mengjin County.” Cultural Relics 3: 83–87.