
 ?Mathematical formulae have been encoded as MathML and are displayed in this HTML version using MathJax in order to improve their display. Uncheck the box to turn MathJax off. This feature requires Javascript. Click on a formula to zoom.
ABSTRACT
Mental illness is a predominant medical condition in Canada. Marginalized groups in the Canadian population such as those with low income, the poorly educated and ethnic minorities are susceptible to mental health disorders. Using mental health-related emergency department visits as an indicator of mental illness cases, we employ a Bayesian spatio-temporal regression model to estimate mental illness risk across the 35 public health units of Ontario, Canada from 2006 to 2017. The association between mental illness and the following marginalization-related factors: material deprivation, residential instability and ethnic concentration is also evaluated. Over the assessed period, the relative risk of mental illness ranged from 0.45 (95% CI: 0.44–0.46) to 3.29 (95% CI: 3.20–3.37). Health units with elevated levels of material deprivation and residential instability were positively associated with increased mental illness risk whilst areas with higher ethnic concentration were linked with lower risk. Findings showed that the temporal trend of risk continuously increased over the 11 year period, with health units in northern Ontario experiencing higher risk compared to southern units. The management of psychiatric disorders presents a significant challenge to the Canadian health-care system. An understanding of the geographic distribution of mental health risk across space and time can be useful for improved policy-making and public health monitoring.
Introduction
Psychiatric disorders (also referred to as mental health disorders or mental illnesses) are considered to be one of the most prevalent and debilitating conditions which negatively affect a person’s well-being (Durbin et al. Citation2015). It is defined as a disruption in a person’s thought process and perceptions, which as a result, impairs their ability to think and make decisions (Mood Disorders Society of Canada Citation2009). In Canada, mental illness is a significant public health problem. As pointed out by Pahwa et al. (Citation2012), almost 30% of the disability claims in Canada are related to mental health disorders with associated costs ranging between 15 USD billion and 33 USD billion annually. Dewa et al. (Citation2004) explained that on an annual basis approximately 12% of Canadians between the ages of 15 and 64 experience an onset of mental health disorders.
Over the last two decades, the spatial sciences have had an emerging role in the field of mental health. Bhana and Pillay (Citation1998) used a geographic information system (GIS) to map mental health facilities in South Africa for the purposes of planning and updating of local policies. A similar study by Foley and Platzer (Citation2007) used cartographic mapping for spatially analysing the distribution of mental health services across the boroughs of London, England. Through the use of map visualizations, Zhang et al. (Citation2011) utilized a frequentist linear regression analysis in combination with GIS to evaluate the effect of education and social well-being on mental health in Hawaii. Bayesian regression models have also been widely applied for the spatial statistical analysis of public health data and in particular for modelling the areal counts of diseases and illnesses (Lawson Citation2018; Eastwood et al. Citation2013). Through the use of Bayesian spatial analysis, both Takahashi et al. (Citation2017) and Law and Perlman (Citation2018) presented mental health-based epidemiologic studies of Japan and Toronto, Canada respectively. Persad (Citation2019a) and Marco et al. (Citation2018) discuss the numerous methodological advantages of Bayesian regression methods over frequentist approaches for spatial applications.
In this study, using mental health-related emergency department visits as an indicator of reported mental disorder cases, we examine the geographic and temporal variation of the illness in the region of Ontario – Canada’s most populous province. Specifically, a Bayesian spatio-temporal regression model is used to estimate and analyse the distribution of mental illness risk across the various public health units (PHUs) of Ontario over an 11 year period (2006–2017). Through regression analysis, we also investigate the relationship between mental illness and the following socio-economic and demographic marginalization factors: (1) material deprivation, (2) residential instability and (3) ethnic concentration.
Many persons suffering from mental health disorders belong to marginalized groups in society (Benbow Citation2009). A thorough understanding of the various factors which influence mental health is pertinent for policymaking and public health surveillance. Santana (Citation2002) found that persons of lower socio-economic status (i.e. those who experience material deprivation/poverty) were subject to higher rates of mental illness. Silva, Loureiro, and Cardoso (Citation2016) explained that it is important for political authorities to continuously monitor various population-based deprivation factors, for example, unemployment and financial strain levels. Through such monitoring, authorities can proactively intervene when there is a need to improve socio-economic conditions, which can in turn lead to the improved mental well-being of citizens.
Residential instability can be classified into two levels: the first level relates to lack of housing or homelessness, whilst the second level, perceived to be less severe, refers to high spatial mobility in living arrangements (Chafetz and Goldfinger Citation1984). Inflated house prices and increased rental rates in urbanized regions hamper the supply of affordable housing for the population. This forces re-location for underprivileged persons including those with psychiatric disabilities such as chronic mental illness (Chafetz and Goldfinger Citation1984). Persistent residential displacement and migration can lead to: (1) discontinuity in health-care treatment for existing mental health patients, thereby affecting their illness duration and severity and (2) elevated levels of mental health disorders due to social isolation and depression as a result of separation from relatives, friends and neighbours (Lix et al. Citation2006).
For over a century, Canada’s population policy has concentrated primarily on immigration (Ley and Hiebert Citation2001). Toronto, the capital of Ontario has one of the highest foreign-born populations amongst all major cities worldwide (Murdie and Ghosh Citation2010). Based on Canadian censuses in 2006, 2011 and 2016, there has been a steady increase in Ontario’s immigrant population, i.e. 28.3% in 2006, 28.5% in 2011 and 29.1% in 2016 (Statistics Canada Citation2017). Canada’s population is diverse from many perspectives, including cultural, racial, religious and linguistic (Naidoo Citation1992). Immigrant and visible minority groups in Canada are foreign-born, migrant settlers who have ethnic backgrounds which are non-Caucasian, excluding Aboriginal peoples (Matheson and van Ingen Citation2018). In the context of our study, ethnic concentration refers to the area-level density of persons belonging to immigrant and visible minority groups (for example, regions of high ethnic concentration are those areas where a large proportion of the population are members of immigrant and visible minority groups). Bécares, Dewey, and Das-Munshi (Citation2018) explained that regions of high ethnic concentration may aid in safeguarding minorities from racial and social prejudices given the greater level of communal support, thus possibly contributing towards a lower risk of mental illnesses. From a different viewpoint, Robert and Gilkinson (Citation2012) explained that issues such as pre-migration stressors (i.e. the immigration and resettlement process), in addition to post-migration stressors such as severance from family/friends, language differences, ethnic discrimination and unemployment can all potentially negatively affect the mental health of immigrants.
Material and methods
Data sources
The number of mental health emergency department visits between 2006 and 2017 by individuals aged 15 years and older were obtained from Public Health Ontario (Citation2019). We use this as an indicator of reported mental health cases in the province of Ontario. For the latter regression analysis, the counts of reported mental health cases serve as our response/dependent variable. Over the 11 year period, the data were accumulated for 2-year intervals on a biennial basis (i.e. 2006–2007, 2008–2009,…, 2016–2017). These cases consisted of patients who suffered from various mental illnesses in the following five general categories: mood disorders, anxiety disorders, substance-related disorders, schizophrenia/psychotic disorders and disorders of adult personality and behaviour (e.g. self-harming behaviours). Based on findings from an Ontario study (MHASEF Research Team Citation2018), it was shown that from 2006 to 2014, per 1000 population, substance-related (most frequent) and anxiety (second most frequent) disorders were the 2 main common causes for emergency visits, with both having increasing rates over the years. On the other hand, mood disorders were shown to be the third most frequent reason for emergency visits followed by disorders due to schizophrenia and self-harm respectively. Our study is based on the mental health count data for each of the 35 PHUs across Ontario. PHUs are local health administrative regions responsible for promoting health and disease prevention in Ontario (Statistics Canada Citation2019).
Three marginalization variables (material deprivation, residential instability and ethnic concentration) were used as covariates in the regression model to analyse the impact of inequities experienced by those with mental health disorders. This data was obtained from the publicly available Ontario Marginalization IndexFootnote1 (Matheson et al. Citation2012; Matheson and van Ingen Citation2018; Matheson Citation2017). For the time period considered in our study, three corresponding marginalization indices were available for the 2006, 2011 and 2016 population census years. We associated each of these indices to the chronologically closest mental health count data to ensure data comparability.
From 42 population census indicators, the marginalization index variables for each PHU were empirically generated using principal component factor analysis (Matheson et al. Citation2012). Indicators such as unemployment rates, as well as the proportion of the population aged 25 years and older without any high-school education were used for generating the material deprivation index variable. For residential instability, some of the indicators used included the proportion of the population who relocated within the past 5 years and the proportion of dwellings which are not owned. Two indicators were used to compute the ethnic concentration index variable: the proportion of the population who are recent immigrants and the proportion of the population who identify as a visible minority.
Prior to any analysis, we also verified that our selected covariates were not highly correlated. We followed Dormann et al. (Citation2013), in which the absolute pairwise correlation coefficients between covariates were used as a diagnostic of their linear relatedness/multicollinearity. This was checked by ensuring that their pairwise correlation coefficient did not exceed a threshold value. Dormann et al. (Citation2013) recommended a benchmark of 0.7 for which multicollinearity diagnostic thresholds are typically set. For our study, a threshold of 0.6 was applied. All of the pairwise correlation coefficients amongst our three selected marginalization index variables were below this threshold.
Spatio-temporal modelling
For spatio-temporal modelling, we adopted a Bayesian-based non-parametric regression model (Lawson Citation2004; Knorr-Held Citation2000). In contrast to a linear parametric space-time model, a non-parametric representation was used since it is a less-restrictive approach, providing a dynamic (i.e. non-linear) evolution of temporal trend for the spatial phenomena being observed (López-Quılez and Munoz Citation2009).
We assume that the reported mental illness cases are independent Poisson random variables with a Poisson likelihood for
PHU areal units and
biennial periods from 2006 to 2017, where
and
(Lawson Citation2014). The Poisson count data model is given by EquationEquation (1)
(1)
(1) , where
is the expected number of mental illness cases for each PHU
at each time period
and
is the relative risk of mental illness incidence for each PHU
at each time period
.
is the product of
(the overall mental illness rate for the entire region) and
(the population count of each PHU
at time
) (EquationEquation 2
(2)
(2) ) (Lawson Citation2018).
Following the non-parametric space-time relative risk formulation of Lawson (Citation2004), is defined by EquationEquation (3)
(3)
(3) . It is a function of several parameters:
is the intercept term;
(a spatially structured/correlated term) and
(a spatial heterogeneity/uncorrelated term) which are both area-specific random effects;
is the temporal trend random effect which provides an indication of the temporal variation of mental illness risk across all 35 PHUs;
is a space–time interaction random effect term. Random effects are commonly applied in statistical and epidemiological analysis to represent any unobserved effects not included in the model (Lawson Citation2013).
are the regression coefficients (i.e. fixed effects) of the marginalization covariates
, where
is material deprivation,
is residential instability and
is ethnic concentration.
Prior distributions and model fitting
Given that the spatio-temporal regression is Bayesian-based, each of the parameters in EquationEquation (3)(3)
(3) also has prior distribution specifications which define their role in relative risk estimation. Following Lawson, Browne, and Rodeiro (Citation2003), the intercept was assigned an improper uniform prior distribution:
and non-informative Gaussian priors were set for the regression coefficients:
.
We adopted the conditional autoregressive (CAR) spatial prior distribution for the spatially structured random effect (Besag, York, and Mollie Citation1991). This spatial prior supports the precise estimation of relative risk for mental illness since it imposes a form of local smoothing by borrowing strength from data associated with neighbouring areal units (Law and Perlman Citation2018). The CAR structure is a Gaussian Markov random field-based prior distribution with
and
, where
are PHU tracts that are adjacent neighbours of the
th PHU;
is an adjacency weight matrix which equals 1 if
and
are neighbours or equals 0 when otherwise; and
is a precision parameter. A zero mean normal distribution was used for the spatial heterogeneity term:
, where
is a precision parameter (Lawson Citation2014).
Following Lawson (Citation2004), for both of the temporally based parameters and
a random walk prior distribution was used. We use the random walk prior since it provides a non-parametric temporal trend effect for modelling the space-time count data (Lawson Citation2013). The random walk priors follow a Gaussian distribution where the mean parameter is related to the previous point in time:
and
. For the precision parameters of the spatial and temporal random effects, a non-informative uniform distribution was used:
,
,
,
(Rotejanaprasert and Lawson Citation2018).
The model was fitted using Markov Chain Monte Carlo simulations (Lunn et al. Citation2012). This was done via the R programming language, the WinBUGS software (Lunn et al. Citation2000) and the R2WinBUGS package (Sturtz, Ligges, and Gelman Citation2005). For model fitting, we generated three Markov chains at 500,000 iterations each and discarded the first 50,000 iterations as the non-stationary, ‘burn-in’ phase. Model convergence was monitored using autocorrelation graphs, trace plots and the Gelman–Rubin convergence diagnostic (Law and Perlman Citation2018).
As an indication of the goodness-of-fit of the spatio-temporal model to the data, we followed Anderson and Ryan (Citation2017) and adopt the use of the spatio-temporal Moran’s I statistic ( for assessing model residuals
, i.e. the difference between observed (
) and fitted (
) values of mental illness case counts. We utilized Griffith’s formulation of
(Griffith Citation1981) which combines the Moran’s I statistic used for measuring spatial autocorrelation with the Durbin–Watson temporal autocorrelation statistic (EquationEquation (4)
(4)
(4) ). The range of
is between -1 and +1 and 0 is indicative of spatial randomness. The spatio-temporal model produced a
value of 0.024 indicating minimal space-time autocorrelation in the residuals.
where is a spatio-temporal adjacency weight matrix representing the relation between neighbouring PHU areal units and
. We note that
due to the temporal invariance amongst adjacent regions of the PHU areal units.
Results
Regression analysis
The parameter estimates of the spatio-temporal regression are presented in . For each parameter, the mean of its posterior distribution is used as a point estimate and the standard deviation (SD) is representative of parameter uncertainty. The 95% credible interval is the 95% probability that the parameter lies between the interval defined by an upper and lower bound. The Monte Carlo (MC) error value reflects the accuracy of estimated parameters and should generally be less than 5% of the parameter’s SD (Persad Citation2019a). The MC errors of estimated parameters in this study were less than 5% of their respective SDs.
Table 1. Spatio-temporal regression model parameter statistics.
Regression coefficients of the fixed effect parameters explain their impact on the response variable. To determine the statistical significance of parameters and relevance to the response variable, we use the posterior probability of the parameter being different from zero (i.e. the posterior probability of parameter being either positive or negative is greater than 90%) (Gracia et al. Citation2017; Persad Citation2019b). The probability of covariates and
being positive was both greater than 90% (i.e.
96.7% and
92.2%), whilst the probability of covariate
being negative was also greater than 90% (i.e.
99.1%). As shown in by the sign of the regression coefficients,
and
had a positive association with reported mental health cases whereas
had a negative association. Hence, PHUs with higher levels of material deprivation, higher levels of residential instability and lower levels of ethnic concentration are more inclined to experience a greater mean amount of mental health cases and higher relative risk. From , the magnitude of the precision parameters of the random effect terms (
,
,
,
provides insight into the overall-estimated risk structure (Besag, York, and Mollie Citation1991). The spatial heterogeneity term
had the most influence on mental health risk in comparison to the other random effects.
Spatio-temporal risk analysis
The relative risk of mental health incidence across Ontario over the biennial periods from 2006 to 2017 is visualized on the maps in where darker areas represent PHUs with higher risk and lighter areas are those with lower risk. PHUs with a relative risk of more than 1.0 indicate that the population in such spatial units are at an increased risk for developing mental health illnesses due to incidence frequencies which are greater than the average of the entire region (Persad Citation2019b). Over the years, it is evident from that the northern PHUs generally had higher levels of risk in comparison to the southern PHUs. As indicated by the gradual darkening of both northern and southern PHUs with the progression of time, it can be inferred that there was a general increase in the risk of mental illness incidence across the province during the assessed period. Overall PHUs from 2006 to 2017, the relative risk of mental illness ranged from 0.45 (95% CI: 0.44–0.46) to 3.29 (95% CI: 3.20–3.37).
Figure 1. Relative risk maps of mental illness for PHUs in Ontario, Canada (2006–2017).
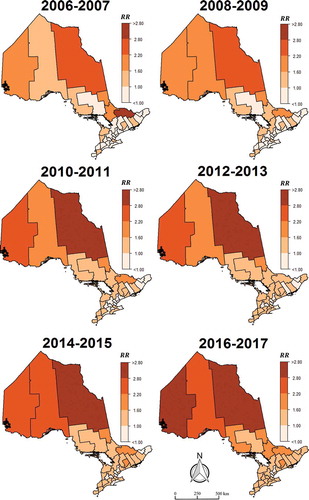
Figure 2. Spatial and temporal effects. (a) Map of spatial pattern for mental illness risk . (b) Exceedance probability map for risk due to spatial trend
:
. (c) Temporal trend of mental illness risk in Ontario:
.
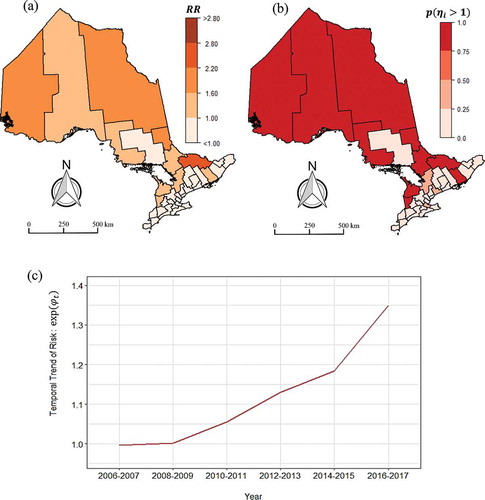
The spatial risk trend is depicted in ), while ) is the corresponding exceedance probability map for
. Exceedance probabilities are used to highlight the spatial units where the posterior probability of mental illness risk is greater than 1. Exceedance probabilities nearer to 1.0 are useful in highlighting ‘hot-spots’ with higher risk (Persad Citation2019a). From ), it is noticeable mental illness risk due to the spatial random effect terms (i.e. both the spatially correlated and spatial heterogeneity terms) had more impact in the northern PHUs compared to the southern areal units. ) shows the temporal trend for mental illness risk, which increased from 2006 to 2017. Based on the plot in ), there was a steady increase in mental illness risk from 2008 to 2015. However, a sharp further increase in the risk trend was observed from 2015 to 2017.
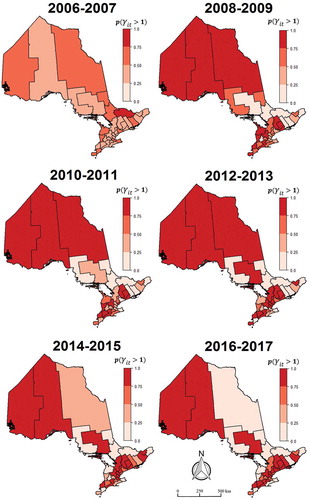
illustrates the exceedance probability maps for mental illness risk owing to space–time interaction . A number of southern PHUs show evidence of risk greater than 1.0 due to space–time interaction. During the periods 2008–2009, 2010–2011 and 2012–2013, the three northern-most PHUs had relative risks which were greater than 1.0 based on the space–time interaction random effect.
Discussion
Our results have shown that material deprivation, residential instability and ethnic concentration were associated with mental illness risk in Ontario over the evaluated time frame. The positive association between increased risk of mental illness and material deprivation due to factors such as unemployment and low-income levels is also consistent with preceding studies. In an epidemiological study based on population data from United States (US) residents, Kawachi and Kennedy (Citation1999) found that increased rates of income inequality also increased people’s stress levels. In a cross-sectional European study by Dreger, Buck, and Bolte (Citation2014) consisting of approximately 44,000 persons from 34 countries, higher levels of material deprivation showed an increased risk for poor positive mental health.
Figure 3. Exceedance probability maps for space-time interaction .
Kearns et al. (Citation2013) investigated the psychosocial pathways affecting mental well-being due to material deprivation from a spatial context. Interestingly, their research showed that individual income levels alone did not affect mental health but also the relative location of one’s home. Their findings, which were based on regression analysis using survey data from 4,615 residents in Glasgow, United Kingdom, revealed that lower-income persons residing in regions where the local neighbouring population had higher incomes showed increased mental well-being. Kearns et al. (Citation2013) explained that living in close proximity to high earners offered the low earners the perception of neighbourhood progression and the feeling of residing in ‘regular’, non-stigmatized areas and hence the positive effect on their mental state.
Overall, the cause and effect connection between mental health and material deprivation is a complex subject matter. Effects arising from material deprivation such as poverty can negatively affect psychological and emotional health leading to states of depression, frustration and despair (Kuruvilla and Jacob Citation2007). From a general perspective, our study reinforces the need for health service planners and policymakers to recognize that deprivation-related issues such as poor income and education levels are potential negative influencers for good mental health.
Our results also revealed that Ontario PHUs with higher amounts of residential instability are possibly linked with elevated levels of mental illness. Previous studies have shown that there is a tendency for individuals with mental illness to have a frequent change of residence (Hopper et al. Citation1997; Dembling et al. Citation2002). DeVerteuil et al. (Citation2007) explained that those with mental illnesses typically migrate into regions where there is a predominant dependence on welfare assistance and other mental health-related services. Motives for moving on a regular basis by persons with mental illnesses have been attributed to the availability of income and health assistance services in addition to poor prospects for employment and cheaper housing rates (DeVerteuil et al. Citation2007).
Our analysis showed that the ethnic concentration variable had a negative association with mental illness risk. Similar findings were found in an epidemiological study by Salas-Wright et al. (Citation2018). Their results were based on a population survey of 36,309 adults consisting of immigrants and individuals born in the US. A logistic regression model was used to assess the association between immigrants and mental illness. Contrary to the belief that stressors related to the immigration and naturalization process can induce mental disorders, Salas-Wright et al. (Citation2018) explained that in comparison to US-born persons, mental illness was less prevalent amongst immigrant adults. However, similar rates of mental disorders were observed for both US-born residents and immigrants who migrated as adolescents. Separate studies by Takeuchi et al. (Citation2007) and Williams et al. (Citation2007) presented differing results for specific immigrant groups, namely Asian Americans and Black Caribbean populations in the US respectively. Both of these studies utilized logistic regression statistical analysis based on population survey data and showed that mental disorders were associated with immigrants from both ethnicities.
From a Canadian context, our findings were in accordance with Matheson et al. (Citation2012). Their study used logistic regression modelling with data from a cross-sectional Canadian health survey and showed that persons residing in Canadian regions with high material deprivation and residential instability were significantly associated with poor mental health. Matheson et al. (Citation2012) also showed that people living in areas of higher ethnic concentration were associated with better mental health. However, this could be a distorted perception of the reality in Canada. In an Ontario-based study, Chiu et al. (Citation2018) discussed that there was an underutilization of mental health services by immigrant and visible minorities. As a result, this may contribute towards a lower number of reported mental illness cases in areas of higher ethnic concentration. Reasons which contribute towards the lack of service use by immigrant and visible minorities include fear and stigmatization (McKenzie et al. Citation2016). McKenzie et al. (Citation2016) explained that: (i) some are concerned/fearful that being diagnosed with mental illness could lead to a host of problems ranging from negatively affecting their immigration status in Canada to having their children taken from them by social services, and (ii) mental health issues are stigmatized across different cultures and as such, persons may believe that seeking aid would humiliate themselves and family.
Another possible explanation for lower mental illness risk in regions of high ethnic concentration is linked to the widely known phenomena referred to as the ‘healthy immigrant effect’, whereby new immigrants would typically have better physical and mental health in comparison to the non-immigrant population (Lou and Beaujot Citation2005). Canada’s immigration process requires that foreign-born applicants undergo extensive medical examinations, have higher education levels, as well as possess professional skills and work experience to aid in employability post-migration (Vang et al. Citation2015). These stringent requirements thereby favour the selection of immigrants with good physical and mental health (Lou and Beaujot Citation2005).
Considerable amounts of immigrants/newcomers to Canada typically settle and reside in Southern Ontario (Di Biase and Bauder Citation2005). The association of lower mental illness risk with ethnically dense areas also corresponds to the spatial distribution of risk illustrated in , i.e. risk is generally higher in Northern Ontario compared to Southern Ontario, where the latter region typically has higher amounts of persons belonging to immigrant and visible minority groups. Chiu et al. (Citation2018) pointed out that high proportions of visible minorities in Ontario reside within ethnic enclaves and this source of ethnocultural social support can also positively influence the state of their mental well-being.
Higher levels of mental health risk in Northern Ontario health units can possibly be attributed to certain geographic and ethnographic characteristics of the region. The landscape of Northern Ontario is primarily rural with cold, sub-arctic winters and home to a large indigenous, aboriginal population who reside in many of the region’s small, isolated, remote communities (Rourke Citation2002). A large number of these communities are void of road access and connection with other settlements, and as highlighted by Danto and Walsh (Citation2017), many of the residents also suffer from mental health-related problems such as suicide and substance abuse. Canada’s legacy of colonial oppression and institutional racism, as well as lack of access to healthcare and social services in rural Northern Ontario, have all negatively affected the mental health of Aboriginal residents (Lavallee and Poole Citation2010; Richmond, Ross, and Bernier Citation2007).
Our study has several limitations including the need for stratified analysis amongst different age, gender and ethnic groups. This can provide further insights into the potential mechanisms related to mental health risk in the province of Ontario. Furthermore, given that our study is observational/epidemiological in nature, it is difficult to generalize our findings to other Canadian regions with different geographies and demographic attributes.
We utilized administrative health data for assessing mental illness; thus, it is pertinent to acknowledge the potential limitations when using such data. This was highlighted by Davis, Sudlow, and Hotopf (Citation2016) who explained that there can be potential variation in the accuracy of mental health diagnoses from administrative data sources. Their research analysed administrative data from 39 selected prior studies and revealed that anxiety-related disorders showed lower diagnostic sensitivity compared to psychotic-based disorders. Therefore, we note that it is important for future work to focus on aspects related to the validation of source diagnostic mental health data.
In terms of benefits of our study, the applied Bayesian space-time modelling strategy offers numerous inherent advantages such as: (i) the inclusion of spatial and temporal random effects which serve as surrogates for any potential unobserved/unmeasured covariates, and (ii) the use of a spatial Markov random field prior which provides ‘stabilized’ risk estimation via a spatially weighted smoothing through the use of information from adjacent PHUs (Persad Citation2019a).
Another benefit of this study is in its potential use for public health administration. To illustrate this, the relative risk maps shown in are useful in highlighting areal units with persistent elevated risk over the years and can be useful for disease surveillance and focussed monitoring in the province. More specifically, an understanding of the spatial distribution of mental illness risk can be used by the relevant authorities for geographically targeted interventions in higher risk areas where there may be greater demand for health services. This guided approach can possibly help health agencies in Ontario to strategically prioritize the allocation of limited health-care resources (e.g. redirection of funding) to specific geographic regions. Insights on the geographic variation of risk can aid in the decision-making processes for the implementation of programmes, initiatives and policies related to the management of psychiatric disorders in different PHUs across the province.
We also analysed and discussed different marginalization factors which impact mental illness risk. Improved understanding of these contextual factors can potentially have important implications for mental health policy and planning. For instance, our findings showed that there was a negative association between mental illness risk and areas of higher ethnic concentration. However, we discussed that this dynamic was a possible reflection of the underuse of mental health-care services amongst immigrant and visible minority groups due to stigmatization. Therefore, to mitigate this problem, policymakers can establish anti-stigma campaigns/initiatives for mental health in ethnocultural communities. Results also showed a positive association between mental illness and socioeconomic inequality factors including material deprivation and residential instability. Examples of potential implications from such findings include reformed government assistance policies/plans directed towards improved public welfare and subsidized housing programmes, as well as the expansion of employment services for finding jobs and provision of training needed to find work.
Conclusion
Our study presented a Bayesian space-time analysis of mental health risk in the Canadian province of Ontario over biennial periods from 2006 to 2017. The study also explored the association between mental illness and the following marginalization factors: (1) material deprivation, (2) residential instability and (3) ethnic concentration. Results showed that areal units with elevated levels of both material deprivation and residential instability were positively associated with higher mental illness risk, whilst regions of higher ethnic concentration were linked with lower mental illness risk.
Over the assessed time frame, the relative risk of mental illness ranged from 0.45 (95% CI: 0.44–0.46) to 3.29 (95% CI: 3.20–3.37). Through spatial visualization, it was evident that PHUs in northern Ontario had elevated risk levels in comparison to those in the southern region of the province. Findings also showed that the temporal trend of mental illness risk continuously increased from 2006 to 2017. Future work will investigate alternative space-time modelling approaches to confirm the findings of this study, as well as a stratified analysis based on varying age, gender and ethnic groups.
Acknowledgements
Some of the data that support the findings of this study were obtained from the Public Health Ontario and Statistics Canada data portals. This research was not associated with Public Health Ontario or Statistics Canada, and all results, inferences and opinions are solely from the author. This study contains information licensed under the Open Government Licence – Ontario and contains information licensed under the Open Government Licence – Canada.
Disclosure statement
No potential conflict of interest was reported by the author.
Additional information
Funding
Notes
References
- Anderson, C., and L. Ryan. 2017. “A Comparison of Spatio-temporal Disease Mapping Approaches Including an Application to Ischaemic Heart Disease in New South Wales, Australia.” International Journal of Environmental Research and Public Health 14: 146.
- Bécares, L., M. E. Dewey, and J. Das-Munshi. 2018. “Ethnic Density Effects for Adult Mental Health: Systematic Review and Meta-analysis of International Studies.” Psychological Medicine 48 (12): 2054–2072. doi:10.1017/S0033291717003580.
- Benbow, S. 2009. “Societal Abuse in the Lives of Individuals with Mental Illness.” Canadian Nurse 105 (6): 30-32.
- Besag, J., J. York, and A. Mollie. 1991. “Bayesian Image Restoration, with Two Applications in Spatial Statistics.” The Annals of the Institute of Statistical Mathematics 43 (1): 1–20. doi:10.1007/BF00116466.
- Bhana, A., and Y. G. Pillay. 1998. “The Use of the Geographical Information System (GIS) to Determine Potential Access and Allocation of Public Mental Health Resources in KwaZulu-Natal.” South African Journal of Psychology 28 (4): 222–233. doi:10.1177/008124639802800405.
- Chafetz, L., and S. M. Goldfinger. 1984. “Residential Instability in a Psychiatric Emergency Setting.” Psychiatric Quarterly 56 (1): 20–34. doi:10.1007/BF01324629.
- Chiu, M., A. Amartey, X. Wang, and P. Kurdyak. 2018. “Ethnic Differences in Mental Health Status and Service Utilization: A Population-based Study in Ontario, Canada.” The Canadian Journal of Psychiatry 63 (7): 481–491. doi:10.1177/0706743717741061.
- Danto, D., and R. Walsh. 2017. “Mental Health Perceptions and Practices of A Cree Community in Northern Ontario: A Qualitative Study.” International Journal of Mental Health and Addiction 15 (4): 725–737. doi:10.1007/s11469-017-9791-6.
- Davis, K. A., C. L. Sudlow, and M. Hotopf. 2016. “Can Mental Health Diagnoses in Administrative Data Be Used for Research? A Systematic Review of the Accuracy of Routinely Collected Diagnoses.” BMC Psychiatry 16 (1): 263. doi:10.1186/s12888-016-0963-x.
- Dembling, B. P., V. Rovnyak, S. Mackey, and M. Blank. 2002. “Effects of Geographic Migration on SMI Prevalence Estimates.” Mental Health Services Research 4: 7–12. doi:10.1023/A:1014041024787.
- DeVerteuil, G., A. Hinds, L. Lix, J. Walker, R. Robinson, and L. L. Roos. 2007. “Mental Health and the City: Intra-urban Mobility among Individuals with Schizophrenia.” Health & Place 13 (2): 310–323. doi:10.1016/j.healthplace.2006.02.001.
- Dewa, C. S., A. Lesage, P. Goering, and M. Caveen. 2004. “Nature and Prevalence of Mental Illness in the Workplace.” Healthcare Papers 5 (2): 12–25. doi:10.12927/hcpap.16820.
- Di Biase, S., and H. Bauder. 2005. “Immigrant Settlement in Ontario: Location and Local Labour Markets.” Canadian Ethnic Studies 37 (3): p.114.
- Dormann, C. F., J. Elith, S. Bacher, C. Buchmann, G. Carl, G. Carré, J. R. G. Marquéz, et al. 2013. “Collinearity: A Review of Methods to Deal with It and a Simulation Study Evaluating Their Performance.” Ecography 36 (1): 27–46. doi:10.1111/j.1600-0587.2012.07348.x.
- Dreger, S., C. Buck, and G. Bolte. 2014. “Material, Psychosocial and Sociodemographic Determinants are Associated with Positive Mental Health in Europe: A Cross-sectional Study.” BMJ Open 4 (5): e005095. doi:10.1136/bmjopen-2014-005095.
- Durbin, A., R. Moineddin, E. Lin, L. S. Steele, and R. H. Glazier. 2015. “Examining the Relationship between Neighbourhood Deprivation and Mental Health Service Use of Immigrants in Ontario, Canada: A Cross-sectional Study.” BMJ Open 5 (3): e006690. doi:10.1136/bmjopen-2014-006690.
- Eastwood, J. G., B. B. Jalaludin, L. A. Kemp, H. N. Phung, and B. E. Barnett. 2013. “Immigrant Maternal Depression and Social Networks. A Multilevel Bayesian Spatial Logistic Regression in South Western Sydney, Australia.” Spatial and Spatio-temporal Epidemiology 6: 49–58. doi:10.1016/j.sste.2013.04.003.
- Foley, R., and H. Platzer. 2007. “Place and Provision: Mapping Mental Health Advocacy Services in London.” Social Science & Medicine 64 (3): 617–632. doi:10.1016/j.socscimed.2006.09.014.
- Gracia, E., A. López-Quílez, M. Marco, and M. Lila. 2017. “Mapping Child Maltreatment Risk: A 12-year Spatio-temporal Analysis of Neighborhood Influences.” International Journal of Health 16: 38. doi:10.1186/s12942-017-0111-y.
- Griffith, D. A. 1981. “Interdependence in Space and Time: Numerical and Interpretative Considerations.” Dynamic Spatial Models 1: 258–287.
- Hopper, K., J. Jost, T. Hay, S. Welber, and G. Haughland. 1997. “Homelessness, Severe Mental Illness, and the Institutional Circuit.” Psychiatric Services 48: 659–665.
- Kawachi, I., and B. P. Kennedy. 1999. “Income Inequality and Health: Pathways and Mechanisms.” Health Services Research 34: 215–227.
- Kearns, A., E. Whitley, L. Bond, M. Egan, and C. Tannahill. 2013. “The Psychosocial Pathway to Mental Well-being at the Local Level: Investigating the Effects of Perceived Relative Position in a Deprived Area Context.” Journal of Epidemiology and Community Health 67 (1): 87–94. doi:10.1136/jech-2011-200415.
- Knorr-Held, L. 2000. “Bayesian Modeling of Inseparable Space-time Variation in Disease Risk.” Statistics in Medicine 19: 2555–2567.
- Kuruvilla, A., and K. S. Jacob. 2007. “Poverty, Social Stress & Mental Health.” Indian Journal of Medical Research 126 (4): 273.
- Lavallee, L. F., and J. M. Poole. 2010. “Beyond Recovery: Colonization, Health and Healing for Indigenous People in Canada.” International Journal of Mental Health and Addiction 8 (2): 271–281. doi:10.1007/s11469-009-9239-8.
- Law, J., and C. Perlman. 2018. “Exploring Geographic Variation of Mental Health Risk and Service Utilization of Doctors and Hospitals in Toronto: A Shared Component Spatial Modeling Approach.” International Journal of Environmental Research and Public Health 15 (4): 593. doi:10.3390/ijerph15040593.
- Lawson, A. B. 2004. “Some Considerations in the Spatio-temporal Analysis of Public Health Surveillance Data.” In Monitoring the Health of Populations: Statistical Principles and Methods for Public Health Surveillance, Chapter 11:289-314, edited by R. Brookmeyer and D. Stroup. Oxford: Oxford University Press.
- Lawson, A. B. 2013. Statistical Methods in Spatial Epidemiology. New York: John Wiley & Sons.
- Lawson, A. B. 2014. “Hierarchical Modeling in Spatial Epidemiology.” Wiley Interdisciplinary Reviews. Computational Statistics 6 (6): 405–417. doi:10.1002/wics.1315.
- Lawson, A. B. 2018. Bayesian Disease Mapping: Hierarchical Modeling in Spatial Epidemiology. 3rd ed. Boca Raton, FL: Chapman and Hall/CRC.
- Lawson, A. B., W. J. Browne, and C. L. V. Rodeiro. 2003. Disease Mapping with WinBUGS and MLwiN. Vol. 11. London: Wiley.
- Ley, D., and D. Hiebert. 2001. “Immigration Policy as Population Policy.” The Canadian Geographer 45 (1): 120–125. doi:10.1111/j.1541-0064.2001.tb01175.x.
- Lix, L. M., A. Hinds, G. DeVerteuil, J. R. Robinson, J. Walker, and L. L. Roos. 2006. “Residential Mobility and Severe Mental Illness: A Population-based Analysis.” Administration and Policy in Mental Health and Mental Health Services Research 33 (2): 160. doi:10.1007/s10488-006-0035-5.
- López-Quılez, A., and F. Munoz 2009. “Review of Spatio-temporal Models for Disease Mapping.” In Final report for the EUROHEIS 2 project. Accessed October 25 2019. http://www.uv.es/~famarmu/doc/Euroheis2-report.pdf
- Lou, Y., and R. Beaujot. 2005. “What Happens to the ‘Healthy Immigrant Effect’: The Mental Health of Immigrants to Canada.” PSC Discussion Papers Series 19 (15): 1. Accessed May 11 2020. https://ir.lib.uwo.ca/cgi/viewcontent.cgi?article=1031&context=pscpapers
- Lunn, D., C. Jackson, N. Best, D. Spiegelhalter, and A. Thomas. 2012. The BUGS Book: A Practical Introduction to Bayesian Analysis. Boca Raton, FL: Chapman and Hall/CRC.
- Lunn, D. J., A. Thomas, N. Best, and D. Spiegelhalter. 2000. “WinBUGS-a Bayesian Modelling Framework: Concepts, Structure, and Extensibility.” Statistics and Computing 10: 325–337. doi:10.1023/A:1008929526011.
- Marco, M., E. Gracia, A. López-Quílez, and M. Lila. 2018. “What Calls for Service Tell Us about Suicide: A 7-year Spatio-temporal Analysis of Neighborhood Correlates of Suicide-related Calls.” Scientific Reports 8 (1): 6746. doi:10.1038/s41598-018-25268-0.
- Matheson, F. I. 2017. Ontario Agency for Health Protection and Promotion (Public Health Ontario). 2011 Ontario Marginalization Index. Toronto, ON: St. Michael’s Hospital. 2017. Joint publication with Public Health Ontario.
- Matheson, F. I., J. R. Dunn, K. L. Smith, R. Moineddin, and R. H. Glazier. 2012. “Development of the Canadian Marginalization Index: A New Tool for the Study of Inequality.” Canadian Journal of Public Health/Revue Canadienne De Sante’e Publique S12–S16. doi:10.1007/BF03403823.
- Matheson, F. I., and T. van Ingen. 2018. 2016 Ontario Marginalization Index: User Guide. Toronto, ON: St. Michael’s Hospital. 2018. Joint publication with Public Health Ontario.
- McKenzie, K., B. Agic, A. Tuck, and M. Antwi 2016. “The Case for Diversity: Building the Case to Improve Mental Health Services for Immigrant, Refugee, Ethno-cultural and Racialized Populations.” Report to the Mental Health Commission of Canada. Ottawa: National Library of Canada. Accessed May 11 2020. https://www.mentalhealthcommission.ca/sites/default/files/2016-10/case_for_diversity_oct_2016_eng.pdf
- MHASEF Research Team. 2018. Mental Health and Addictions System Performance in Ontario: A Baseline Scorecard. Toronto, ON: Institute for Clinical Evaluative Sciences. ISBN: 978-1-926850-79-5 (Online). Accessed May 12 2020. https://www.ices.on.ca/~/media/Files/Atlases-Reports/2018/MHASEF/Report.ashx
- Mood Disorders Society of Canada. 2009. Quick Facts: Mental Illness and Addiction in Canada. 3rd ed. Belleville, ON: Mood Disorders Society of Canada.
- Murdie, R., and S. Ghosh. 2010. “Does Spatial Concentration Always Mean a Lack of Integration? Exploring Ethnic Concentration and Integration in Toronto.” Journal of Ethnic and Migration Studies 36 (2): 293–311. doi:10.1080/13691830903387410.
- Naidoo, J. C. 1992. “The Mental Health of Visible Ethnic Minorities in Canada.” Psychology and Developing Societies 4 (2): 165–186. doi:10.1177/097133369200400205.
- Pahwa, P., C. P. Karunanayake, J. McCrosky, and L. Thorpe. 2012. “Longitudinal Trends in Mental Health among Ethnic Groups in Canada.” Chronic Diseases and Injuries in Canada 32 (3): 164-176.
- Persad, R. A. 2019a. “Hierarchical Bayesian Modeling for the Spatial Analysis of Robberies in Toronto, Canada.” Spatial Information Research 28 (2): 1–13.
- Persad, R. A. 2019b. “Bayesian Space–Time Analysis of Brain Cancer Incidence in Southern Ontario, Canada: 2010–2013.” Medical Sciences 7 (12): 110. doi:10.3390/medsci7120110.
- Public Health Ontario. 2019. “Health Inequities in Mental Health Emergency Department Visits 2006–16. Toronto, ON: Ontario Agency for Health Protection and Promotion; 2019 May 22 [2019 Jun 30].” https://www.publichealthontario.ca/en/data-and-analysis/health-equity/mental-health-er-visits
- Richmond, C. A. M., N. A. Ross, and J. Bernier. 2007. “Exploring Indigenous Concepts of Health: The Dimensions of Métis and Inuit Health.” In Aboriginal Policy Research: Directions and Outcomes, edited by J. White, D. Beavon, S. Wingert, and P. Maxim, 313. Vol. 4. Toronto: Thompson Educational Publishing.
- Robert, A., and T. Gilkinson. 2012. Mental Health and Well-being of Recent Immigrants in Canada: Evidence from the Longitudinal Survey of Immigrants to Canada Ottawa. Canada: Citizenship and Immigration Canada.
- Rotejanaprasert, C., and A. Lawson. 2018. “A Bayesian Quantile Modeling for Spatiotemporal Relative Risk: An Application to Adverse Risk Detection of Respiratory Diseases in South Carolina, USA.” International Journal of Environmental Research and Public Health 15 (9): 2042. doi:10.3390/ijerph15092042.
- Rourke, J. T. 2002. “Building the New Northern Ontario Rural Medical School.” Australian Journal of Rural Health 10 (2): 112–116. doi:10.1111/j.1440-1584.2002.tb00019.x.
- Salas-Wright, C. P., M. G. Vaughn, T. C. Goings, D. P. Miller, and S. J. Schwartz. 2018. “Migrants and Mental Disorders in the United States: New Evidence on the Healthy Migrant Hypothesis.” Psychiatry Research 267: 438–445. doi:10.1016/j.psychres.2018.06.039.
- Santana, P. 2002. “Poverty, Social Exclusion and Health in Portugal.” Social Science & Medicine 55 (1): 33–45. doi:10.1016/S0277-9536(01)00218-0.
- Silva, M., A. Loureiro, and G. Cardoso. 2016. “Social Determinants of Mental Health: A Review of the Evidence.” The European Journal of Psychiatry 30 (4): 259–292.
- Statistics Canada. 2017. “Focus on Geography Series, 2016 Census.” Statistics Canada Catalogue no. 98-404-X2016001. Ottawa, Ontario. Data products, 2016 Census. Accessed May 16 2020. https://www12.statcan.gc.ca/census-recensement/2016/as-sa/fogs-spg/Facts-PR-Eng.cfm?TOPIC=7&LANG=Eng&GK=PR&GC=35#sec-geo-dq
- Statistics Canada. 2019. “Health Region Boundary Files [Internet], 2011 [Cited September 15th, 2019].” Accessed February 17 2019. https://www150.statcan.gc.ca/n1/pub/82-402-x/2011001/reg-eng.htm
- Sturtz, S., U. Ligges, and A. Gelman. 2005. “R2WinBUGS: A Package for Running WinBUGS from R.” Journal of Statistical Software 12: 1–16. doi:10.18637/jss.v012.i03.
- Takahashi, K., H. Tachimori, C. Kan, D. Nishi, Y. Okumura, N. Kato, and T. Takeshima. 2017. “Spatial Analysis for Regional Behavior of Patients with Mental Disorders in Japan.” Psychiatry and Clinical Neurosciences 71 (4): 254–261. doi:10.1111/pcn.12488.
- Takeuchi, D. T., N. Zane, S. Hong, D. H. Chae, F. Gong, G. C. Gee, E. Walton, S. Sue, and M. Alegría. 2007. “Immigration-related Factors and Mental Disorders among Asian Americans.” American Journal of Public Health 97 (1): 84–90. doi:10.2105/AJPH.2006.088401.
- Vang, Z., J. Sigouin, A. Flenon, and A. Gagnon. 2015. “The Healthy Immigrant Effect in Canada: A Systematic Review.” Population Change and Lifecourse Strategic Knowledge Cluster Discussion Paper Series 3 (1): 4. Accessed May 13 2020. https://ir.lib.uwo.ca/cgi/viewcontent.cgi?article=1012&context=pclc
- Williams, D. R., R. Haile, H. M. Gonzalez, H. Neighbors, R. Baser, and J. S. Jackson. 2007. “The Mental Health of Black Caribbean Immigrants: Results from the National Survey of American Life.” American Journal of Public Health 97 (1): 52–59. doi:10.2105/AJPH.2006.088211.
- Zhang, W., Q. Chen, H. McCubbin, L. McCubbin, and S. Foley. 2011. “Predictors of Mental and Physical Health: Individual and Neighborhood Levels of Education, Social Well-being, and Ethnicity.” Health & Place 17 (1): 238–247. doi:10.1016/j.healthplace.2010.10.008.
Appendix
and provide population and coverage area details for the 35 different public health units (PHUs) across Ontario. The population mean and standard deviation (SD) in were computed using census data (2006–2017) from Public Health Ontario (Citation2019).
Figure A1. Map of Ontario PHUs (IDs correspond to ).
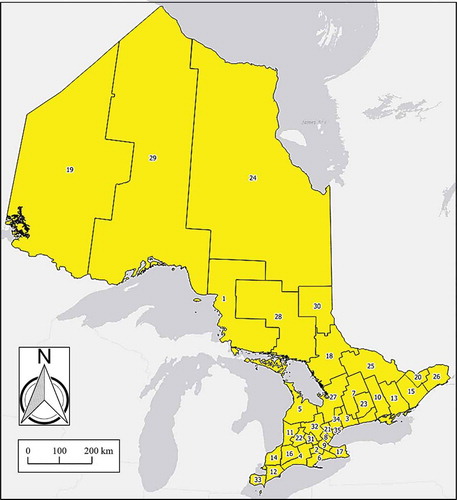
Table A1. Population (number of residents) and coverage area for PHUs in Ontario from 2006 to 2017 (IDs correspond to ).