
ABSTRACT
Urban physical environments are the physical settings and built environments in neighbourhoods and cities which provide places for human activities. Evidence suggests that there are substantial associations between urban physical environments and various health outcomes, e.g. people’s physical activities might be influenced by surrounding physical environments, thereby affecting their health behaviours; more exposure to urban physical environments may benefit human mental health. Street view imagery enables us to capture the landscape at eye-level, making it a promising data source for observing and analysing the realistic dynamics of urban physical environments. Compared with traditional in-person assessments and field observations, street view imagery-based data collection is relatively time-effective and cost-effective. Researchers from epidemiology, psychology, and geography have used street view imagery to quantify the built environment and understand its impacts on public health. To summarize current research trends, this paper systematically reviews the use of street view images for sensing urban environments in public health studies. Specifically, we describe the characteristics of street view imagery and review the methodology for image processing and semantic understanding. We then summarize the challenges that remain for quantifying urban environments in terms of data and methodology. Several future research directions that would benefit public health research and practices are recommended in urban environment research.
1. Introduction
The past few decades have witnessed the rapid development of cities around the world. More than 50% of the world’s population and 70–80% of economic activities take place in urban areas, which not only brings opportunities to residents’ work and lives but also brings challenges for sustainable urban development (Schneider, Friedl, and Potere Citation2010; Lu, Sarkar, and Xiao Citation2018). The urban physical environment plays an important role in affecting residents’ physical activities and social life. People prefer to live in nice places and spend most of their time in interactions in neighbourhood environments (Saelens and Handy Citation2008; Wang et al. Citation2019b; Pliakas et al. Citation2017; Zhang et al. Citation2020). Effectively measuring and quantifying the urban environment is therefore crucial in improving citizens’ satisfaction with their living environments, promoting sustainable city development, and modelling human-environment interactions (Knox, Marston, and Imort Citation2016; Su et al. Citation2017; Wang Citation2020).
Previous literature has shown a strong connection between the urban physical environment and various health behaviours of its citizens (Naik et al. Citation2014; Helbich et al. Citation2019; Svoray et al. Citation2018; McMichael Citation2000; Lopez and Hynes Citation2006; Leslie and Cerin Citation2008; Leon Citation2008; Sun et al. Citation2020). As such, researchers in epidemiology, psychology, and geography have increasingly examined the effects of the built environment on various health outcomes (Ulrich Citation1979, Citation1984; Abraham, Sommerhalder, and Abel Citation2010; Kaplan Citation1995; Hartig et al. Citation2014; Subiza-Pérez, Vozmediano, and San Juan Citation2019). For example, researchers have investigated the associations between urban environment and different human physical behaviours (such as walking and cycling preferences) (Sallis et al. Citation2012; Lee and Buchner Citation2008; Li et al. Citation2005). Urban environment indeed benefits human health (e.g. reduces obesity and chronic diseases) through influencing human physical behaviours. Previous studies have also examined the role of subjective perceptions and feelings about urban environments in mental health, such as whether a safer, greener or more beautiful environment can ease depression and stress (Ulrich et al. Citation1991; Galea et al. Citation2005; Berman, Jonides, and Kaplan Citation2008).
Despite the successes of previous studies, this area of research still faces challenges. A comprehensive observation and representation of the urban environment is a prerequisite in these experiments. By detecting and understanding the elements and scenes of built environments, researchers are able to investigate the relationships between physical environments and health outcomes quantitatively. However, most studies rely on in-person assessments or field observations to collect data about built environment characteristics (Wilson et al. Citation2012; Rzotkiewicz et al. Citation2018). Such conventional data collection approaches have several challenges, including high labour intensity, long update period, restriction to small-scale geographic areas, etc. (Golder and Macy Citation2011; Seresinhe, Preis, and Moat Citation2015; Lu Citation2019). New paradigms should be proposed to solve these problems and guide studies on sensing the urban physical environment (Rathore et al. Citation2016; Janowicz et al. Citation2019).
Street view images represent real-world scenery including natural scenes and man-made landscapes from a pedestrian perspective and allow users to navigate the realistic streetscape remotely. The emergence of such a big data source provides unprecedented opportunities in digitalizing the world, which enables researchers to investigate the physical urban environment and human activities on a large scale. By sensing the elements and scenes captured by street view images, the urban physical environment can be modelled more accurately and comprehensively, and the connection between the built environment and various health outcomes can be established. In addition, the success of technological advancements such as computer vision and deep learning algorithms enables researchers to understand neighbourhood environments through images (Badland et al. Citation2010; Ibrahim, Haworth, and Cheng Citation2020). Existing studies have attempted to use street view images to measure neighbourhood attributes such as safety (Porzi et al. Citation2015), housing price (Law, Paige, and Russell Citation2019), greenness (Li et al. Citation2015c), and population demographics (Gebru et al. Citation2017). Results of these studies demonstrate that street view imagery can be used as a reliable data source for observing the built environment and for examining the associations between built environment and health outcomes.
In this paper, we present a comprehensive review of existing studies on measuring and quantifying the urban physical environment using street view images for public health. To do so, we performed a keyword search via the Scopus database including the terms ‘street view’, ‘Google street view’, ‘street view images’, and ‘health’, ‘walking behaviors’, etc. Papers with high-relevance were retrieved at first. We examined these papers carefully and tracked other related manuscripts from these papers. Studies that met the following criteria were included in the review: (1) Data sources: street view images are utilized as data sources in sensing urban built environment. (2) Study subject: the observed physical environment pertained to health outcomes (physical or mental aspects), health policy makings, or injury assessments. (3) Time of publication: before 1 January 2020. (4) Language: articles written in English. By doing so, 64 papers in total are included in this work.
In the review, we first categorize methods developed for street view image-based urban environment sensing as being at element level or at scene level. After that, we identify the health study areas that have been intensively examined using street view images in sensing the urban environment. In doing so, we show the potential of street view images as input in examining the relationship between the built environment and human health. The remainder of this review is organized as follows: Section 2 introduces the basic characteristics of street view images. Section 3 examines the quantitative methods used in analysing street view images. Section 4 surveys the recent applications in sensing the physical environment for health research. Section 5 discusses the limitations and opportunities for using street view images in health research. Section 6 presents the conclusions of this paper.
2. Street view images
Street view images refer to the scenery images that describe the urban streetscape with an angle of view similar to that of human vision. This kind of dataset can be accessed from web mapping services. Users are allowed to navigate the realistic scenery remotely through these interactive panoramic images as if they were travelling in the real world (Anguelov et al. Citation2010; Badland et al. Citation2010). Google Street View (GSV), launched in 2007, was the first service provider and is currently the most popular one. A great number of other mapping companies around the world now provide similar services, such as Bing maps, Tencent maps, Baidu maps, and Yandex maps.
In order to collect such images, GPS equipped, drive-by sensing vehicles take panorama photos along road networks. By doing so, the coordinates are attached to each panorama photo. Researchers can thereby request and position various angles of view of the physical environment from online map services. For example, shows (a) the images from different angles that were used to construct the panorama image and (b) the panorama image. As shown in the images, the street view images capture objects in the urban streetscape at about eye-level.
Figure 1. Two forms of street view imagery: (a) natural view; (b) panoramic view.
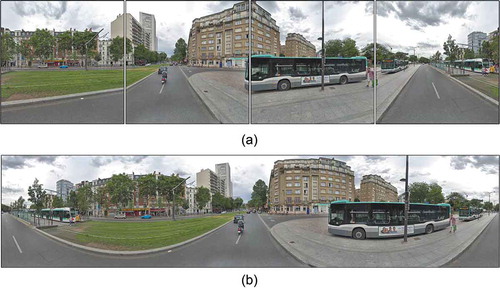
Compared with traditional data sources, street view images have some inherent characteristics that render them as valuable data sources for urban environment auditing: high coverage and volume, relatively low data bias, cost-effectiveness and time effectiveness and eye-level scenery (Wilson, Thomson, and Edwards Citation2015; Rzotkiewicz et al. Citation2018; Ibrahim, Haworth, and Cheng Citation2020). The following paragraphs discuss these advantages, respectively.
First, in terms of the coverage and volume, large-scale street view images have been generated and stored by map service providers around the world. Google street view images have covered most cities in nearly 200 countries; Baidu and Tencent street view images have covered over 400 cities in China. The high coverage of street view imagery not only provides abundant information to characterize the urban environment comprehensively but also enables researchers to evaluate and measure different urban scenery across countries on a global scale (Rundle et al. Citation2011; Yao et al. Citation2019; Zhang et al. Citation2019b).
Second, compared with volunteered geographic information (VGI) (Goodchild Citation2007) and more broadly user-generated content (UGC) (Krumm, Davies, and Narayanaswami Citation2008), street view images have relatively higher quality and lower data bias in the urban environment. As a promising data source in the era of big data, all street view images follow the same standard rules and production workflow and have uniform formats with a maximum image size of 2048*2048 pixels,Footnote1 which can guarantee the quality of images to a certain degree. Also, due to the fact that: (1) street view images are collected through uniform sampling along the streets in urban environments; (2) adjacent pictures may overlap in the description of scenery; (3) most regions in urban areas are covered by the street view imagery, there is less data bias when using street view images (Liying Zhang, Citation2019).
Third, street view images are low cost, easy to access, and easy to download. By using the API services provided by mapping companies, users can download freely available images in a short time. When requesting images, users customize the parameters of the images, including the location, time, camera angle, image size, etc., to collect street view images that fit their needs. Thus, it is possible for researchers to assess neighbourhoods in a wide range of global contexts (Zeng et al. Citation2018; Li et al. Citation2015c).
Last but not least, street view images can capture the objective urban scenery from a human perspective. Different from aerial photographs and remote sensing images that take photos from an overlooking view, street view images follow human perception to depict the urban environment by using a view angle similar to that of the human eye and capture detailed objects in built environment more comprehensively (Li et al. Citation2015c; Wang et al. Citation2019a; Liying Zhang Citation2019). In addition, the information contained in street view images enables the exploration of intangible aspects of urban life and people’s perceptions of the environment (Zhang et al. Citation2018b).
3. Methods for built environments representation
3.1. Built environments representation: elements and scenes
To examine the associations between urban physical environment and various health outcomes, it is necessary to accurately observe, model, and represent the urban environment. To do so, elements and scenes in the urban physical environment should first be sensed and quantified.
Detecting and extracting spatial objects, items, elements, and calculating specific indices of elements from the urban environment is termed as element level observation, as shown in . The objects such as trees (Donovan et al. Citation2015), waterbodies (Prüss Citation1998), smoke-free signage (Wilson and Thomson Citation2015; Wilson, Thomson, and Edwards Citation2015), traffic signs (Hazelhoff, Creusen, and de With Citation2014), zebra crosswalks (Ahmetovic et al. Citation2015), etc., have been detected and identified in modelling the urban physical environment. Based on the elements and objects identified, several environmental attributes can be inferred and used to measure neighbourhood attributes. A set of indices about the urban environment are defined as well. For example, researchers have calculated the green view index (Yang et al. Citation2009; Li et al. Citation2015c; Long and Liu Citation2017), sky view factor (Li, Ratti, and Seiferling Citation2018a), tree view factor (Gong et al. Citation2018), and street canyons (Chan et al. Citation2002; Hu et al. Citation2020) in cities. All these measurements reflect various physical attributes of the urban environment which potentially contribute to diverse health outcomes.
Figure 2. Methods in understanding elements in urban environment.
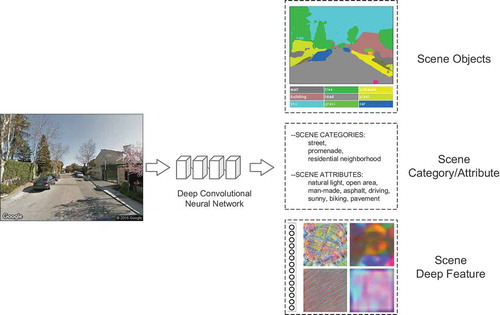
Figure 3. Methods in understanding scenes in urban environment.
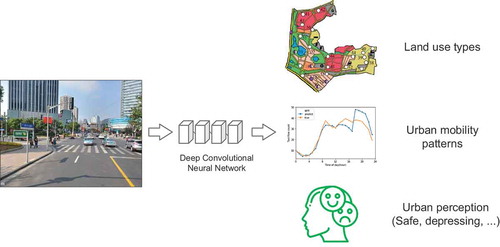
In contrast, having an overall assessment of the entire scene and understanding the underlying semantics is termed as scene level observation, as shown in . It is crucial to explore the associations between the environment and health behaviours at the scene level. On one hand, the entire urban physical environment has strong associations with various neighbourhood environment attributes (), such as urban land-use type (Dannenberg et al. Citation2003; Cao et al. Citation2018; Zhang et al. Citation2019a), urban environmental quality (Van Kamp et al. Citation2003; Liu et al. Citation2017), and environmental aesthetics (Velarde, Fry, and Tveit Citation2007; Quercia, O’Hare, and Cramer Citation2014). On the other hand, analysing the scenes of the urban physical environment enables us to assess human response and perception of the built environment. Measuring different aspects of human perception of neighbourhood environments and places, for instance, safe (Vlahov et al. Citation2007; Li, Zhang, and Li Citation2015a; Naik et al. Citation2014), beautiful (Purciel et al. Citation2009; Dubey et al. Citation2016; Seresinhe, Preis, and Moat Citation2015), lively (Zhang et al. Citation2018b), etc., benefits many health outcomes, especially mental health. Researchers are therefore trying to understand how people perceive the urban environment, which requires a comprehensive description of scenes in the urban physical environment.
In sum, the urban physical environment can be analysed at the element level and at the scene level. The former focuses on objects in the urban environment while the latter pays more attention to the entire scene. Identifying different targets in the urban environment may require different methods. The following two subsections introduce traditional methods and street view imagery-based methods for quantifying and modelling urban physical environment. Researchers are able to examine the relationships between urban physical environment and public health from these two aspects.
3.2. Urban physical environment representation using traditional methods
Traditional studies for environmental health research usually employ self-reports and questionnaires, field surveys, and secondary sources to characterize built environments at element level and at scene level, respectively. Questionnaires and self-reports are arguably the most commonly used sources. With these sources, investigators may ask respondents to evaluate different aspects of neighbourhood attributes (Wang et al. Citation2019d; De Jesus et al. Citation2010; Ball et al. Citation2001). For field observations, researchers are asked to record and describe their urban environment audits by walking or driving around the study areas with pre-defined survey forms (Gullón et al. Citation2015; Lawlor et al. Citation2003; Takano, Nakamura, and Watanabe Citation2002). Secondary sources refer to those pre-defined environmental measures based on spatial analysis and modelling such as spatial accessibility measures (Pliakas et al. Citation2017; Leslie and Cerin Citation2008). All three approaches have their strengths and limitations. Questionnaires are the most commonly used method. It might be affected by people’s biases while field-audits are more objective. But both methods are costly, labour-intensive and time-consuming when conducting research with a large sample size or over large regions. Secondary sources might not characterize neighbourhoods in sufficient detail, and might be limited to specific types of environmental exposures (Pliakas et al. Citation2017).
3.3. Urban physical environment representation using street view images
Apart from the traditional methods for urban physical environment representation at element level and scene level, abundant street view imagery data have enabled researchers to tackle and compute a wide range of spatial elements and scenes in the neighbourhood environment. To do so, two categories of methods are commonly used in urban physical environment representation. The first category employs traditional image processing and computer vision methods to extract shallow visual features which can encode semantic information of street view photos. For example, by iterating pixels, pixel values that represent different colour channels, and colour histogram (Yu and Wang Citation2016) are calculated to infer environmental attributes (e.g. green view index (Li et al. Citation2015c)). Shallow visual features such as texture and geometry features (Chacra and Zelek Citation2016), scale-invariant feature transform (SIFT) (Naik et al. Citation2014; Kang, Gao, and Liang Citation2018), are employed for representing urban physical environment features. Several machine learning methods such as mean-shift clustering algorithm and support vector machines (SVM) are used for image classification (Hazelhoff, Creusen, and de With Citation2014; Liu et al. Citation2019; Li et al. Citation2015b). These methods also support derive scene category and calculating attribute of street view imagery and are easy to be employed.
The second category of methods refers to deep learning methods such as deep convolutional neural networks (DCNN). It enables researchers to extract high-dimensional visual features to enhance the understanding of images (LeCun, Bengio, and Hinton Citation2015). The deep features can be used efficiently to recognize different space categories and scene types (Zhang et al. Citation2016; Wang et al. Citation2019e), evaluate place distinctiveness and compare their similarities (Wang et al. Citation2019e), which provides solid fundamentals for urban physical environment observation. Specifically, compared with traditional methods, DCNN can significantly improve the accuracy of object detection and image classification for street view images. Therefore, it has been widely used for element level observation in urban physical environment. For example, Zhang et al. (Citation2018a) extracted 64-category objects at hierarchical layers from street view images. Lu, Sarkar, and Xiao (Citation2018) have used street view images to assess urban greenness.
In addition, with large-scale pre-trained image data sets (Zhou et al. Citation2014) and online perception data sets (Li, Zhang, and Li Citation2015a), it is possible to provide scene level observation to understand the landscape in street view images using deep learning algorithms. Several crowdsourcing databases have been established, for example, online pairwise surveys MIT Place PulseFootnote2 (Dubey et al. Citation2016), StreetSeenFootnote3 (Evans-Cowley and Akar Citation2014). These surveys record and score people’s subjective perceptions of places. Researchers have trained the DCNN model to quantitatively measure different aspects of human perception of the built environment, such as lively (Zhang et al. Citation2018a), safe (Li, Zhang, and Li Citation2015a) and aesthetic (Dubey et al. Citation2016). By using the above-mentioned methods, researchers are able to capture the objects, analyse the scenes, and evaluate related attributes of the urban environment from street view images.
4. Applications of street view imagery for health research
Understanding the relationship between the built environment and various health outcomes has attracted researchers’ attention for decades. Observation and representation of the urban environment is one of the crucial steps in which street view imagery has been successfully applied. By describing and analysing elements and scenes captured by street view images comprehensively, researchers are able to investigate the environment–health relationships quantitatively. For the purposes of this review, we summarize applications that employed street view images to audit the urban physical environment for use in public health research. Specifically, we categorize two types of research based on different health outcomes: physiological-related applications and psychological-related applications.
4.1. Physiological-related applications
Numerous experimental studies have suggested that the built environment can provide substantial physiological benefits. The environment can either affect people’s health indirectly through promoting various forms of health-related physical activities or influence their health directly (Mitchell and Popham Citation2008; Ulrich Citation1984; Lee et al. Citation2012; Mehrabian and Russell Citation1974). Here, we illustrate how street view images can be used to audit various built environments and assess their suitability for physical activity as well as their direct effect on public health.
4.1.1. Walkable environment
Evidence shows that there are substantial health benefits of walking for adults, as walking behaviours serve as mediators in the relationship between the urban built environment and health outcomes (Lu, Sarkar, and Xiao Citation2018; Brookfield and Tilley Citation2016). Many studies have explored the synergistic beneficial effects of physical activities like walking behaviours and the presence of nature (Pretty et al. Citation2005). Thus, researchers have evaluated the walkability of the urban physical environment using street view images. Existing studies have proved that street view images can identify the presence of walking activity-related objects, and thus can provide effective and reliable measurement of the streetscape context for walking behaviours (Badland et al. Citation2010; Chudyk et al. Citation2014). Lu, Sarkar, and Xiao (Citation2018) and Li et al. (Citation2015b) examined the effects of urban greenery on walking behaviours and found that urban green spaces benefit health via walking activities, while Li et al. (Citation2018b) discovered that the street enclosure has different associations with human walking activities among different land-use types. Moreover, street view images are used to evaluate and quantify walkability according to the visual enclosure of a neighbourhood for assessing the health impacts (Wang et al. Citation2019c; Yin and Wang Citation2016; Vargo, Stone, and Glanz Citation2012) on certain groups of people such as older adults (Brookfield and Tilley Citation2016) and children (Vanwolleghem et al. Citation2014). Gullón et al. (Citation2015) used street view images to measure residential environments with regards to walking infrastructure and traffic safety.
4.1.2. Cycling behaviours
Cycling is another type of physical activity that has documented health benefits as well as environmental benefits (Lu et al. Citation2019). Children and adults enjoy incorporating moderate to vigorous physical activity through cycling into their daily routines (Oja et al. Citation2011). Also, cycling is an environmentally friendly transportation mode with less CO2 emissions and traffic congestion compared to cars (Fraser and Lock Citation2011). Badland et al. (Citation2010) suggest that street view imagery can audit the built environment for cycling. According to the built environment captured by street view images, environmental factors that influence cycling behaviours and determine the cyclability of roads can be discovered. For example, street greenery is positively associated with cycling behaviours (Lu et al. Citation2019); Vanwolleghem et al. (Citation2014) used street view images to assess physical environmental characteristics along cycling routes to school. Such studies provide support for decision-making and cycling policies including choosing bicycling locations and building cycling routes (Mertens et al. Citation2017; Evans-Cowley and Akar Citation2014).
4.1.3. Obesity and food environment
Existing studies suggest that obesogenic environments related to physical activity and chronic noncommunicable diseases are associated with the built environment of home and work places. (Silva et al. Citation2015; Ellaway, Macintyre, and Bonnefoy Citation2005). How obesogenic and food environments are produced or might be dismantled is thereby important for health issues (Lesser et al. Citation2013; Swinburn et al. Citation2011). Researchers have used street view images as a promising tool to examine the obesogenic environment that causes weight gain and obesity in people living in cities (Bethlehem et al. Citation2014; Feuillet et al. Citation2016), the advertising of unhealthy food and beverages (Egli et al. Citation2019), and alcohol-related environment (Clews et al. Citation2016). Roda et al. (Citation2016) investigated the agreement between the perceptions of residents and the objective measurement from street view on obesogenic environmental features and found that agreement varies by different obesogenic environmental features, regions and neighbourhoods. Clarke et al. (Citation2010) used street view images to evaluate recreational facilities and food environment. Silva et al. (Citation2015) used street view images to examine the relationship between obesogenic built environments and physical activities and chronic noncommunicable diseases. Mayne et al. (Citation2018) used street view images to audit physical disorders which might benefit obesogenic research. Yang et al. (Citation2020) used street view images to measure urban greenery and examine their impacts on children’s body weight status.
4.1.4. Physical injury
Analysis of street view images can also provide valuable information for pedestrian and driver safety by revealing the environmental factors associated with car crash data. For instance, Hanson, Noland, and Brown (Citation2013) examined the association of pedestrian and road infrastructure features with crash severity using street view images, which provided suggestions for pedestrian safety. Johnson and Gabler (Citation2015) evaluated real-world crashes with Google Street View photos and found where car drivers may have larger potential for injury.
4.2. Psychology-related applications
Researchers from environmental psychology argue that exposure to nature has psychological benefits (Chen and Chen Citation2015; Svoray et al. Citation2018; Berto Citation2014; Berman, Jonides, and Kaplan Citation2008). Characteristics of the built environment can either directly affect people’s mental health or indirectly affect it by influencing their perceptions. In this subsection, we introduce how street view images are employed in identifying those characteristics that benefit psychological health.
4.2.1. Mental health
There is empirical evidence that exposure to nature such as greenness and open space has benefits for mental health (Svoray et al. Citation2018; Kang et al. Citation2019; James et al. Citation2015). Researchers have used street view images to examine the relationships between environmental characteristics including walkability (Wang et al. Citation2019c), greenness (Wang et al. Citation2019a; Helbich et al. Citation2019), public open space (Taylor et al. Citation2011), and human mental health, e.g. depression (Wang et al. Citation2019c; Helbich et al. Citation2019), and psychological restorative effects (Quinn et al. Citation2016). For example, Wang et al. (Citation2019c) explored the association between walkability evaluated from street view images and older adults’ depression and anxiety levels collected from mental health surveys; Wu et al. (Citation2014) reported the association between depressive symptoms and features of built environment related to mental health. Helbich et al. (Citation2019) used street view images to explore the linkage between green and blue spaces and exposure to natural environments, and mental disorders (i.e. depression symptoms) at the street-level among elderly people in China. Similar conclusions are obtained from comparative studies using traditional data collection methods that exposure to nature has positive benefits for mental health. For example, Wang et al. (Citation2019a) discovered that urban greenery as measured by the normalized difference vegetation index (NDVI) has positive impacts on human mental well-being. Hyam (Citation2017) evaluated the psychological restorative effects of exposure to nature by viewing images of nature. Taylor et al. (Citation2011) assessed how the quality of public open spaces might benefit human mental health.
4.2.2. Perception and Sentiment
Human perception and sentiments of the environment reflect how people think about their surroundings. Such perceptions and sentiments, such as safe, beautiful, and lively, may also play important roles in influencing various human mental well-beings (Loukaitou-Sideris and Eck Citation2007; Parsons Citation1991; Özgüner, Eraslan, and Yilmaz Citation2012). Researchers utilized street view images to evaluate and understand how people perceive the built environment. According to Wang et al. (Citation2019b), the perceptions of built environment by older Chinese are significantly related to both of their mental and physical health. Specifically, the perception of neighbourhood safety can affect mental health by reducing psychological stress, improving life satisfaction and physical activities (Won et al. Citation2016). Porzi et al. (Citation2015) examined human perception and response to the surrounding environment to explore what makes a place look safe. Li, Zhang, and Li (Citation2015a) discovered that the visibility of green vegetation plays an important role in increasing perceived safety in urban areas. Naik et al. (Citation2014) presented a novel computational tool which can accurately predict the safety scores of streetscapes in cities and their impact on its inhabitants. Also, there are extensive studies about how the aesthetics of the environment might influence well-being (Ulrich Citation1979; Parsons Citation1991). Suel et al. (Citation2019) quantifies the relationship between environmental aesthetics and human health, as aesthetics of the environment may have quantifiable consequences for our well-being. Seresinhe, Preis, and Moat (Citation2015) demonstrated how we perceive the beauty of environments, and offered insights for policymakers to design and protect built and natural environments. Compernolle et al. (Citation2016) examined the association of perceived and objective measures such as neighbourhood safety, aesthetics, destinations, and functionality, with transport-related, work-related and leisure-time sedentary behaviours.
4.3. Comparison between street view imagery and remote sensing imagery
Before the emergence of street view imagery, aerial photos and remote sensing imagery were the commonly used data sources for observing urban environments. Different from street view images, aerial photos and remote sensing images can provide a bird’s-eye view (overhead view) of the landscape. Researchers have utilized them to analyse urban land use (Herold, Scepan, and Clarke Citation2002), urban greenness (Gupta et al. Citation2012), and disaster situations (Peng et al. Citation2019). A popular index – the normalized difference vegetation index (NDVI) – has been widely used to measure greenery as well (Rouse et al. Citation1974). As all datasets have pros and cons, we make a comparison between street view images and remote sensing images here to discuss their characteristics in practice.
Both street view imagery and remote sensing imagery have commonalities in describing several specific urban features. For example, Wang et al. (Citation2019a) discovered that streetscape greenery measured using street view images and NDVI measured by remote sensing imagery are associated with positive impacts on human mental well-being; Wang et al. (Citation2018) found both data sources can predict the commercial activeness with satisfactory precision by adding visual patterns.
Street view images may have better performance in some tasks as the profile view captured reflects what people see on the ground in the urban environment (Li et al. Citation2015c). For instance, the findings of Villeneuve et al. (Citation2018) provide support for the hypothesis that the attributes measured by neighbourhood greenness may play a more important role in promoting participation in recreational physical activity during the summer as compared with the attributes measured by NDVI. Lu et al. (Citation2019) confirmed that eye-level street greenery, but not NDVI, has a positive correlation with a higher probability of cycling. Ben-Joseph et al. (Citation2013) noted that street view images have advantages in measuring fine-grain features such as sidewalks and obstructions. Larkin and Hystad (Citation2019) suggested that street view measurement can better capture dimensions of trees and other types of vegetation from a ground-based view, and therefore can be a potential source for examining health associations and green space.
In addition, several studies argued that street view images and remote sensing images may characterize the urban environment in different aspects. For example, Helbich et al. (Citation2019) found that street view-based and satellite-derived green and blue space measurements represent different aspects of natural environments. According to Larkin and Hystad (Citation2019), the street view-based green space measurement has less correlation with other measurements using remote sensing images, which suggests that street view images capture unique information about green space exposures. Therefore, street view images can supplement remote sensing images for urban land-use classification (Zhang et al. Citation2017).
5. Limitations and future works
Despite the success of street view images in auditing urban physical environments for health research, several limitations and challenges should be addressed for future work. First, although existing studies have shown the efficiency of using street view images in observing the urban environment (Wu et al. Citation2014), researchers argue that when identifying details related to certain items including street lights, sidewalk continuity (Chudyk et al. Citation2014) and specific phenomenon (e.g. alcohol consumption) (Clews et al. Citation2016), they may be less reliable. Field observations may have superiority in identifying items such as smoke-free signage in streets by allowing more angles to be viewed (Wilson, Thomson, and Edwards Citation2015). Second, mapping companies do not update their street view images in real time or frequently, and the street view images can only observe the scenery along the streets. Thus, observing changes in urban environments and coverage area may be limited, making it difficult to analyse the variance of urban environment in time series and inside neighbourhoods. In addition, quality issues such as uncleared pixels and the potential of blocked or blurred items may also impact the performance of object detection (e.g. unidentified items, wrong categories) (Egli et al. Citation2019). Also, it is hard to determine the size of outdoor items (Egli et al. Citation2019).
Future work with street view imagery is directed to mitigate these issues and is anticipated to facilitate public health on two fronts. First, as the performance of computer vision models gets better, beyond only using static images, it could be possible to capture more detailed human movement and activity information from cameras and videos with high resolution. Second, researchers in computer vision and deep learning are working on parsing and interpreting well-trained neural networks, which are usually considered ‘black boxes’, to figure out what exactly the nets learned and how this information can be transferred to common knowledge. The output will benefit our understanding of how physical environments affect human behaviour, human perception and human health.
6. Conclusion
The emergence of street view images provides a valuable data source for auditing the built environment and enables a better examination of the relationship between the environment and health outcomes. Compared with traditional approaches such as field observation and secondary sources, street view images capture the urban physical environment at eye-level with lower cost and higher efficiency.
In this work, we present a timely review of health research based on street view imagery. The methods are summarized in two aspects, namely the element level and the scene level. Then, the most recent studies about physiological and psychological applications using street view imagery are discussed. We also make a comparison between street view images and remote sensing images with regard to the examination of their associations with health studies. Finally, we discuss the limitations, challenges, and opportunities of this data source and the associated methods. Several future research directions that would benefit public health research and practices are recommended in urban environment research.
Acknowledgements
This work is supported by the National Natural Science Foundation of China under Grant 41901321, and the Office of Vice Chancellor for Research and Graduate Education at the University of Wisconsin-Madison with funding from the Wisconsin Alumni Research Foundation. Song Gao is partially supported by the National Science Foundation (2027375). Any opinions, findings and conclusions or recommendations expressed in this material are those of the authors and do not necessarily reflect the views of the National Science Foundation. The authors would like to thank Hanqi Li at Wuhan University for her helpful discussions, as well as Jake Kruse for his help with proofreading and correction for this manuscript.
Disclosure statement
No potential conflict of interest was reported by the authors.
Additional information
Funding
Notes
1. https://developers.google.com/maps/documentation/streetview/usage-and-billing
2. http://pulse.media.mit.edu/.
3. http://streetseen.osu.edu/studies/bicycling-preferences-in-columbus-ohio/vote
References
- Abraham, A., K. Sommerhalder, and T. Abel. 2010. “Landscape and Well-being: A Scoping Study on the Health-promoting Impact of Outdoor Environments.” International Journal of Public Health 55 (1): 59–69. doi:10.1007/s00038-009-0069-z.
- Ahmetovic, D., R. Manduchi, J. M. Coughlan, and S. Mascetti. 2015. “Zebra Crossing Spotter: Automatic Population of Spatial Databases for Increased Safety of Blind Travelers.” Proceedings of the 17th International ACM SIGACCESS Conference on Computers & Accessibility, New York, NY, 251–258. ACM.
- Anguelov, D., C. Dulong, D. Filip, C. Frueh, S. Lafon, R. Lyon, A. Ogale, L. Vincent, and J. Weaver. 2010. “Google Street View: Capturing the World at Street Level.” Computer 43 (6): 32–38. doi:10.1109/MC.2010.170.
- Badland, H. M., S. Opit, K. Witten, R. A. Kearns, and S. Mavoa. 2010. “Can Virtual Streetscape Audits Reliably Replace Physical Streetscape Audits?.” Journal of Urban Health 87 (6): 1007–1016. doi:10.1007/s11524-010-9505-x.
- Ball, K., A. Bauman, E. Leslie, and N. Owen. 2001. “Perceived Environmental Aesthetics and Convenience and Company Are Associated with Walking for Exercise among Australian Adults.” Preventive Medicine 33 (5): 434–440. doi:10.1006/pmed.2001.0912.
- Ben-Joseph, E., J. S. Lee, E. K. Cromley, F. Laden, and P. J. Troped. 2013. “Virtual and Actual: Relative Accuracy of On-site and Web-based Instruments in Auditing the Environment for Physical Activity. ”Health & Place 19: 138–150. doi:10.1016/j.healthplace.2012.11.001.
- Berman, M. G., J. Jonides, and S. Kaplan. 2008. “The Cognitive Benefits of Interacting with Nature.” Psychological Science 19 (12): 1207–1212. doi:10.1111/j.1467-9280.2008.02225.x.
- Berto, R. 2014. “The Role of Nature in Coping with Psycho-physiological Stress: A Literature Review on Restorativeness.” Behavioral Sciences 4 (4): 394–409. doi:10.3390/bs4040394.
- Bethlehem, J. R., J. D. Mackenbach, M. Ben-Rebah, S. Compernolle, K. Glonti, H. Bárdos, H. R. Rutter, et al.. 2014. “The Spotlight Virtual Audit Tool: A Valid and Reliable Tool to Assess Obesogenic Characteristics of the Built Environment.” International Journal of Health Geographics 13 (1): 52.
- Brookfield, K., and S. Tilley. 2016. “Using Virtual Street Audits to Understand the Walkability of Older Adults’ Route Choices by Gender and Age.” International Journal of Environmental Research and Public Health 13 (11): 1061. doi:10.3390/ijerph13111061.
- Cao, R., J. Zhu, W. Tu, Q. Li, J. Cao, B. Liu, Q. Zhang, and G. Qiu. 2018. “Integrating Aerial and Street View Images for Urban Land Use Classification.” Remote Sensing 10 (10): 1553. doi:10.3390/rs10101553.
- Chacra, D. A., and J. Zelek. 2016. “Road Segmentation in Street View Images Using Texture Information.” 2016 13th Conference on Computer and Robot Vision (CRV), 424–431. Victoria, BC, Canada: IEEE.
- Chan, T., G. Dong, C. Leung, C. Cheung, and W. Hung. 2002. “Validation of a Two-dimensional Pollutant Dispersion Model in an Isolated Street Canyon.” Atmospheric Environment 36 (5): 861–872. doi:10.1016/S1352-2310(01)00490-3.
- Chen, J., and S. Chen. 2015. “Mental Health Effects of Perceived Living Environment and Neighborhood Safety in Urbanizing China. ”Habitat International 46: 101–110. doi:10.1016/j.habitatint.2014.11.002.
- Chudyk, A. M., M. Winters, E. Gorman, H. A. McKay, and M. C. Ashe. 2014. “Agreement between Virtual and In-the-field Environment Audits of Assisted Living Sites.” Journal of Aging and Physical Activity 22 (3): 414–420. doi:10.1123/JAPA.2013-0047.
- Clarke, P., J. Ailshire, R. Melendez, M. Bader, and J. Morenoff. 2010. “Using Google Earth to Conduct a Neighborhood Audit: Reliability of a Virtual Audit Instrument.” Health & Place 16 (6): 1224–1229. doi:10.1016/j.healthplace.2010.08.007.
- Clews, C., R. Brajkovich-Payne, E. Dwight, A. A. Fauzul, M. Burton, O. Carleton, J. Cook, et al.. 2016. “Alcohol in Urban Streetscapes: A Comparison of the Use of Google Street View and On-street Observation.” BMC Public Health 16 (1): 442.
- Compernolle, S., K. De Cocker, C. Roda, J. M. Oppert, J. D. Mackenbach, J. Lakerveld, K. Glonti, et al.. 2016. “Physical Environmental Correlates of Domain-specific Sedentary Behaviours across Five European Regions (The Spotlight Project).” PLoS One 11 (10): e0164812.
- Dannenberg, A. L., R. J. Jackson, H. Frumkin, R. A. Schieber, M. Pratt, C. Kochtitzky, and H. H. Tilson. 2003. “The Impact of Community Design and Land-use Choices on Public Health: A Scientific Research Agenda.” American Journal of Public Health 93 (9): 1500–1508. doi:10.2105/AJPH.93.9.1500.
- De Jesus, M., E. Puleo, R. C. Shelton, and K. M. Emmons. 2010. “Associations between Perceived Social Environment and Neighborhood Safety: Health Implications.” Health & Place 16 (5): 1007–1013. doi:10.1016/j.healthplace.2010.06.005.
- Donovan, G. H., Y. L. Michael, D. Gatziolis, J. P. Prestemon, and E. A. Whitsel. 2015. “Is Tree Loss Associated with Cardiovascular-disease Risk in the Women’s Health Initiative? A Natural Experiment. ”Health & Place 36: 1–7. doi:10.1016/j.healthplace.2015.08.007.
- Dubey, A., N. Naik, D. Parikh, R. Raskar, and C. A. Hidalgo. 2016. “Deep Learning the City: Quantifying Urban Perception at a Global Scale.” 14th European Conference, Amsterdam, The Netherlands, October 11–14, 2016, Proceedings, Part I, European Conference on Computer Vision, 196–212. Springer.
- Egli, V., C. Zinn, L. Mackay, N. Donnellan, K. Villanueva, S. Mavoa, D. J. Exeter, S. Vandevijvere, and M. Smith. 2019. “Viewing Obesogenic Advertising in Children’s Neighbourhoods Using Google Street View.” Geographical Research 57 (1): 84–97. doi:10.1111/1745-5871.12291.
- Ellaway, A., S. Macintyre, and X. Bonnefoy. 2005. “Graffiti, Greenery, and Obesity in Adults: Secondary Analysis of European Cross Sectional Survey.” Bmj 331 (7517): 611–612. doi:10.1136/bmj.38575.664549.F7.
- Evans-Cowley, J. S., and G. Akar. 2014. “Streetseen Visual Survey Tool for Determining Factors that Make a Street Attractive for Bicycling.” Transportation Research Record 2468 (1): 19–27. doi:10.3141/2468-03.
- Feuillet, T., H. Charreire, C. Roda, M. Ben Rebah, J. Mackenbach, S. Compernolle, K. Glonti, et al.. 2016. “Neighbourhood Typology Based on Virtual Audit of Environmental Obesogenic Characteristics.” Obesity Reviews 17: 19–30. doi:10.1111/obr.12378.
- Fraser, S. D., and K. Lock. 2011. “Cycling for Transport and Public Health: A Systematic Review of the Effect of the Environment on Cycling.” European Journal of Public Health 21 (6): 738–743. doi:10.1093/eurpub/ckq145.
- Galea, S., J. Ahern, S. Rudenstine, Z. Wallace, and D. Vlahov. 2005. “Urban Built Environment and Depression: A Multilevel Analysis.” Journal of Epidemiology and Community Health 59 (10): 822–827. doi:10.1136/jech.2005.033084.
- Gebru, T., J. Krause, Y. Wang, D. Chen, J. Deng, E. L. Aiden, and L. Fei-Fei. 2017. “Using Deep Learning and Google Street View to Estimate the Demographic Makeup of Neighborhoods across the United States.” Proceedings of the National Academy of Sciences 114 (50): 13108–13113. doi:10.1073/pnas.1700035114.
- Golder, S. A., and M. W. Macy. 2011. “Diurnal and Seasonal Mood Vary with Work, Sleep, and Daylength across Diverse Cultures.” Science 333 (6051): 1878–1881. doi:10.1126/science.1202775.
- Gong, F. Y., Z. C. Zeng, F. Zhang, X. Li, E. Ng, and L. K. Norford. 2018. “Mapping Sky, Tree, and Building View Factors of Street Canyons in a High-density Urban Environment. ”Building and Environment 134: 155–167. doi:10.1016/j.buildenv.2018.02.042.
- Goodchild, M. F. 2007. “Citizens as Sensors: The World of Volunteered Geography.” GeoJournal 69 (4): 211–221. doi:10.1007/s10708-007-9111-y.
- Gullón, P., H. M. Badland, S. Alfayate, U. Bilal, F. Escobar, A. Cebrecos, J. Diez, and M. Franco. 2015. “Assessing Walking and Cycling Environments in the Streets of Madrid: Comparing On-field and Virtual Audits.” Journal of Urban Health 92 (5): 923–939. doi:10.1007/s11524-015-9982-z.
- Gupta, K., P. Kumar, S. K. Pathan, and K. P. Sharma. 2012. “Urban Neighborhood Green Index – A Measure of Green Spaces in Urban Areas.” Landscape and Urban Planning 105 (3): 325–335. doi:10.1016/j.landurbplan.2012.01.003.
- Hanson, C. S., R. B. Noland, and C. Brown. 2013. “The Severity of Pedestrian Crashes: An Analysis Using Google Street View Imagery. ”Journal of Transport Geography 33: 42–53. doi:10.1016/j.jtrangeo.2013.09.002.
- Hartig, T., R. Mitchell, S. De Vries, and H. Frumkin. 2014. “Nature and Health. ”Annual Review of Public Health 35: 207–228. doi:10.1146/annurev-publhealth-032013-182443.
- Hazelhoff, L., I. M. Creusen, P. H. N. de With. 2014. “Exploiting Street-level Panoramic Images for Large-scale Automated Surveying of Traffic Signs.” Machine Vision and Applications 25 (7): 1893–1911.
- Helbich, M., Y. Yao, Y. Liu, J. Zhang, P. Liu, and R. Wang. 2019. “Using Deep Learning to Examine Street View Green and Blue Spaces and Their Associations with Geriatric Depression in Beijing, China. ”Environment International 126: 107–117. doi:10.1016/j.envint.2019.02.013.
- Herold, M., J. Scepan, and K. C. Clarke. 2002. “The Use of Remote Sensing and Landscape Metrics to Describe Structures and Changes in Urban Land Uses.” Environment & Planning A 34 (8): 1443–1458. doi:10.1068/a3496.
- Hu, C. B., F. Zhang, F. Y. Gong, C. Ratti, and X. Li. 2020. “Classification and Mapping of Urban Canyon Geometry Using Google Street View Images and Deep Multitask Learning. ”Building and Environment 167: 106424. doi:10.1016/j.buildenv.2019.106424.
- Hyam, R. 2017. “Automated Image Sampling and Classification Can Be Used to Explore Perceived Naturalness of Urban Spaces.” PloS One 12 (1): e0169357. doi:10.1371/journal.pone.0169357.
- Ibrahim, M. R., J. Haworth, and T. Cheng. 2020. “Understanding Cities with Machine Eyes: A Review of Deep Computer Vision in Urban Analytics. ”Cities 96: 102481. doi:10.1016/j.cities.2019.102481.
- James, P., R. F. Banay, J. E. Hart, and F. Laden. 2015. “A Review of the Health Benefits of Greenness.” Current Epidemiology Reports 2 (2): 131–142. doi:10.1007/s40471-015-0043-7.
- Janowicz, K., G. McKenzie, Y. Hu, R. Zhu, and S. Gao. 2019. “Using Semantic Signatures for Social Sensing in Urban Environments.” In Mobility Patterns, Big Data and Transport Analytics, 31–54. Elsevier.
- Johnson, N. S., and H. C. Gabler. 2015. “Injury Outcome in Crashes with Guardrail End Terminals.” Traffic Injury Prevention 16 (sup2): S103–S108. doi:10.1080/15389588.2015.1065976.
- Kang, Y., Q. Jia, S. Gao, X. Zeng, Y. Wang, S. Angsuesser, Y. Liu, X. Ye, and T. Fei. 2019. “Extracting Human Emotions at Different Places Based on Facial Expressions and Spatial Clustering Analysis.” Transactions in GIS 23 (3): 450–480.
- Kang, Y., S. Gao, and Y. Liang. 2018. “Utilizing Reverse Viewshed Analysis in Image Geo-localization.” Proceedings of the 2nd ACM SIGSPATIAL Workshop on Recommendations for Location-based Services and Social Networks, 6. Seattle, WA, USA: ACM.
- Kaplan, S. 1995. “The Restorative Benefits of Nature: Toward an Integrative Framework.” Journal of Environmental Psychology 15 (3): 169–182. doi:10.1016/0272-4944(95)90001-2.
- Knox, P. L., S. A. Marston, and M. Imort. 2016. Human Geography: Places and Regions in Global Context. New York: Pearson.
- Krumm, J., N. Davies, and C. Narayanaswami. 2008. “User-generated Content.” IEEE Pervasive Computing 7 (4): 10–11. doi:10.1109/MPRV.2008.85.
- Larkin, A., and P. Hystad. 2019. “Evaluating Street View Exposure Measures of Visible Green Space for Health Research.” Journal of Exposure Science & Environmental Epidemiology 29 (4): 447. doi:10.1038/s41370-018-0017-1.
- Law, S., B. Paige, and C. Russell. 2019. “Take a Look Around: Using Street View and Satellite Images to Estimate House Prices.” ACM Transactions on Intelligent Systems and Technology (TIST) 10 (5): 54.
- Lawlor, D., C. Bedford, M. Taylor, and S. Ebrahim. 2003. “Geographical Variation in Cardiovascular Disease, Risk Factors, and Their Control in Older Women: British Women’s Heart and Health Study.” Journal of Epidemiology and Community Health 57 (2): 134–140. doi:10.1136/jech.57.2.134.
- LeCun, Y., Y. Bengio, and G. Hinton. 2015. “Deep Learning.” nature 521 (7553): 436–444. doi:10.1038/nature14539.
- Lee, I. M., and D. M. Buchner. 2008. “The Importance of Walking to Public Health.” Medicine and Science in Sports and Exercise 40 (7): S512–S518. doi:10.1249/MSS.0b013e31817c65d0.
- Lee, I-M., E. J. Shiroma., F. Lobelo., P. Puska., S. N. Blair, P. T. Katzmarzyk. 2012. Effect of physical inactivity on major non-communicable diseases worldwide: an analysis of burden of disease and life expectancy. The lancet 380 (9838): 219-229. doi:10.1016/S0140-6736(12)61031-9
- Leon, D. A. 2008. Cities, Urbanization and Health.
- Leslie, E., and E. Cerin. 2008. “Are Perceptions of the Local Environment Related to Neighbourhood Satisfaction and Mental Health in Adults?.” Preventive Medicine 47 (3): 273–278. doi:10.1016/j.ypmed.2008.01.014.
- Lesser, L. I., F. J. Zimmerman, and D. A. Cohen. 2013. “Outdoor Advertising, Obesity, and Soda Consumption: A Cross-sectional Study.” BMC Public Health 13 (1): 20. doi:10.1186/1471-2458-13-20.
- Li, F. 2005. “Multilevel Modelling of Built Environment Characteristics Related to Neighbourhood Walking Activity in Older Adults.” Journal of Epidemiology and Community Health 59 (7): 558–564.
- Li, F., K. J. Fisher, R. C. Brownson, and M. Bosworth. 2005. “Multilevel Modelling of Built Environment Characteristics Related to Neighbourhood Walking Activity in Older Adults.” Journal of Epidemiology and Community Health 59 (7): 558–564. doi:10.1136/jech.2004.028399.
- Li, X., C. Ratti, and I. Seiferling. 2018a. “Quantifying the Shade Provision of Street Trees in Urban Landscape: A Case Study in Boston, USA, Using Google Street View. ”Landscape and Urban Planning 169: 81–91. doi:10.1016/j.landurbplan.2017.08.011.
- Li, X., C. Zhang, and W. Li. 2015a. “Does the Visibility of Greenery Increase Perceived Safety in Urban Areas? Evidence from the Place Pulse 1.0 Dataset.” ISPRS International Journal of Geo-Information 4 (3): 1166–1183. doi:10.3390/ijgi4031166.
- Li, X., C. Zhang, W. Li, R. Ricard, Q. Meng, and W. Zhang. 2015c. “Assessing Street-level Urban Greenery Using Google Street View and a Modified Green View Index.” Urban Forestry & Urban Greening 14 (3): 675–685. doi:10.1016/j.ufug.2015.06.006.
- Li, X., C. Zhang, W. Li, Y. A. Kuzovkina, and D. Weiner. 2015b. “Who Lives in Greener Neighborhoods? The Distribution of Street Greenery and Its Association with Residents’ Socioeconomic Conditions in Hartford, Connecticut, USA.” Urban Forestry & Urban Greening 14 (4): 751–759. doi:10.1016/j.ufug.2015.07.006.
- Li, X., P. Santi, T. K. Courtney, S. K. Verma, and C. Ratti. 2018b. “Investigating the Association between Streetscapes and Human Walking Activities Using Google Street View and Human Trajectory Data.” Transactions in GIS 22 (4): 1029–1044. doi:10.1111/tgis.12472.
- Liu, L., E. A. Silva, C. Wu, and H. Wang. 2017. “A Machine Learning-based Method for the Large-scale Evaluation of the Qualities of the Urban Environment. ”Computers, Environment and Urban Systems 65: 113–125. doi:10.1016/j.compenvurbsys.2017.06.003.
- Liu, Z., A. Yang, M. Gao, H. Jiang, Y. Kang, F. Zhang, and T. Fei. 2019. “Towards Feasibility of Photovoltaic Road for Urban Traffic-solar Energy Estimation Using Street View Image. ”Journal of Cleaner Production 228: 303–318. doi:10.1016/j.jclepro.2019.04.262.
- Liying Zhang Tao Pei, Y.C.C.S.X.L. 2019. “A Review of Urban Environmental Assessment Based on Street View Images.” Journal of Geo-information Science 21 (1): 46.doi:10.12082/dqxxkx.2019.180311.
- Long, Y., and L. Liu. 2017. “How Green Are the Streets? An Analysis for Central Areas of Chinese Cities Using Tencent Street View.” PloS One 12 (2): e0171110. doi:10.1371/journal.pone.0171110.
- Lopez, R. P., and H. P. Hynes. 2006. “Obesity, Physical Activity, and the Urban Environment: Public Health Research Needs.” Environmental Health 5 (1): 25. doi:10.1186/1476-069X-5-25.
- Loukaitou-Sideris, A., and J. E. Eck. 2007. “Crime Prevention and Active Living.” American Journal of Health Promotion 21 (4 suppl): 380–389. doi:10.4278/0890-1171-21.4s.380.
- Lu, Y. 2019. “Using Google Street View to Investigate the Association between Street Greenery and Physical Activity. ”Landscape and Urban Planning 191: 103435. doi:10.1016/j.landurbplan.2018.08.029.
- Lu, Y., C. Sarkar, and Y. Xiao. 2018. “The Effect of Street-level Greenery on Walking Behavior: Evidence from Hong Kong. ”Social Science & Medicine 208: 41–49. doi:10.1016/j.socscimed.2018.05.022.
- Lu, Y., Y. Yang, G. Sun, and Z. Gou. 2019. “Associations between Overhead-view and Eye-level Urban Greenness and Cycling Behaviors. ”Cities 88: 10–18. doi:10.1016/j.cities.2019.01.003.
- Mayne, S., A. Jose, A. Mo, L. Vo, S. Rachapalli, H. Ali, J. Davis, and K. Kershaw. 2018. “Neighborhood Disorder and Obesity-related Outcomes among Women in Chicago.” International Journal of Environmental Research and Public Health 15 (7): 1395. doi:10.3390/ijerph15071395.
- McMichael, A. J. 2000. “The Urban Environment and Health in a World of Increasing Globalization: Issues for Developing Countries.” Bulletin of the World Health Organization 78: 1117–1126.
- Mehrabian, A., and J. A. Russell. 1974. An Approach to Environmental Psychology. MIT Press.
- Mertens, L., S. Compernolle, B. Deforche, J. D. Mackenbach, J. Lakerveld, J. Brug, C. Roda, et al.. 2017. “Built Environmental Correlates of Cycling for Transport across Europe.” Health & Place 44: 35–42. doi:10.1016/j.healthplace.2017.01.007.
- Mitchell, R., and F. Popham. 2008. “Effect of Exposure to Natural Environment on Health Inequalities: An Observational Population Study.” The Lancet 372 (9650): 1655–1660. doi:10.1016/S0140-6736(08)61689-X.
- Naik, N., J. Philipoom, R. Raskar, and C. Hidalgo. 2014. “Streetscore-predicting the Perceived Safety of One Million Streetscapes.” Proceedings of the IEEE Conference on Computer Vision and Pattern Recognition Workshops, Columbus; United States, 779–785.
- Oja, P., S. Titze, A. Bauman, B. De Geus, P. Krenn, B. Reger-Nash, and T. Kohlberger. 2011. “Health Benefits of Cycling: A Systematic Review.” Scandinavian Journal of Medicine & Science in Sports 21 (4): 496–509. doi:10.1111/j.1600-0838.2011.01299.x.
- Özgüner, H., S. Eraslan, and S. Yilmaz. 2012. “Public Perception of Landscape Restoration along a Degraded Urban Streamside.” Land Degradation & Development 23 (1): 24–33. doi:10.1002/ldr.1043.
- Parsons, R. 1991. “The Potential Influences of Environmental Perception on Human Health.” Journal of Environmental Psychology 11 (1): 1–23. doi:10.1016/S0272-4944(05)80002-7.
- Peng, B., Z. Meng, Q. Huang, and C. Wang. 2019. “Patch Similarity Convolutional Neural Network for Urban Flood Extent Mapping Using Bi-temporal Satellite Multispectral Imagery.” Remote Sensing 11 (21): 2492. doi:10.3390/rs11212492.
- Pliakas, T., S. Hawkesworth, R. J. Silverwood, K. Nanchahal, C. Grundy, B. Armstrong, J. P. Casas, R. W. Morris, P. Wilkinson, and K. Lock. 2017. “Optimising Measurement of Health-related Characteristics of the Built Environment: Comparing Data Collected by Foot-based Street Audits, Virtual Street Audits and Routine Secondary Data Sources. ”Health & Place 43: 75–84. doi:10.1016/j.healthplace.2016.10.001.
- Porzi, L., S. Rota Bulò, B. Lepri, and E. Ricci. 2015. “Predicting and Understanding Urban Perception with Convolutional Neural Networks.” Proceedings of the 23rd ACM international conference on Multimedia, 139–148, New York, NY, USA. ACM.
- Pretty, J., J. Peacock, M. Sellens, and M. Griffin. 2005. “The Mental and Physical Health Outcomes of Green Exercise.” International Journal of Environmental Health Research 15 (5): 319–337. doi:10.1080/09603120500155963.
- Prüss, A. 1998. “Review of Epidemiological Studies on Health Effects from Exposure to Recreational Water.” International Journal of Epidemiology 27 (1): 1–9. doi:10.1093/ije/27.1.1.
- Purciel, M., K. M. Neckerman, G. S. Lovasi, J. W. Quinn, C. Weiss, M. D. Bader, R. Ewing, and A. Rundle. 2009. “Creating and Validating Gis Measures of Urban Design for Health Research.” Journal of Environmental Psychology 29 (4): 457–466. doi:10.1016/j.jenvp.2009.03.004.
- Quercia, D., N. K. O’Hare, and H. Cramer. 2014. “Aesthetic Capital: What Makes London Look Beautiful, Quiet, and Happy?” Proceedings of the 17th ACM conference on Computer supported cooperative work & social computing, Baltimore, Maryland, USA, 945–955. ACM.
- Quinn, J. W., S. J. Mooney, D. M. Sheehan, J. O. Teitler, K. M. Neckerman, T. K. Kaufman, G. S. Lovasi, M. D. Bader, and A. G. Rundle. 2016. “Neighborhood Physical Disorder in New York City.” Journal of Maps 12 (1): 53–60. doi:10.1080/17445647.2014.978910.
- Rathore, M. M., A. Ahmad, A. Paul, and S. Rho. 2016. “Urban Planning and Building Smart Cities Based on the Internet of Things Using Big Data Analytics. ”Computer Networks 101: 63–80. doi:10.1016/j.comnet.2015.12.023.
- Roda, C., H. Charreire, T. Feuillet, J. Mackenbach, S. Compernolle, K. Glonti, M. Ben Rebah, et al.. 2016. “Mismatch between Perceived and Objectively Measured Environmental Obesogenic Features in European Neighbourhoods.” Obesity Reviews 17: 31–41. doi:10.1111/obr.12376.
- Rouse, J., Jr, R. Haas, J. Schell, and D. Deering. 1974. Monitoring Vegetation Systems in the Great Plains with ERTS.
- Rundle, A. G., M. D. Bader, C. A. Richards, K. M. Neckerman, and J. O. Teitler. 2011. “Using Google Street View to Audit Neighborhood Environments.” American Journal of Preventive Medicine 40 (1): 94–100. doi:10.1016/j.amepre.2010.09.034.
- Rzotkiewicz, A., A. L. Pearson, B. V. Dougherty, A. Shortridge, and N. Wilson. 2018. “Systematic Review of the Use of Google Street View in Health Research: Major Themes, Strengths, Weaknesses and Possibilities for Future Research. ”Health & Place 52: 240–246. doi:10.1016/j.healthplace.2018.07.001.
- Saelens, B. E., and S. L. Handy. 2008. “Built Environment Correlates of Walking: A Review.” Medicine and Science in Sports and Exercise 40 (7 Suppl): S550. doi:10.1249/MSS.0b013e31817c67a4.
- Sallis, J. F., M. F. Floyd, D. A. Rodríguez, and B. E. Saelens. 2012. “Role of Built Environments in Physical Activity, Obesity, and Cardiovascular Disease.” Circulation 125 (5): 729–737. doi:10.1161/CIRCULATIONAHA.110.969022.
- Schneider, A., M. A. Friedl, and D. Potere. 2010. “Mapping Global Urban Areas Using Modis 500-m Data: New Methods and Datasets Based on ‘Urban Ecoregions’.” Remote Sensing of Environment 114 (8): 1733–1746. doi:10.1016/j.rse.2010.03.003.
- Seresinhe, C. I., T. Preis, and H. S. Moat. 2015. “Quantifying the Impact of Scenic Environments on Health. ”Scientific Reports 5: 16899. doi:10.1038/srep16899.
- Silva, V., A. Grande, C. Rech, and M. Peccin. 2015. “Geoprocessing via Google Maps for Assessing Obesogenic Built Environments Related to Physical Activity and Chronic Noncommunicable Diseases: Validity and Reliability.” Journal of Healthcare Engineering 6 (1): 41–54. doi:10.1260/2040-2295.6.1.41.
- Su, S., Y. Gong, B. Tan, J. Pi, M. Weng, and Z. Cai. 2017. “Area Social Deprivation and Public Health: Analyzing the Spatial Non-stationary Associations Using Geographically Weighed Regression.” Social Indicators Research 133 (3): 819–832. doi:10.1007/s11205-016-1390-6.
- Subiza-Pérez, M., L. Vozmediano, and C. San Juan. 2019. “Welcome to Your Plaza: Assessing the Restorative Potential of Urban Squares through Survey and Objective Evaluation Methods.” Cities 102461.
- Suel, E., J. W. Polak, J. E. Bennett, and M. Ezzati. 2019. “Measuring Social, Environmental and Health Inequalities Using Deep Learning and Street Imagery.” Scientific Reports 9 (1): 6229. doi:10.1038/s41598-019-42036-w.
- Sun, G., J. Zhao, C. Webster, and H. Lin. 2020. “New Metro System and Active Travel: A Natural Experiment. ”Environment International 138: 105605. doi:10.1016/j.envint.2020.105605.
- Svoray, T., M. Dorman, G. Shahar, and I. Kloog. 2018. “Demonstrating the Effect of Exposure to nature on Happy Facial Expressions via Flickr Data: Advantages of Non-intrusive Social Network Data Analyses and Geoinformatics Methodologies. ”Journal of Environmental Psychology 58: 93–100. doi:10.1016/j.jenvp.2018.07.006.
- Swinburn, B. A., G. Sacks, K. D. Hall, K. McPherson, D. T. Finegood, M. L. Moodie, and S. L. Gortmaker. 2011. “The Global Obesity Pandemic: Shaped by Global Drivers and Local Environments.” The Lancet 378 (9793): 804–814. doi:10.1016/S0140-6736(11)60813-1.
- Takano, T., K. Nakamura, and M. Watanabe. 2002. “Urban Residential Environments and Senior Citizens’ Longevity in Megacity Areas: The Importance of Walkable Green Spaces.” Journal of Epidemiology and Community Health 56 (12): 913–918. doi:10.1136/jech.56.12.913.
- Taylor, B. T., P. Fernando, A. E. Bauman, A. Williamson, J. C. Craig, and S. Redman. 2011. “Measuring the Quality of Public Open Space Using Google Earth.” American Journal of Preventive Medicine 40 (2): 105–112. doi:10.1016/j.amepre.2010.10.024.
- Ulrich, R. 1984. “View through a Window May Influence Recovery.” Science 224 (4647): 224–225. doi:10.1126/science.6143402.
- Ulrich, R. S. 1979. “Visual Landscapes and Psychological Well-being.” Landscape Research 4 (1): 17–23. doi:10.1080/01426397908705892.
- Ulrich, R. S., R. F. Simons, B. D. Losito, E. Fiorito, M. A. Miles, and M. Zelson. 1991. “Stress Recovery during Exposure to Natural and Urban Environments.” Journal of Environmental Psychology 11 (3): 201–230. doi:10.1016/S0272-4944(05)80184-7.
- Van Kamp, I., K. Leidelmeijer, G. Marsman, and A. De Hollander. 2003. “Urban Environmental Quality and Human Well-being: Towards a Conceptual Framework and Demarcation of Concepts; a Literature Study.” Landscape and Urban Planning 65 (1–2): 5–18. doi:10.1016/S0169-2046(02)00232-3.
- Vanwolleghem, G., D. Van Dyck, F. Ducheyne, I. De Bourdeaudhuij, and G. Cardon. 2014. “Assessing the Environmental Characteristics of Cycling Routes to School: A Study on the Reliability and Validity of a Google Street View-based Audit.” International Journal of Health Geographics 13 (1): 19. doi:10.1186/1476-072X-13-19.
- Vargo, J., B. Stone, and K. Glanz. 2012. “Google Walkability: A New Tool for Local Planning and Public Health Research?.” Journal of Physical Activity & Health 9 (5): 689–697. doi:10.1123/jpah.9.5.689.
- Velarde, M. D., G. Fry, and M. Tveit. 2007. “Health Effects of Viewing Landscapes–Landscape Types in Environmental Psychology.” Urban Forestry & Urban Greening 6 (4): 199–212. doi:10.1016/j.ufug.2007.07.001.
- Villeneuve, P., R. Ysseldyk, A. Root, S. Ambrose, J. DiMuzio, N. Kumar, M. Shehata, et al.. 2018. “Comparing the Normalized Difference Vegetation Index with the Google Street View Measure of Vegetation to Assess Associations between Greenness, Walkability, Recreational Physical Activity, and Health in Ottawa, Canada.” International Journal of Environmental Research and Public Health 15 (8): 1719.
- Vlahov, D., N. Freudenberg, F. Proietti, D. Ompad, A. Quinn, V. Nandi, and S. Galea. 2007. “Urban as a Determinant of Health.” Journal of Urban Health 84 (1): 16–26. doi:10.1007/s11524-007-9169-3.
- Wang, F. 2020. “Why Public Health Needs Gis: A Methodological Overview.” Annals of GIS 26 (1): 1–12. doi:10.1080/19475683.2019.1702099.
- Wang, R., M. Helbich, Y. Yao, J. Zhang, P. Liu, Y. Yuan, and Y. Liu. 2019a. “Urban Greenery and Mental Wellbeing in Adults: Cross-sectional Mediation Analyses on Multiple Pathways across Different Greenery Measures. ”Environmental Research 176: 108535. doi:10.1016/j.envres.2019.108535.
- Wang, R., Y. Liu, Y. Lu, J. Zhang, P. Liu, Y. Yao, and G. Grekousis. 2019b. “Perceptions of Built Environment and Health Outcomes for Older Chinese in Beijing: A Big Data Approach with Street View Images and Deep Learning Technique.” Computers, Environment and Urban Systems 78: 101386. doi:10.1016/j.compenvurbsys.2019.101386.
- Wang, R., Y. Lu, J. Zhang, P. Liu, Y. Yao, and Y. Liu. 2019c. “The Relationship between Visual Enclosure for Neighbourhood Street Walkability and Elders’ Mental Health in China: Using Street View Images. ”Journal of Transport & Health 13: 90–102. doi:10.1016/j.jth.2019.02.009.
- Wang, R., Y. Yuan, Y. Liu, J. Zhang, P. Liu, Y. Lu, and Y. Yao. 2019d. “Using Street View Data and Machine Learning to Assess How Perception of Neighborhood Safety Influences Urban Residents’ Mental Health. ”Health & Place 59: 102186. doi:10.1016/j.healthplace.2019.102186.
- Wang, W., S. Yang, Z. He, M. Wang, J. Zhang, and W. Zhang. 2018. “Urban Perception of Commercial Activeness from Satellite Images and Streetscapes.” Companion Proceedings of the The Web Conference 2018. International World Wide Web Conferences Steering Committee, Lyon, France, 647–654.
- Wang, Z., Q. Liang, F. Duarte, F. Zhang, L. Charron, L. Johnsen, B. Cai, and C. Ratti. 2019e. “Quantifying Legibility of Indoor Spaces Using Deep Convolutional Neural Networks: Case Studies in Train Stations.” Building and Environment.
- Wilson, J. S., C. M. Kelly, M. Schootman, E. A. Baker, A. Banerjee, M. Clennin, and D. K. Miller. 2012. “Assessing the Built Environment Using Omnidirectional Imagery.” American Journal of Preventive Medicine 42 (2): 193–199. doi:10.1016/j.amepre.2011.09.029.
- Wilson, N., G. Thomson, and R. Edwards. 2015. The potential of Google Street View for studying smokefree signage. Australian and New Zealand Journal of Public Health 39 (3): 295-296. doi:10.1111/1753-6405.12361
- Wilson, N., G. Thomson, and R. Edwards. 2015. “The Potential of Google Street View for Studying Smokefree Signage.” Australian and New Zealand Journal of Public Health 39 (3): 295–296. doi:10.1111/1753-6405.12361.
- Won, J., C. Lee, S. N. Forjuoh, and M. G. Ory. 2016. “Neighborhood Safety Factors Associated with Older Adults’ Health-related Outcomes: A Systematic Literature Review. ”Social Science & Medicine 165: 177–186. doi:10.1016/j.socscimed.2016.07.024.
- Wu, Y. T., P. Nash, L. E. Barnes, T. Minett, F. E. Matthews, A. Jones, and C. Brayne. 2014. “Assessing Environmental Features Related to Mental Health: A Reliability Study of Visual Streetscape Images.” BMC Public Health 14 (1): 1094. doi:10.1186/1471-2458-14-1094.
- Yang, J., L. Zhao, J. Mcbride, and P. Gong. 2009. “Can You See Green? Assessing the Visibility of Urban Forests in Cities.” Landscape and Urban Planning 91 (2): 97–104. doi:10.1016/j.landurbplan.2008.12.004.
- Yang, Y., Y. Lu, L. Yang, Z. Gou, and X. Zhang. 2020. “Urban Greenery, Active School Transport, and Body Weight among Hong Kong Children. ”Travel Behaviour and Society 20: 104–113. doi:10.1016/j.tbs.2020.03.001.
- Yao, Y., Z. Liang, Z. Yuan, P. Liu, Y. Bie, J. Zhang, R. Wang, J. Wang, and Q. Guan. 2019. “A Human-machine Adversarial Scoring Framework for Urban Perception Assessment Using Street-view Images.” International Journal of Geographical Information Science 33 (12): 2363–2384. doi:10.1080/13658816.2019.1643024.
- Yin, L., and Z. Wang. 2016. “Measuring Visual Enclosure for Street Walkability: Using Machine Learning Algorithms and Google Street View Imagery. ”Applied Geography 76: 147–153. doi:10.1016/j.apgeog.2016.09.024.
- Yu, T., and R. Wang. 2016. “Scene Parsing Using Graph Matching on Street-view Data. ”Computer Vision and Image Understanding 145: 70–80. doi:10.1016/j.cviu.2016.01.004.
- Zeng, L., J. Lu, W. Li, and Y. Li. 2018. “A Fast Approach for Large-scale Sky View Factor Estimation Using Street View Images. ”Building and Environment 135: 74–84. doi:10.1016/j.buildenv.2018.03.009.
- Zhang, F., B. Zhou, C. Ratti, and Y. Liu. 2019b. “Discovering Place-informative Scenes and Objects Using Social Media Photos.” Royal Society Open Science 6 (3): 181375. doi:10.1098/rsos.181375.
- Zhang, F., B. Zhou, L. Liu, Y. Liu, H. H. Fung, H. Lin, and C. Ratti. 2018b. “Measuring Human Perceptions of a Large-scale Urban Region Using Machine Learning. ”Landscape and Urban Planning 180: 148–160. doi:10.1016/j.landurbplan.2018.08.020.
- Zhang, F., D. Zhang, Y. Liu, and H. Lin. 2018a. “Representing Place Locales Using Scene Elements. ”Computers, Environment and Urban Systems 71: 153–164. doi:10.1016/j.compenvurbsys.2018.05.005.
- Zhang, F., F. Duarte, R. Ma, D. Milioris, H. Lin, and C. Ratti. 2016. “Indoor Space Recognition Using Deep Convolutional Neural Network: A Case Study at MIT Campus.” arXiv Preprint arXiv:161002414.
- Zhang, F., J. Zu, M. Hu, D. Zhu, Y. Kang, S. Gao, Y. Zhang, and Z. Huang. 2020. “Uncovering Inconspicuous Places Using Social Media Check-ins and Street View Images. ”Computers, Environment and Urban Systems 81: 101478. doi:10.1016/j.compenvurbsys.2020.101478.
- Zhang, F., L. Wu, D. Zhu, and Y. Liu. 2019a. “Social Sensing from Street-level Imagery: A Case Study in Learning Spatio-temporal Urban Mobility Patterns. ”ISPRS Journal of Photogrammetry and Remote Sensing 153: 48–58. doi:10.1016/j.isprsjprs.2019.04.017.
- Zhang, W., W. Li, C. Zhang, D. M. Hanink, X. Li, and W. Wang. 2017. “Parcel-based Urban Land Use Classification in Megacity Using Airborne Lidar, High Resolution Orthoimagery, and Google Street View. ”Computers, Environment and Urban Systems 64: 215–228. doi:10.1016/j.compenvurbsys.2017.03.001.
- Zhou, B., A. Lapedriza, J. Xiao, A. Torralba, and A. Oliva. 2014. “Learning Deep Features for Scene Recognition Using Places Database.” In Advances in Neural Information Processing Systems, 487–495.