
ABSTRACT
The nationwide tertiary hospital catchment areas, known as the Dartmouth Hospital Referral Regions (HRRs), were created based on the 1992–1993 Medicare data in the U.S., to reflect referral patterns of hospitals and hospitalization patterns of patients for specialized medical cares at that time. Nowadays, those outdated HRRs have still been chosen as analytical units in most if not all studies in the U.S. where large and high-level hospital service areas are needed. This pilot study aimed to evaluate whether the HRR boundaries have significantly varied over time in Florida. The Dartmouth method was replicated to construct the contemporary HRRs in Geographic Information Systems with 2011 Florida State Inpatient Database. The contemporary HRRs and Dartmouth HRRs were visually and statistically compared in several function-related aspects. The contemporary HRRs included 38 eligible units, twice the number of (19) Dartmouth HRRs, with a comparable level of self-containment (p = 0.634) on average. This reflects the diffusion of specialized medical services such as cardiovascular surgeries among hospitals in the past 2-3 decades The contemporary HRRs hold values for a variety of health policy themes, including hospital policy-making, optimization of healthcare systems, and measurement of competition in healthcare markets.
1. Introduction
To reduce costs related to patient travel distance for hospitalization, maintain revenue at local hospitals, and promote a locally favourable patient-doctor relationship, a set of nationwide hierarchical healthcare facility catchment areas for the U.S. were pioneered by Dartmouth Atlas based on the Medicare data in 1992–1993, i.e. Hospital Service Areas (HSAs) and Hospital Referral Regions (HRRs) (Center for Evaluative Clinical Sciences Citation1999). The HSAs delineate where most local hospitalization occurs, i.e. where most of the patients living in a given HSA go to hospitals that are located in the same HSA; the HRRs are aggregations of several HSAs (i.e. HSAs are completely nested in HRRs), where most patients are referred for major cardiovascular and neurological surgeries (Center for Evaluative Clinical Sciences Citation1999; Jia, Wang, and Xierali Citation2017a; Jia Citation2016; Jia, Shi, and Xierali Citation2019; Klauss et al. Citation2005). Both sets of boundaries are designed to aid local hospital healthcare market analysis and resource allocation, and neither of them is consistent with any of the traditional administrative boundaries such as county, city, township, or any census tabulation unit, such as census tract and block group, or ZIP code (Center for Evaluative Clinical Sciences Citation1999). The currently used HSAs and HRRs are also known as the Dartmouth HSAs and Dartmouth HRRs, respectively.
The Dartmouth HRRs have been chosen as analytical units in a growing body of studies, such as nationwide geographic variation in per capita physician supply (Goodman and Fisher Citation2008), access to care or preventive care (Radley and Schoen Citation2012), performance of hospitals (Jha et al. Citation2005), patients’ experiences in hospitals (Jha et al. Citation2008), Medicare drug spending (Zhang, Baicker, and Newhouse Citation2010), and healthcare spending, utilization, and quality (Newhouse et al. Citation2013). Examining spatial patterns of those healthcare utilization characteristics could promote the equity of hospital performances, which could further stimulate quality improvement, transparency and accountability (Stavrou, Ward, and Pearson Citation2012). However, recent work has suggested that HRRs are too large to reflect local variation (Zhang et al. Citation2012). This is not surprising as the Dartmouth HRRs were produced based on a single-payer (Medicare) dataset more than two decades ago. Since then, healthcare resources and services and tertiary healthcare markets have dramatically changed in the U.S. Although a wide variety of healthcare-related studies carried out on the basis of the Dartmouth HRRs, this set of spatial units has not been comprehensively and quantitatively evaluated in any study. This is important in that the choice of spatial unit may have significant implications for conclusions drawn due to the well-known Modifiable Area Unit Problem (MAUP) (Stavrou, Ward, and Pearson Citation2012; Swift, Liu, and Uber Citation2008). Given the concerns regarding the underlying changes in population, hospitals, and healthcare provision and demand over the past two decades, plus a recent call that the Dartmouth HSAs were urgently in need of an update (Jia, Xierali, and Wang Citation2015), it is time to evaluate whether the Dartmouth HRRs also need an overhaul.
To achieve the goal of comprehensively evaluating the effectiveness and efficiency of the Dartmouth HRRs and temporal changes of underlying healthcare travel patterns over time, this study 1) assessed whether the Dartmouth HRRs were still representative of contemporary travel patterns of hospital patients, 2) produced the contemporary HRRs based on recently created HSAs and tertiary discharge records, and 3) compared the contemporary HRRs with the Dartmouth HRRs in the function-related aspects, including the number of HRR units, self-containment of units, number of hospitals within HRR units, and surgery rates and average hospital charges within HRRs. This study provides evidence for future research endeavours on updating or re-delineating the HRRs and refining the research findings and policy recommendations that were based on the use of the Dartmouth HRRs.
2. Methods
2.1. Study area and data sources
The study area is the state of Florida in the southeastern U.S. With three facets bordered by water (west, south, and east), this unique geographic location makes Florida an ideal locale for such a pilot study, due to the limited edge effect in terms of the possibilities of patients to travel across state boundaries for hospital care.
The State Inpatient Database (SID) in 2011, assembled, edited, and standardized by the Agency for Healthcare Research and Quality (AHRQ) as part of the Healthcare Cost and Utilization Project (HCUP) (Agency for Healthcare Research and Quality Citation2011), was used in this study to produce the contemporary HRRs. The recently created HSAs were obtained from a previous study, wherein Florida was divided into 78 HSA units on the basis of all hospital discharge records from the the same dataset (Jia, Xierali, and Wang Citation2015). The Dartmouth HRR units completely, or partly (as the Dartmouth HRRs were created on a national scale), located in Florida were extracted from the nationwide HRR map in a GIS format (Geographic Information Systems) (Center for Evaluative Clinical Sciences Citation1999).
2.2. Extracting tertiary discharge records
Based on the definition of the Dartmouth HRRs, the specialized patients in this study were defined as the patients receiving at least one surgery on the cardiovascular or nervous systems in 2011, in contrast to the overall patients (i.e. all patients recorded in the 2011 SID). We used the Clinical Classification Software (CCS), developed based on the International Classification of Diseases, 9th Revision, Clinical Modification (ICD-9-CM), for aggregating patient diagnoses and procedures into a manageable number of clinically meaningful categories. The corresponding attributes in the SID were DXCCS (diagnosis classification) and PRCCS (procedure classification). A total of 377,601 specialized discharge records were extracted from the 2011 SID in Florida, which included 358,487 cardiovascular discharges (PRCCS code between 43 and 63) from 214 hospitals and 22,673 neurological discharges (PRCCS code between 6 and 9) from 181 hospitals, with 33,559 discharges receiving both types of surgeries during their hospitalization. Cardiovascular surgical services were provided in all 181 hospitals that provided neurological services, which were also called specialized hospitals.
2.3. Evaluating the Dartmouth HRRs
The specialized discharge records covered by all types of insurance status including self-pay were extracted from the 2011 SID and geocoded by patients’ residential ZIP codes. The specialized patient-to-hospital travel flows were constructed based on their residential ZIP codes and the hospitals they visited, and subsequently matched to the Dartmouth HRRs. A localization index (LI) (Klauss et al. Citation2005; Jia, Xierali, and Wang Citation2015) was defined as the fraction of specialized discharges of HRR residents that occurred within their own HRR, and was adapted to measure the degree of self-containment of the Dartmouth HRRs. For example, an LI value of 1 denoted that all tertiary hospital care for residents was provided within their HRRs. According to the eligibility rules for the Dartmouth HRR, only the HRR units with LI ≥0.65 were considered as independent, eligible HRRs. (Center for Evaluative Clinical Sciences Citation1999)
2.4. Constructing the contemporary HRRs
The Dartmouth method was replicated to construct the contemporary HRRs on the basis of the recently created HSAs and specialized discharge records, in order to be comparable with the Dartmouth HRRs. However, this replication was conducted at a finer scale than the original Dartmouth method, i.e. HSAs were assigned to specialized hospitals instead of cities. The eligibility rules for Dartmouth HRRs were also applied whereby both a minimum population size of 120,000 and LI ≥0.65 needed to be satisfied within each eligible HRR. (Center for Evaluative Clinical Sciences Citation1999) A brief recap of the production of the recently created HSAs (Step 1–4) and a description of the aggregation and adjustment processes for the contemporary HRRs (Step 5–7), illustrated in , were also described as follows:
Each hospital was assigned to a ZIP code by location, which was referred to as a hospital region;
Each remaining ZIP code was assigned to the hospital region that most patients in that ZIP code visited, and the ZIP codes assigned to the same hospital region were grouped into an initial HSA;
Each disconnected ZIP code was re-assigned to an adjacent initial HSA that admitted more patients from that ZIP code relative to other adjacent initial HSA(s), to ensure the geographic contiguity of all ZIP codes in each initial HSA;
Each initial HSA with LI <0.5 was iteratively merged into the neighbouring initial HSA that admitted more patients from that initial HSA relative to other neighbouring HSA(s), to ensure LI ≥0.5 for all final HSAs;
Each final HSA was further assigned to a specialized hospital to which most specialized patients in that HSA were referred, and each collection of HSAs assigned to the same specialized hospital formed an initial HRR;
Each initial HRR with LI <0.65 was merged with an adjacent initial HRR that admitted more patients from that initial HRR relative to other adjacent HRR(s), to ensure LI ≥0.65 for all combined HRRs;
Each HRR with a population size <120,000 was merged with an adjacent HRR that admitted more patients from that HRR relative to other adjacent HRR(s), to ensure the population size ≥120,000 for all combined HRRs, which were also referred to as contemporary HRRs.
Figure 1. Flowchart for generating the contemporary Hospital Referral Regions (HRRs). LI – Localization Index.
2.5. Comparing new and original Dartmouth HRRs
The contemporary HRRs and Dartmouth HRRs were visually and statistically compared in terms of the number of HRR units, LI, and number of hospitals within HRR units. Boundaries of the contemporary HRRs were overlaid with those of the Dartmouth HRRs for a visual comparison. A two-independent sample t-test was used for comparing the mean LIs of two sets of HRRs, prior to which a natural log transformation was conducted to alleviate the skewed distribution of two groups of LIs.
In order to elucidate the influences of changes of HRR boundaries on health services research, Florida’s discharge records in 2011 were assigned to both contemporary HRRs and Dartmouth HRRs to calculate 1) percentage of invasive surgical procedures performed among all cardiovascular and neurological discharges, also termed surgery rate, and 2) average hospital charges for cardiovascular and neurological surgeries within two sets of units separately. Furthermore, two sets of boundaries were overlaid to examine the variation in the contemporary HRR-level surgery rates and the average hospital inpatient charges within original HRRs. Notably, HRR was assumed to be the most basic analytical unit for tertiary healthcare studies, so surgery rates and hospital charges were considered homogeneous within HRRs.
Given a set of features and an associated attribute, Local Moran’s I (Anselin, Syabri, and Kho Citation2006) was the most common spatial statistics to identify spatial clusters of features with values similar in magnitude (i.e. clusters of high or low values) and spatial outliers (i.e. high values surrounded by low values, or low values surrounded by high values) based on feature locations and values simultaneously. This study utilized Local Moran’s I to measure clustering patterns of cardiovascular and neurological surgery rates and average hospital charges across Dartmouth HRRs and contemporary HRRs separately.
All statistical and spatial analyses were conducted in SPSS 24 (IBM Corporation, USA, 2016) and ArcGIS v10.6.1 (ESRI, Redland, CA, USA), respectively.
3. Results
3.1. Contemporary HRRs
The recently created HSAs in Florida consisted of 78 units that were merged from 983 ZIP codes, with LI ranging from 0.50–0.93 and a mean of 0.65 ± 0.12 (standard deviation). The specialized hospital admitting the largest percentage of specialized patients from a given HSA was identified as the main specialized hospital for that HSA. The percentage of specialized patients referred to their main hospitals among 78 HSAs ranged from 18.6% to 75.1%, with a mean of 47.5%±14.0%. Assigning each HSA to its main hospital and grouping all HSAs assigned to the same hospital, 78 HSAs were further aggregated into 73 initial HRRs with LI from only 0.50–0.93 and a mean of 0.67 ± 0.12, despite a global LI = 0.73 on the basis of the initial HRR boundaries (i.e. 1,725,130 out of 2,376,743 patients stayed within their HRRs for hospitalization). Enforcing local LI ≥0.65, 73 initial HRRs were merged into 41 units with LI ranging from 0.65–0.97, with a mean of 0.80 ± 0.09 and the global LI increased to 0.83, which were further merged into 38 final HRRs after enforcing population size ≥120,000. The final HRRs (i.e. the contemporary HRRs) had LI remain from 0.65–0.97, with a mean of 0.81 ± 0.09 and a similar global LI of 0.83 (precisely 0.834, increased from 0.831 for the initial HRRs).
3.2. Comparing Dartmouth and contemporary HRRs
There were 19 Dartmouth HRR units completely or partly located in Florida, with each HRR labelled by the name of the core city within that HRR (). Four units crossed Florida’s northern boundary. Most areas of the AL-Dothan HRR were located in Alabama, within which most of the patients living on the south (Florida’s) side of the state boundary were referred to the specialized hospitals in Dothan for cardiovascular and neurological surgeries. Such phenomenon also existed in other three boundary-crossing HRRs (FL-Pensacola, FL-Tallahassee, and FL-Jacksonville), but was in a converse situation that most of the patients within those three HRRs and living on the north (Alabama’s) side of the state boundary were referred to Pensacola, Tallahassee, and Jacksonville for cardiovascular and neurological surgeries.
Figure 2. Boundaries of the Dartmouth HRRs and the contemporary HRRs.
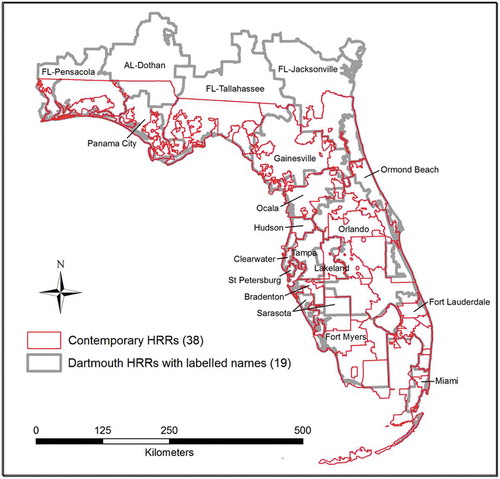
After overlaying the contemporary HRRs with the Dartmouth HRRs where each metropolitan area constituted one HRR, one can see that, as of 2011, a varying number of self-contained tertiary healthcare markets have emerged within some metropolitan areas (). For example, the Orlando HRR included completely or partly 10 new HRR units; Fort Lauderdale and Fort Myers HRRs included 5 new units; Miami HRR was divided into three units, and each of Pensacola, Ocala, Hudson, and Ormond Beach HRRs was split into two separate units. The boundaries of some HRRs have remained roughly the same over the past two decades, such as Gainesville, Clearwater, St Petersburg, Tampa, Lakeland, Bradenton, and Sarasota. Tallahassee and Jacksonville HRRs, although with a large part of their areas located outside of Florida in 1992–1993, their remaining areas within Florida could independently stand as self-contained HRRs in 2011. The Floridian part of the AL-Dothan HRR was primarily combined with the Panama City HRR into a new HRR in 2011.
Of the 19 Dartmouth HRRs, the numbers of hospitals included in one HRR ranged from one to 33, with an average of 10 hospitals in each HRR and the LIs ranging from 0.34 to 0.98. Of the 38 contemporary HRRs, the numbers of hospitals included in one HRR ranged from two to 14, with an average of five hospitals in each HRR. There were not significant differences (two-tailed p = 0.634) in the log-transformed LIs for the contemporary HRRs (mean = −0.185, SD = 0.231) and Dartmouth HRRs (mean = −0.207, SD = 0.104). Therefore, a two-fold increase in the number of HRR units did not significantly lower the degree of self-containment of the contemporary HRRs.
3.3. Tertiary surgery rates and hospital charge within HRRs
The rates of cardiovascular/neurological surgeries and average hospital charges for cardiovascular/neurological surgeries were calculated based on Florida’s discharge records in 2011 for both Dartmouth HRRs and contemporary HRRs. Variations of contemporary HRR-level surgery rates and hospital charges were observed within the Dartmouth HRRs to different extents (). For example, the rate of cardiovascular surgeries in the St. Petersburg HRR (51%) remained nearly the same after being measured over the new HRR units (51–52%). In most of the Dartmouth HRR units, the rates calculated over the new HRR units varied around the ones over the Dartmouth HRRs. For example, the rates of cardiovascular surgeries calculated over the new HRR units (45–58%) within the Orlando HRR varied around the rate of the Orlando HRR (52%). In some Dartmouth HRR units, the rates calculated over the new HRR units have generally increased. For example, the rate of cardiovascular surgeries was 45% in the Lakeland HRR; however, the rates calculated over the new HRRs ranged from 46–57% within the Lakeland HRR.
Table 1. Rates of and average hospital charges for invasive cardiovascular and neurological surgeries of the Dartmouth HRRs (Value*) and their variation within the Dartmouth HRRs (Variation**).
The influences of changes of HRR boundaries on the clustering patterns of surgery rates () and hospital charges () were illustrated on a broad scale. The clustering patterns of high and low surgery rates changed when adopting different HRR boundaries. The Jacksonville HRR area was a cluster of low rates of cardiovascular surgeries on the Dartmouth HRR map ()), which expanded towards the west to encompass Gainesville and Lake City areas on the contemporary HRR map ()). A cluster of high rates of cardiovascular surgeries (i.e. Sarasota HRR) shifted towards the east to the area between Lake Okeechobee and east coastline (,)). A cluster of high rates of neurosurgeries also shifted towards the east to the same region as did the cluster of high rates of cardiovascular surgeries (,)). A cluster of low rates of neurosurgeries emerged in the Palm Bay area on the contemporary HRR map ()).
Figure 3. Variations in cardiovascular and neurological surgery rates across and within the Dartmouth HRRs (calculated over the contemporary HRRs): (a) cardiovascular surgery rates across the Dartmouth HRRs; (b) cardiovascular surgery rates across the contemporary HRRs; (c) neurological surgery rates across the Dartmouth HRRs; (d) neurological surgery rates across the contemporary HRRs. Red and blue circles highlight statistically significant clusters of high and low values, respectively. The contemporary HRR boundaries are removed for a clearer visualization in (b) and (d). In (b) and (d), the blank areas in the north are outside of Florida, and the blank areas in Florida (‘holes’) are uninhabitable areas (e.g. water bodies, marsh).
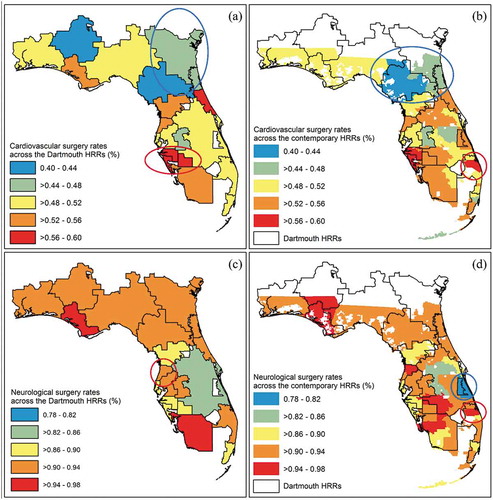
Figure 4. Variations in average hospital charges for cardiovascular and neurological surgeries across and within the Dartmouth HRRs (calculated over the contemporary HRRs): (a) average hospital charges for cardiovascular surgeries across the Dartmouth HRRs; (b) average hospital charges for cardiovascular surgeries across the contemporary HRRs; (c) average hospital charges for neurological surgeries across the Dartmouth HRRs; (d) average hospital charges for neurological surgeries across the contemporary HRRs. Red and blue circles highlight statistically significant clusters of high and low values, respectively. The contemporary HRR boundaries are removed for a clearer visualization in (b) and (d). In (b) and (d), the blank areas in the north are outside of Florida, and the blank areas in Florida (‘holes’) are uninhabitable areas (e.g. water bodies, marsh).
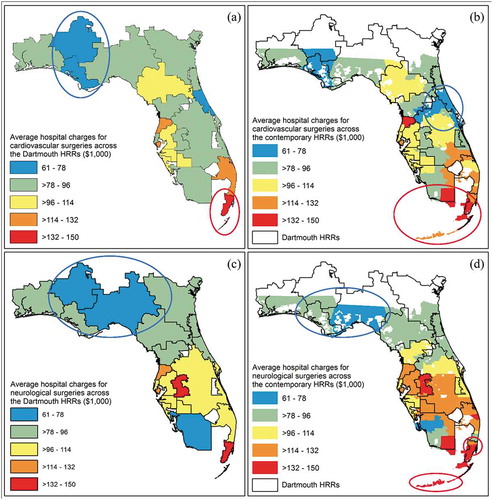
A cluster of high hospital charges for cardiovascular surgeries has remained in Miami and Key West areas over the past two decades (,)). The relatively low hospital charges for cardiovascular surgeries clustered in the Panama City area on the Dartmouth HRR map ()), and moved to the Ormond Beach area on the contemporary HRR map ()). A cluster of low hospital charges for neurological surgeries has remained in Panama City and Tallahassee areas over the past two decades (,)). Two clusters of high hospital charges for neurological surgeries emerged in North Miami and Key West areas on the contemporary HRR map ()).
4. Discussion
The Dartmouth HRRs have been considered the banner analytical unit in a growing body of healthcare related studies, which means that some characteristics and performances of the hospitals, especially those related to tertiary healthcare, are considered homogeneous within the HRRs, such as performance rates of and hospital charges for cardiovascular and neurological surgeries. Given the prominent roles of the HRRs in healthcare studies, the original 1992–1993 Medicare-based Dartmouth HRRs need to be re-delineated based on contemporary and overall patient data, to be representative of the overall population. This study replicated the Dartmouth method in Florida on the basis of the specialized discharge data from all Floridian hospitals in 2011, to produce the contemporary HRRs. The contemporary HRRs were found comparable with the Dartmouth HRRs in terms of the extent of self-containment of HRR units. Compared to the Dartmouth HRRs, the contemporary HRRs doubled the number of HRR units (38 versus 19) and halved the number of hospitals on average within the HRRs (5 versus 10). Differences of HRR boundaries have produced the variation in rates of and average hospital charges for cardiovascular and neurological surgeries within the Dartmouth HRR units, and also changed the clustering patterns of surgery rates and hospital charges at a state level.
The traditional method for HRR delineation has been restricted by limited availability of fine-scale characteristics of health data (e.g. patient addresses in hospital records) and capacity for implementing spatial analyses. The Dartmouth HRR boundaries are outdated due primarily to data and technical limitations as well as the increasing number of specialized hospitals, which result in the emergence of sub-markets within the original healthcare markets. In this study, we located hospitals in ZIP codes and assigned HSAs to hospital ZIP codes instead of cities, to construct the contemporary HRRs at a finer scale than did the traditional Dartmouth method. A smaller number of hospitals within the contemporary HRRs on average makes it rather easier to identify sources of variations among HRRs (e.g. hospital performance and charge).
Both the boundaries of HRRs and underlying HSAs have significantly changed over the past two decades: there were 78 units in the recently created HSAs compared to 114 units in the Dartmouth HSAs, and there were 38 units in the contemporary HRRs compared to 19 units in the Dartmouth HRRs. The variation implied that patients have generally covered a longer distance to hospitals; on the other side, more hospitals have provided cardiovascular surgery services as surgical capacities diffused over the years, patients with specialized needs did not have to travel as far as before to receive specialized services. These variations in the travel patterns of general and specialized patients should be utilized in future efforts for delineating both the HRRs and HSAs, which are expected to have a greater level of technical sophistication and automation, and a lesser degree of data dependency (Jia, Wang, and Xierali Citation2017b, Citation2019; Jia and Xierali Citation2015). For example, a refined Huff model (Jia, Wang, and Xierali Citation2017b) and a community detection method (Hu, Wang, and Xierali Citation2018) might be potential optimistic approaches due to their ability to capture travel behaviours of patients and to partition nodes in a network into natural groups, respectively. Also, the changed HSA and HRR boundaries may also reflect alteration of the underlying healthcare markets in a variety of aspects, such as hospital practice and spending, as shown in this study.
Another strength of the contemporary HRRs is that it is built with all-payer data as compared to Dartmouth HRRs which depended on a single-payer (i.e. Medicare) dataset. While early studies found that the Medicare-only data may be largely representative of the general population for healthcare seeking behaviours, (Chernew et al. Citation2010) such an assumption needs to be reassessed given the changes in the U.S. healthcare landscape in the last two decades. The differences in health insurance coverages, for instance, private vs public health insurances, can impact patient travel patterns differently and may explain part of the differences between contemporary HRRs vs Dartmouth HRRs. (Jia, Wang, and Xierali Citation2019)
Some limitations of this study remain and need to be overcome in future efforts. First, patients seeking different types of specialized services may demonstrate varying travel patterns, and they need to be examined separately prior to being merged together. For example, cardiovascular and neurological patients may show different patterns in terms of travelling for respective services. Secondly, to make the definition of specialized services in this study compatible with the previous one defined by the Dartmouth Institute for Health Policy and Clinical Practice (IHPCP), some other tertiary services were not included for constructing HRRs, such as cancer surgeries. The scope of specialized services needs to be refined based on more solid and contemporary evidence. Thirdly, the contemporary HRRs in Florida were produced in an isolated environment without taking into account any influence from other states, such as the patients going to out-of-state hospitals and the out-of-state patients going to hospitals in Florida. Those contemporary HRRs in northern Florida should be used with caution, as new HRR boundaries may vary when considering the data from neighbouring states. For example, Dothan, serving as the main commercial and economic hub for a significant part of southeastern Alabama, possesses several prominent hospitals that offer plenty of specialized services. A considerable portion of patients residing in the new HRR unit that comprised the FL-Panama City HRR and part of the AL-Dothan HRR in the Dartmouth HRR system, may still go to hospitals in Dothan for tertiary surgeries. This also implies that the landscape of healthcare delivery as indicated by a nationwide analysis of HRRs could be locally different from what is indicated by statewide HRRs alone, especially those areas near state boundaries. Given the necessity of updating the Dartmouth HRRs, a set of nationwide HRRs based on up-to-date hospital discharge/admission data seems warranted. Unfortunately, the HCUP data used for this study in Florida are only available for selected states, not nationwide. Furthermore, the medical field is experiencing an explosion of knowledge and development of new drug and more effective, also less invasive, surgical procedures. This could explain some of the differences between the Dartmouth HRRs and contemporary HRRs, which further calls for update to the Dartmouth HRRs.
Overall, this study is the first to evaluate the popular Dartmouth HRRs. It not only demonstrates the necessity of updating the Dartmouth HRRs, but also paves the way for future studies assessing and maintaining the effectiveness of rational HRRs. The contemporary HRRs hold values for a wide variety of health policy themes, including hospital policy-making, optimization of healthcare systems and resources, measurement of competition in healthcare markets, and studies relevant to health-seeking behaviour of patients, especially of chronically ill patients (e.g. obesity and cardiovascular disease). More broadly, this study serves as a demonstration of how spatial epidemiological approaches and big health data could be utilized to evaluate and improve health-related products (e.g. concepts, boundaries) on the basis of the traditional datasets, (Jia et al. Citation2019; Jia Citation2019) and holds great potential to revolutionize the understanding of public health and healthcare systems in countries where new big (health) data are rapidly emerging and increasingly available. (Jia and Yang Citation2020)
Acknowledgements
We thank the International Institute of Spatial Lifecourse Epidemiology (ISLE) for the research support.
Disclosure statement
No potential conflict of interest was reported by the authors.
References
- Agency for Healthcare Research and Quality. 2011. Healthcare Cost and Utilization Project (HCUP) State Inpatient Databases (SID) - Florida. Rockville, MD.
- Anselin, L., I. Syabri, and Y. Kho. 2006. “GeoDa: An Introduction to Spatial Data Analysis.” Geographical Analysis 38 (1): 5–22. doi:10.1111/j.0016-7363.2005.00671.x.
- Center for Evaluative Clinical Sciences. 1999. The Dartmouth Atlas of Health Care in the United States. Chicago, IL.
- Chernew, M. E., L. M. Sabik, A. Chandra, T. B. Gibson, and J. P. Newhouse. 2010. “Geographic Correlation between Large-firm Commercial Spending and Medicare Spending.” The American Journal of Managed Care 16 (2): 131–138.
- Goodman, D. C., and E. S. Fisher. 2008. “Physician Workforce Crisis? Wrong Diagnosis, Wrong Prescription.” The New England Journal of Medicine 358 (16): 1658–1661. doi:10.1056/NEJMp0800319.
- Hu, Y., F. Wang, and I. M. Xierali. 2018. “Automated Delineation of Hospital Service Areas and Hospital Referral Regions by Modularity Optimization.” Health Services Research 53 (16): 236–255.
- Jha, A. K., Z. Li, E. J. Orav, and A. M. Epstein. 2005. “Care in U.S. Hospitals–the Hospital Quality Alliance Program.” The New England Journal of Medicine 353 (3): 265–274. doi:10.1056/NEJMsa051249.
- Jha, A. K., E. J. Orav, J. Zheng, and A. M. Epstein. 2008. “Patients’ Perception of Hospital Care in the United States.” The New England Journal of Medicine 359 (18): 1921–1931. doi:10.1056/NEJMsa0804116.
- Jia, P. 2016. Developing a Flow-based Spatial Algorithm to Delineate Hospital Service Areas. Applied Geography 75: 137–143. doi:10.1016/j.apgeog.2016.08.008.
- Jia, P. 2019. “Spatial Lifecourse Epidemiology.” Lancet Planet Health 3 (2): e57–e9. doi:10.1016/S2542-5196(18)30245-6.
- Jia, P., X. Shi, and I. Xierali. 2019. “Teaming up Census and Patient Data to Delineate Fine-scale Hospital Service Areas and Identify Geographic Disparities in Hospital Accessibility.” Environmental Monitoring and Assessment 191 (Suppl S2): 303. doi:10.1007/s10661-019-7413-4.
- Jia, P., F. Wang, and I. Xierali. 2017a. “Delineating Hierarchical Hospital Service Areas in Florida.” Geographical Review 107 (4): 608–623. doi:10.1111/j.1931-0846.2016.12207.x.
- Jia, P., F. Wang, and I. Xierali. 2017b. “Using a Huff-based Model to Delineate Hospital Service Areas.” The Professional Geographer 69 (4): 522–530. doi:10.1080/00330124.2016.1266950.
- Jia, P., F. Wang, and I. Xierali. 2019. “Differential Effects of Distance Decay on Hospital Inpatient Visits among Subpopulations in Florida.” Environmental Monitoring and Assessment 191 (Suppl S2): 381. doi:10.1007/s10661-019-7468-2.
- Jia, P., and I. Xierali. 2015. Disparities in Patterns of Health Care Travel among Inpatients Diagnosed with Congestive Heart Failure, Florida, 2011. Preventing Chronic Disease 12: E150. doi:10.5888/pcd12.150079.
- Jia, P., I. Xierali, and F. Wang. 2015. Evaluating and Re-demarcating the Hospital Service Areas in Florida. Applied Geography 60: 248–253. doi:10.1016/j.apgeog.2014.10.008.
- Jia, P., H. Xue, S. Liu, H. Wang, L. Yang, T. Hesketh, L. Ma, et al. 2019. “Opportunities and Challenges of Using Big Data for Global Health.” Science Bulletin 64 (22): 1652–1654. doi:10.1016/j.scib.2019.09.011.
- Jia, P., and S. Yang. 2020. “Time to Spatialize Epidemiology in China.” Lancet Global Health 8 (5): e764-e765. doi:10.1016/S2214-109X(20)30120-0.
- Klauss, G., L. Staub, M. Widmer, and A. Busato. 2005. “Hospital Service Areas – A New Tool for Health Care Planning in Switzerland.” BMC Health Services Research 5 (1): 33. doi:10.1186/1472-6963-5-33.
- Newhouse, J. P., A. M. Garber, R. P. Graham, M. A. McCoy, M. Mancher, and A. Kibria. 2013. Variation in Health Care Spending: Target Decision Making, Not Geography. Institute of Medicine: National Academies Press.
- Radley, D. C., and C. Schoen. 2012. “Geographic Variation in Access to Care–the Relationship with Quality.” The New England Journal of Medicine 367 (1): 3–6. doi:10.1056/NEJMp1204516.
- Stavrou, E. P., R. Ward, and S. A. Pearson. 2012. “Oesophagectomy Rates and Post-resection Outcomes in Patients with Cancer of the Oesophagus and Gastro-oesophageal Junction: A Population-based Study Using Linked Health Administrative Linked Data.” BMC Health Services Research 12: 384.
- Swift, A., L. Liu, and J. Uber. 2008. “Reducing MAUP Bias of Correlation Statistics between Water Quality and GI Illness.” Computers, Environment and Urban Systems 32 (2): 134–148. doi:10.1016/j.compenvurbsys.2008.01.002.
- Zhang, Y., K. Baicker, and J. P. Newhouse. 2010. “Geographic Variation in Medicare Drug Spending.” The New England Journal of Medicine 363 (5): 405–409. doi:10.1056/NEJMp1004872.
- Zhang, Y., S. H. Baik, A. M. Fendrick, and K. Baicker. 2012. “Comparing Local and Regional Variation in Health Care Spending.” The New England Journal of Medicine 367 (18): 1724–1731. doi:10.1056/NEJMsa1203980.