
ABSTRACT
Social media (e.g., Twitter and Facebook) can be regarded as vital sources of information during disasters to improve situational awareness (SA) and disaster management since they play a significant role in the rapid spread of information in the event of a disaster. Due to the volume of data is far beyond the capabilities of manual examination, existing works utilize natural language processing methods based on keywords, or classification models relying on features derived from text and other metadata (e.g., user profiles) to extract social media data contributing to SA and automatically categorize them into the relevant classes (e.g., damage and donation). However, the design of the classification schema and the associated information extraction methods are far less than straightforward and highly depend on: (1) the event type, (2) the study or analysis purpose, and (3) the social media platform used. To this end, this paper reviews the literature for extracting social media data and provides an overview of classification schemas that have been used to assess SA in events involving natural hazards from five different analytical perspectives (content, temporal, user, sentiment, and spatiotemporal) by discussing the prevalent topic categories, disaster event types, purpose of studies, and platforms utilized from each schema. Finally, this paper summarizes classification methods, and platforms that are most commonly used for each disaster event type, and outlines a research agenda with recommendations for future innovations.
1. Introduction
Social media has been an emerging phenomenon used in many studies to enhance situational awareness (SA) and assist disaster management (DM) in events involving natural hazards. As opposed to traditional media such as newspaper, TV, and radio, using social media has many unique benefits (Al-Saggaf and Simmons Citation2015; Sutton, Palen, and Shklovski Citation2008; Beigi et al. Citation2016; Mandel et al. Citation2012):
Convenience in assessing information and expressing emotions. While traditional news sources have a general focus on crises, people rely on social media to get information on localized impact (Shklovski, Palen, and Sutton Citation2008). The public uses social media to communicate and assess the damage and situation without having to deal with filtered information or censorship.
Participation in an interactive, decentralized, and large-scale discussion. Al-Saggaf and Simmons (Citation2015) suggest that social media may mediate a more decentralized discussion from groups of people who may not have much of a voice in public in the event of a disaster due to heightened emotions.
Insight to the situation from different perspectives and locations. Having information on people’s personal emotions, feelings, opinions, and perspectives may help assist first responders in determining the level of damage and help identify victims’ locations, expediting recovery processes because it narrows down where help is needed (Beigi et al. Citation2016). Utilizing social media can also provide additional information for sentiment analysis, real-time insight, and public perception towards a disaster.
A cheap and efficient way to receive real-time updates. Sutton, Palen, and Shklovski (Citation2008) describe social media as ‘backchannel communication,’ a secret, unofficial, or irregular means of communication as opposed to the official or formal communications to the public. ‘Backchannel communications’ allow for a wide-scale interaction that can be used to provide the public with additional supporting information because it causes users to be active participants in discussions rather than passive listeners.
Although social media provides a convenient, cheap and efficient way to gain real-time information, there are two major issues should be addressed when using social media for disaster communication: (1) Among the massive social media data collected during a period for a specific event or topic (e.g., natural hazard), only some of the messages posted by users are relevant to the event, and even much fewer messages contribute to SA. Based on our Twitter data analysis on the 2012 Hurricane Sandy event, less than 3% of collected data were disaster relevant. Among these messages, a majority of them were relevant to personal feelings and emotions, resulting in only 0.75% SA relevant data that could help extract ‘actionable’ information; and (2) although serving as an efficient platform for consistently broadcasting SA information, social media has also been criticized for being a channel to transfer rumours (Hall and Park Citation2012; Oh, Kwon, and Rao Citation2010). Because social media has increased the scope of information sharing by opening it up to the public, the risk of getting false or inaccurate information is also increased. Alexander (Citation2014) believes that with news coming from all types of sources, information received may be misleading, distorted, alarmist, or susceptible to rumour propagation. These issues can become a problem, especially when information sources are scarce, as rumours are more likely to be posted and re-posted, increasing the ‘sense of chaos and insecurity in the local population’ (Alexander, Citation2014).
As such, there should be a methodology to quickly identify and extract the most accurate and relevant information from social media. Due to the volume of data being far beyond the capabilities of manual examination, current approaches utilize natural language processing (NLP) methods based on keywords or classification models relying on features derived from text and other metadata (e.g., user profiles, temporal information) to find social media data relative to disasters and automatically categorize them into the relevant classes (e.g., damage and donation). To build a classification model, a coding schema is necessary to separate them into different categories before they can be made actionable for SA. Information about casualties, damages, donation efforts, or public alerts are more likely to be used and extracted to improve SA during a time-critical event. Correspondingly, many existing works classified social media messages into these major categories (Imran et al. Citation2015; Vieweg Citation2011). To consider the temporal evolution and classify social media data into stages of disaster management (mitigation, preparedness, emergency response, and recovery), Huang and Xiao (Citation2015) designed a coding schema with 42 topic categories. Different types of users (e.g., new reporters, general public, celebrities) may witness and experience different aspects of the disaster event. Therefore, a few studies develop different classification schema for the message contributors and consider their sentiment, emotions, and personal feelings of message contributor by classifying messages into categories (e.g., subjective, positive, negative, ironic) or ranges of integer (−5 to +5) that express the user’s response to the disaster event (Buscaldi and Hernandez-Farias Citation2015; Caragea et al. Citation2014).
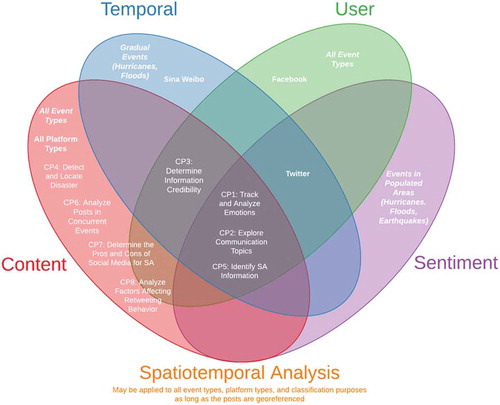
To sum up, the design of the coding schema and associated message extraction methods are far less than straightforward since they highly depend on different disaster event types (Sakaki, Okazaki, and Matsuo Citation2013; Verma et al. Citation2011; Buscaldi and Hernandez-Farias Citation2015), the classification (or analytical) purpose (CP) of the event (Takayasu et al. Citation2015; Gurman and Ellenberger Citation2015; Vo and Collier Citation2013), and the social media platforms (Rosser, Leibovici, and Jackson Citation2017; Terpstra et al. Citation2012) that allow users to share different types of messages (e.g., text and photos) for analysis (e.g., content, temporal, user, sentiment, and spatiotemporal analysis) . For example, to detect the occurrence of an earthquake, Sakaki, Okazaki, and Matsuo (Citation2013) used spatiotemporal analysis and designed a classifier that can identity event-related tweets. Likewise, Verma et al. (Citation2011) developed a classifier through content classification for four different crisis events to automatically extract SA messages. Buscaldi and Hernandez-Farias (Citation2015) applied sentiment classification in the event of a flood to identify tweets that may be useful for SA. Despite having the same CP of identifying content relevant to SA, as well as using the same platform (Twitter), these three studies used different classification schemas since they were analysing different event types. Alternatively, Takayasu et al. (Citation2015), Gurman and Ellenberger (Citation2015), and Vo and Collier (Citation2013) had different CPs so they used different classification schemas despite analysing the same event type and utilizing the same platform. In the event of an earthquake, Takayasu et al. (Citation2015) examined the rate of rumour diffusion on Twitter through user classification to determine if social media is a credible source for information on disasters. Gurman and Ellenberger (Citation2015) used content classification to explore communication topics and what people are discussing on Twitter at different phases of an earthquake. Vo and Collier (Citation2013) tracked and analysed people’s emotions during an earthquake through sentiment classification. Finally, studies may use different classification schemas because they are using different social media platforms despite analysing the same event for the same CP. Rosser, Leibovici, and Jackson (Citation2017) used spatiotemporal analysis to estimate the probability of flood inundation from geotagged images on Flickr, while Terpstra et al. (Citation2012) used temporal classification to examine the possibilities of real-time and automated analysis of Twitter messages in the event of a crisis. Both of these studies had the purpose to determine the credibility of social media as an information source during the event of a flood, but used different classification schemas as they were using different platforms.
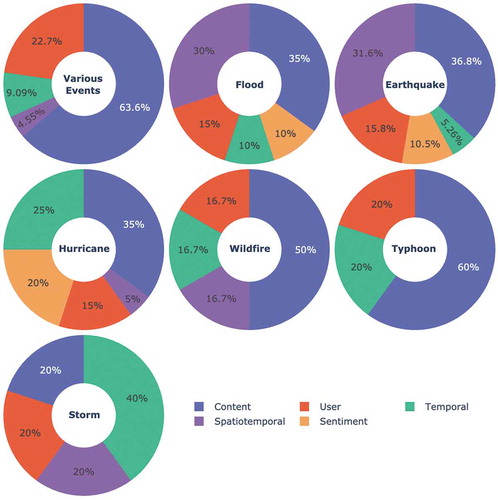
Figure 1. Content, temporal, user, and sentiment, and spatiotemporal analysis of social media data during different event types (bold and italicized), and for different classification (or analytical) purposes (normal text) with different platform types (bold)
Although there are existing reviews of the use of social media and disaster management (Houston et al. Citation2015; Luna and Pennock Citation2018; Wiegmann et al. Citation2020), there is currently no comprehensive review of the classification schemas and social media platforms most commonly used on different types of natural disaster events. Therefore, this review article intends to fill this gap by providing an overview of classification schemas that have been used to assess SA in events involving natural hazards from five different approaches or analytical perspectives. Four of these approaches analyse the contents from different classification aspects: (1) message content, (2) event temporal evaluation or different stages of DM, (3) user type, and (4) sentiment or emotion expressed by the users. The fifth approach is a general spatiotemporal analysis for social media content that helps support SA without the use of classification Section 2.5.
In addition, this paper summarizes (1) the content topics or information categories are commonly extracted and examined from the social media datasets for the four classification schemas listed previously, (2) what types of social media platforms and events effectively leverage social media for each of the five, (3) what was the most prevalent classification purpose for each event, (4) what social media platforms are most popular, and (5) what classification schemas are most popular for each event. In particular, the analysis results indicate that (1) for content classification, the top five major categories of topics extracted through social media data include information, others, personal expression and experience, help and requests, and sentiment/emotion; (2) the event type most frequently studied for each classification schema is various event types for content (33%) and user analysis (29%), hurricane for temporal (36%) and sentiment analysis (50%), and flood (37%) and earthquake (37%) for spatiotemporal analysis; (3) among the nine classification or study purposes observed in the literature, the most common ones include: identifying tweets contributing to SA and disaster management for content analysis (33%), exploring communication topics and what people are discussing on social media over the course of a disaster for temporal (40%) and user (37%) analysis, and tracking and analysing people’s emotions and feelings during a time of crisis for sentiment (67%); (4) Twitter has been the most prevalent platform for SA extraction across the majority of event types studied; and (5) the most frequently used classification method is content classification. Finally, this paper introduces a research agenda for SA message classification and extraction methods.
2. Methodology
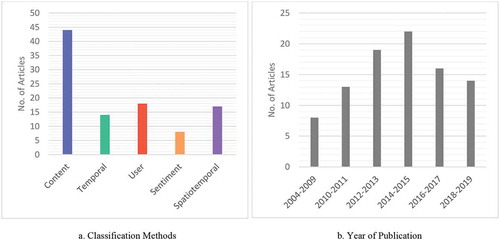
To develop a framework of social media data for natural disaster analysis, we conducted a comprehensive literature review of relevant articles. We used Google Scholar to search for scientific literature that employed the terms ‘social media’, ‘natural hazard’, and ‘situational awareness’. From our search, we obtained 493 results. Of those results, we manually selected literature that appeared relevant to our topic of interest, based on the title, and examined them further. The reference sections of the articles we reviewed were also searched for additional literature. Ultimately, we retained sources that clearly employed social media on natural disaster detection, response and mitigation. This review article is based on 92 distinctive manuscripts that delineate various aspects of the use of social media during natural disasters. classifies these articles according to the classification method they use and the years they were published . The sum of the number of articles for all classification methods in exceed 92 since multiple manuscripts employ more than one classification method. Shown as , previous studies mostly focus on in the content classification and analysis with a peak between 2014 and 2015.
Figure 2. Classification of articles according to classification methods and year of publication of each manuscript
2.1. Classification methods
This section reviews and summarizes the classification methods for social media content and users. Studies that analyse social media content in more than one approach are listed in more than one categorization type table. For each method, the contents (purpose, event type, platform) from each study will be summarized in one provides the definition of each CP abbreviation codes listed in the ‘purpose’ column of the contents of the study table. In addition to the contents, the frequency of each topic from all studies will be summarized in another table. For studies that did not specify which social media platforms they used and studies that are review papers, the platform type in the table is listed as just ‘Various platforms’ with no further details. Studies from Shklovski, Palen, and Sutton (Citation2008), (Citation2010)) and Perez-Lugo (Citation2004) conducted interviews and questionnaires on people who use social media rather than collecting data from the social media platform itself. We listed the platform type for this occasion as ‘Various platforms (Interview data)’ due to the multiple platforms that the interviewees may have access to.
Table 1. Classification purpose (CP) abbreviation codes and their definitions
2.2. Content classification
Content classification includes studies that classify social 7edia messages by their content or keywords. This classification method is often implemented through an automatic classifier and is used for various event types such as flood, wildfire, hurricanes, tsunamis, and more. The content classification aims to filter out noise and identify tweets/posts relevant to support SA.
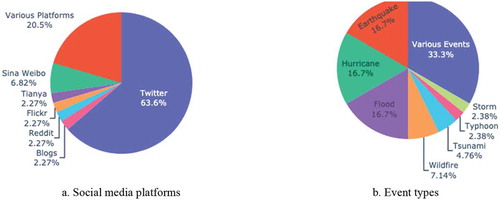
Of the reviewed studies, datasets generated various social media platforms are collected and classified, such as Twitter, Sina-Weibo, Facebook, LinkedIn, YouTube, wikis, discussion forums (e.g., Reddit, Tianya), and blogs (e.g., Blogspot, LiveJournal). Specifically, the majority (64%) of the studies used Twitter for content classification . Twitter is a microblogging platform used by large segments of the population that allows users to write brief text updates and share them with an audience online, which explains why it is popular for content classification. Sina-Weibo is often called the ‘Chinese Twitter,’ and is one of the biggest microblogging platforms in China. Unlike blogging sites that generally have no word limit and updates according to the blogger, microblogging sites usually limit each post to 140 to 150 words and updates in real-time. Flickr is a photo-sharing platform where users share images or videos online rather than text updates. Reddit is a social news and social network site like Facebook, where users can upload content such as links, text posts, and images and start a discussion that other users would then upvote, downvote, and/or comment. Lastly, Tianya is a Chinese internet forum where people can hold discussions online. Most studies use microblogging platforms for content classification since users can casually provide day to day activity updates to other users.
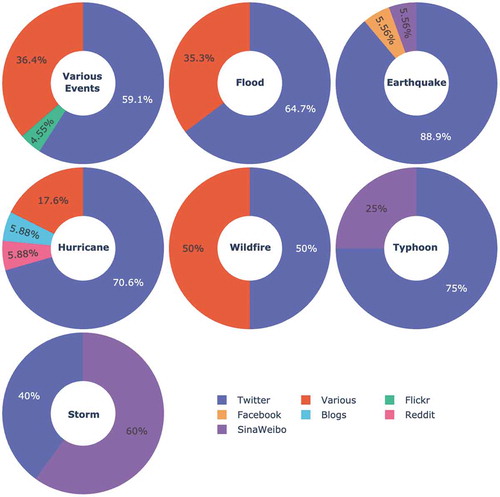
Figure 3. Percentages of different social media platforms (a) and event types (b) for message content classification. Twitter is the most prevalent platform used (63.6%) followed by various platforms (20.5%) for content classification. Other types of platforms alone are not as common, since most articles would use a variety of platforms combined together, with Twitter as an exception. The majority of articles used content classification to analyse various events rather than a single event type, since content classification can be used across all types of events
Although there is currently no official list of topics for content classification, studies that use content classification would include similar classification topics as certain words are most frequently used during the disaster. Vieweg et al. (Citation2010) classified tweets according to the following categories: warning, preparatory activity, hazard location, flood level, weather, wind visibility, road conditions, advice, evacuation information, volunteer information, animal management, and damage/injury reports. Likewise, Chowdhury et al. (Citation2013)’s categories include the following: caution and advice, information source, donation, casualties and damage, and unknown. Wang and Ye (Citation2019) combined geospatial and content data in social media to analyse social responses during the course of the disaster. They extracted informative tweets using an adaptation of Chowdhury et al.’s (Citation2013) categories six categories/topics. The adaptation included an addition of a new topic, weather and environment, since many eyewitness reports concerned weather conditions and physical environment. In addition to the five classification categories (caution and advice, casualties and damage, information sources, infrastructure and resource, and donation and aid),Yu et al. (Citation2019) employed a convolutional neural network (CNN) to predict the themes of tweets from Twitter. Content classification is most often used to extract informative social media content that contributes to SA, which can be done in copious ways where the methodology would depend on the purpose of the study. Text mining and natural language to categorize social media content into different themes are used for extracting useful information. However, if the study serves a different or a more complex purpose, then incorporating other components (e.g. temporal for trend, geospatial for visualization, user for demographics) would help satisfy the purpose the study. For example, Wang and Ye (Citation2019) added a geospatial component to their analysis by using location quotient and Markov transition probability matrix to detect topics concentrated in each area. This combination of geospatial and content data enables a space-time approach to identify SA in the course of a disaster.
Furthermore, this classification method is used on a wide variety of events, with the majority (33%) being more than one type of event (e.g. hurricane and earthquake) within a study . The top two events include floods and earthquakes. Floods are one of the most common hazards in the United States and are caused by several events including hurricanes and tropical storms. People affected by floods usually experience feelings of helplessness or hopelessness since the physical destruction of floods often includes infrastructure damages such as houses, bridges, and cars. Earthquakes are also a common event, but they are usually considered minor. Other natural disasters are not as common as floods and earthquakes but they still cause damages and emotional distress. For example, the 2018 Hurricane Michael caused an estimated 25.1 billion dollars in damages as well as life-threatening conditions for affected residents. Although wildfires are not as common as other disasters and usually occur in remote areas near forests, they are destructive and can still cause emotional distress for people in nearby areas. The 2018 Woolsey Fire in Los Angeles and Ventura Counties of the U.S. state of California burned 96,949 acres of land, destroyed 1,643 structures, killed 3 people, and caused the evacuation of more than 295,000 people. In any of these disaster events, the community can experience disruption due to loss of communication or communication challenges (Simon, Goldberg, and Adini Citation2015). When traditional sources of communication channels fail, people can seek and share information through social media. Data extraction from social media streams through content analysis can filter out noise that may be irrelevant to SA and the disaster event as well as sort vast amounts of real-time information into categories that emergency managers can readily access.
Besides being used for a wide range of event types, the reviewed studies using content analysis also use this schema for various classification purposes (CP), which can be referred to in . The CPs of these studies are listed from most to least prevalent as follows: CP5 (32%), CP2 (30%), CP1 (13%), CP3 (10%), CP6 (7%), CP4 (3%), CP8 (3%), and CP7 (2%) .
Table 2. Studies that use content classification and their purpose, event type, and platform used
Finally, the content categories includes information, others, personal expression and experience, help and requests, emotion, people, discussion, resources and services, action-related, damage/impact, irrelevant, response, sources, infrastructure and utilities, relief and recovery, safety and security, caution and advice, warnings and alerts, technology or media-related, information seeking, politics and government, community building, donations and fundraising, location/disaster area, and preparation. Due to space limitations, the full version of , which includes the subcategories, can be seen in the Appendix.
Table 3. Content classification topic categories (see appendix for details)
2.3. Temporal classification
Temporal classification categorizes social media content according to the time they are posted in relation to the event of the natural disaster. Most studies divide the duration of the event into three stages: pre-incident, during the incident, and post-incident (Chowdhury et al. Citation2013; Iyengar, Finin, and Joshi Citation2011; Hughes and Palen Citation2009; Wang, Ye, and Tsou Citation2016). Houston et al. (Citation2015) took the same approach but at a much finer level by adding the categories in between the three general stages such as including the ‘pre-event to event’ stage, which would go in between the pre-incident and during incident stages. Other studies temporally categorize social media posts using the user response during each phase of the disaster: preparedness, response, impact, and recovery (Huang and Xiao Citation2015; Perez-Lugo Citation2004). Fang et al. (Citation2019) used Pearson correlation coefficient on informative social media data they have collected for each hour with hourly observed precipitation data to examine the relationships between social media activities and the evolution of the storm. By identifying topics that are most prevalent throughout each phase of the disaster, social media can be used to provide information on the disaster’s influence on human activities and psychological activities.
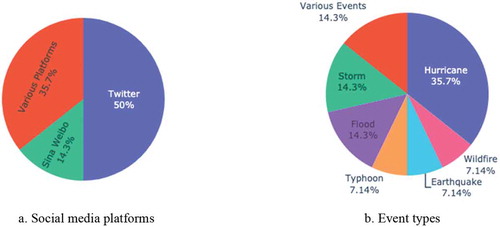
This classification method is most frequently used on hurricane (36%), followed by a tie between floods and various events (14%) . Hurricanes and floods are both events that happen gradually and require different emergency responses at different stages. The three main stages of response to hurricanes include preparedness (pre-hurricane), response (during the hurricane), and recovery (post-hurricane). During preparedness, people need information on how to handle the disaster such as making evacuation plans and stocking food and water. During the response phase, the main contents of information shift towards action-related tasks such as helping victims, seeking shelter, and preventing further infrastructure damages. Lastly, information surrounding recovery includes raising fundraisers or sentimental activities such as memorializing the dead, giving thanks to emergency responders/firefighters, and sending prayers.
Figure 4. Percentages of different social media platforms (a) and event types (b) for temporal classification. The percentages are mostly divided between Twitter (50%) and various platforms (35.7%). The majority of articles used temporal classification to analyse hurricanes (35.7%), since hurricanes develop gradually and information relating to SA/DM varies at different stages (pre-, during, post-event)
Moving on from topics most frequently used, the most prevalent CPs of studies using temporal analysis are CP2 (40%), CP5 (27%), CP3 (20%), and CP1 (13%) . Temporal classification has three main classification categories including pre-incident, during the incident, and post-incident.
Table 4. Studies that use temporal classification and their purpose, event type, and platform used
Table 5. Temporal classification categories
2.4. User classification
User classification categorizes contents according to the general type/group the author of the post belongs to. Zahra, Imran, and Ostermann (Citation2018) manually categorize users by the type of eyewitness they are, including direct, indirect, vulnerable direct, non-eyewitness. Instead of focusing on the type of eyewitness, Kumar et al. (Citation2013) classify users into four categories based on how they relate to the event according to the content of the user’s post (topic affinity score) and the user’s location (geo-relevancy score). Mandel et al. (Citation2012) categorize users by gender (indicated by their names) and location (from user profile and keywords) to determine their level of concern during a natural disaster. Some studies choose to classify users specifically for their situation, such as Dabner’s (Citation2012) study which discusses an earthquake that affected a school property, so the categories include staff members, students, and other participants. Other studies classify users by their general group, such as citizens/public/ordinary individuals, journalists, media, agencies, celebrities, government, NGOs, etc. (De Longueville, Smith, and Luraschi Citation2009; Choudhury, Diakopoulos, and Naaman Citation2012; Diakopoulos, De Choudhury, and Naaman Citation2012; Kim, Bae, and Hastak Citation2018; Kim and Hastak Citation2018; Takahashi, Tandoc, and Carmichael Citation2015).
Like content classification, user classification is used on a wide variety of event types, with the majority being various events (28%), followed by flood (17%), then earthquake (17%) (). User classification would be reasonable to use for events that affect a large per cent of the population, like floods, since a variety of news sources and/or organizations would have to be involved. Floods greatly affect communities and individuals, with their impacts including deaths, infrastructure damages, depletion of food and resources, and deterioration of health conditions due to waterborne diseases. The Kerala floods (2018) in India killed more than 350 people and trapped thousands of people (‘Why the Kerala floods proved so deadly,’ 2018). Like floods, earthquakes have a destructive nature and can impact large distances. The 2016 Ecuador earthquake killed 272 people, injured more than 2,500 people, destroyed buildings and highways, and affected areas more than 300 miles away from its epicentre (Ellis et al. Citation2016). With such large consequences on the community, copious content on these event types would be posted from a diverse range of sources.
Lastly, the most prevalent CPs of these studies using user classigifaction are CP2 (37%), CP5 (26%), CP3 (16%), CP8 (11%), CP7 (5%), and CP1 (5%) . The user categories for user classification include government organizations (GO), users by type, agencies, individuals/public, non-governmental organizations (NGO), eyewitness, journalists, users by location, other, and users by gender.
Figure 5. Percentages of different social media platforms (a) and event types (b) for user classification. The most prevalent platform used is Twitter (72.2%), followed by various platforms (22.2%), and Facebook (5.56%), The majority of articles used user classification to analyse various events (27.8%), but the percentages are fairly evenly spread between each events. Like content classification, user classification can be used across all types of events
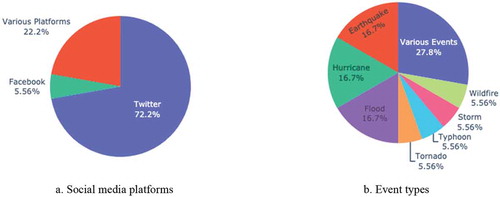
Table 6. Studies that use user classification and their purpose, event type, and platform used
Table 7. User classification categories
2.5. Sentiment classification
Sentiment classification categorizes contents based on expressions of feelings and emotions. The three general categories in sentiment classification are positive, negative, and other (e.g., subjective, ironic, unconcerned). Although these three topics provide broad coverage of emotions, some studies incorporate more detailed categories for a more accurate analysis. For example, Schulz, Paulheim, and Schweizer (Citation2013) used a 7-class sentiment classifier to develop a fine-grained analysis for sentiment analysis. Other studies implement different algorithms to determine the most accurate one for sentiment analysis. Nair, Ramya, and Sivakumar (Citation2017) compared the performances of three different algorithms (Random Forests, Naïve Bayes, and Decision Tree) and found Random Forests to have outperformed the others with the least number of misclassification instances during the Chennai Flood in India. Caragea et al. (Citation2014) used Naïve Bayes and SVM and found that the performance of SVM provides more accuracy than that of Naïve Bayes. In agreement with Buscaldi and Hernandez-Farias (Citation2015), Vo and Collier (Citation2013) found positive tweets to not be useful in sentiment analysis during a disaster, so they replaced the categories ‘Happiness’ and ‘Pleasantness’ in tweets that are considered positive to ‘Calm’ instead.
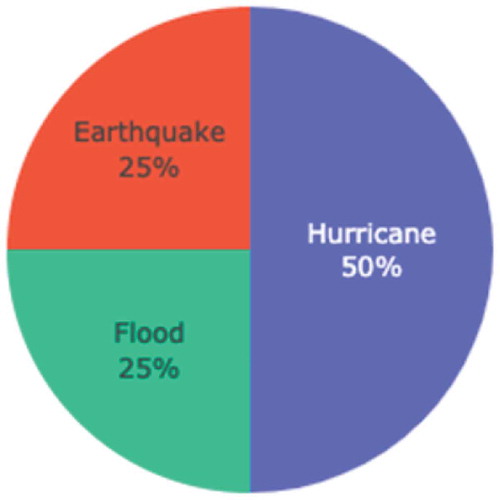
This classification method is used with three event types: hurricanes (50%), floods (25%), and earthquakes (25%) . These three event types occur quite frequently and have the potential to cause immense damages to infrastructure, property, and resources. Furthermore, these events often affect a large section of the population, since they can occur in populated urban areas and can span over large distances. The 2005 Hurricane Katrina caused an estimated 108 USD billion in property damage, killed an estimated 1,200 people, and flooded an estimated 80% of the city of New Orleans (Gibbens Citation2019). The Chiapas earthquake (2017) killed at least 61 people in Mexico and destroyed an estimated 20% to 30% of houses in the city (Villegas, Malkin, & Semple, Citation2017). With such devastating aftermath, people often experience emotional distress in the face of these events and would seek out information on how to mitigate the disaster.
Figure 6. Percentages of different social media platforms for sentiment classification. The most prevalent event that articles used user classification to analyze is hurricane (50%), followed by earthquake (25%), then flood (25%)
Finally, the most prevalent CPs of studies using sentiment classification are CP1 (67%), CP5 (22%), and CP2 (11%) . The main classification categories that studies use for sentiment classification include negative, positive, and other. Studies that do not classify their contents by categories do so using a range of integers (Wang and Taylor Citation2018; Caragea et al. Citation2014; Zou et al. Citation2019).
Table 8. Studies that use sentiment classification and their purpose, event type, and platform used
Table 9. Sentiment classification categories
2.6. General spatiotemporal analysis without classification
Rather than classifying social media contents into categories, general spatiotemporal analysis utilizes the time and location of the post to support SA by helping relief organizations locate and prioritize their responses (). Earle, Bowden, and Guy (Citation2011) implemented a detector that runs when there is a rapid increase in the frequency of tweets containing keywords relating to the disaster. Information relating to the tweet such as tweet creation time, text, and user location are then used for analysis to identify tweets from users who are within the areas affected by the disaster. Fohringer et al. (Citation2015) showed an effective way to create an inundation map of the flood from social media by filtering geolocated posts from social media using keywords related to the disaster. Cervone et al. (Citation2016) monitored real-time data from Twitter, remote sensing images, and relevant posts from social media to assess the damages during the course of a natural disaster. Guan and Chen (Citation2014) measured the ‘degree of disaster’ to analyse disaster evolvement temporally and geographically throughout different regions by using the pre-impact phase as the reference point to compare the Twitter activity to the during – and post-impact phases.
Table 10. Studies that use spatiotemporal analysis without classification and their purpose, event type, and platform used
This method is used with events including earthquakes (35%), flood (35%), hurricane (6%), wildfire (6%), storm (6%), various events (6%), and blizzard (6%). The spatiotemporal analysis is most typically used with earthquakes and floods , which may be due to the patterns of the event that change over time. Spatiotemporal analysis can illuminate any outliers and/or anomalies that may occur through time and space.
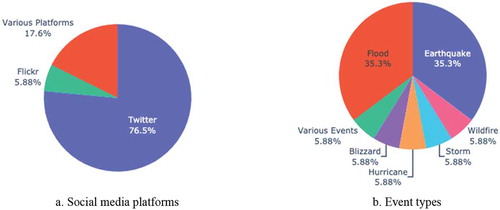
Figure 7. Percentages of different social media platforms (a) and event types (b) for spatiotemporal analysis. The most prevalent platform used is Twitter (76.5%), followed by various platforms (17.6%), and Flickr (5.88%), The majority of articles used user classification to analyse earthquake (35.3%), with flood (35.3%) coming in second. Hurricane, wildfire, storm, various events, and blizzard share the same percentages (5.88%)
3. Discussion
Based on existing studies we reviewed, we discuss (1) event analysis and (2) category analysis. As shown in , content classification has been the most prevalent classification method throughout all types of event: various events (64%), flood (35%), earthquake (37%), hurricane (35%), wildfire (50%), typhoon (60%), tsunami (100%), storm (20%). Events that have a relatively high temporal classification method include hurricane (25%), storm (20%), and typhoon (20%). Spatiotemporal classification is commonly used in earthquake (32%), flood (30%), and storm (20%). Sentiment classification is used most often in the event of a hurricane (20%), followed by earthquake (10%) and flood (10%). Lastly, user classification is used quite evenly between most events: storm (20%), various events (23%), typhoon (20%), wildfire (17%), earthquake (16%), flood (15%), and hurricane (15%). There are only a few studies analysing wildfire, typhoon, and storm, so the percentages for these events are most likely exaggerated.
Figure 8. Event analysis based on classification method used. Excluding storm, the most prevalent classification method across all events is content classification. Spatiotemporal classification is the second most prevalent method for flood, earthquake, and wildfire. Sentiment classification is used most extensively in the event of a hurricane. User classification is ubiquitous in all events except for tsunami (not shown in figure) and storm. The figure also does not include blizzard, in which the study uses spatiotemporal analysis
The most prevalent platform across all types of events is Twitter . Various platforms are frequently used in various events (36%), flood (35%), hurricane (18%), and wildfire (50%). Studies that use various platforms often include Twitter and Facebook, which are both platforms commonly used for uploading/sharing photos and commenting on other people’s posts. Content classification is the most prevalent classification method across all events. Following content, user classification is widely used throughout all events as well.
Figure 9. Event analysis based on platform used. Twitter is the most prevalent platform used across all events, including blizzard (not shown in figure due to only being represented by one study). Various platforms is tied with Twitter for wildfire, and is the second most frequently used for various events, flood, and hurricane. Flickr is used only for flood and various events, while Sina-weibo is only used for earthquake, typhoon, and tsunami (not shown in figure)
The figures for both platform and classification method percentages are not shown for storm (three studies), tsunami (two studies), and blizzard (one study) due to the small number of studies reviewed on these events. Both of the two studies on tsunami (Acar and Muraki Citation2011; Landwehr et al. Citation2016) used Twitter and content classification. Likewise, two studies on storm (Kim, Bae, and Hastak Citation2018; Laylavi, Rajabifard, and Kalantari Citation2017) used Twitter, using classification by users and spatiotemporal analysis, respectively. The other study on storm (Yandong Wang et al. Citation2015) used Sina-Weibo and classified posts temporally and by content. Lastly, the study on blizzard (Wang, Wang, and Taylor Citation2017) used Twitter and spatiotemporal classification to investigate the effects of the 2015 blizzard on human mobility using a large volume of Twitter geolocations.
3.1. Content classification
Although we can gain insight into people’s emotions and local conditions at different stages during the disaster through the use of social media, there is a large volume of noise and irrelevant information, especially in areas with a high population. This noise may be coming from many sources such as individual users, advertisement companies, bots, and more. Arthur et al. (Citation2018) avoid this noise by categorizing tweets by time zone, retweets, bot, and relevance. Studies that use content analysis often categorize information-related tweets into different categories, such as hazard information, damage information, mitigation information, and help requests (David, Ong, and Legara Citation2016; Olteanu, Vieweg, and Castillo Citation2015; Vieweg Citation2011; Chowdhury et al. Citation2013; Shaw et al. Citation2013; Temnikova and Castillo Citation2015; Spence et al. Citation2015; Valenzuela, Puente, and Flores Citation2017; Wang and Zhuang Citation2017; Yandong Wang et al. Citation2015; Qu, Wu, and Wang Citation2009; Qu et al. Citation2010;; Vieweg et al. Citation2010).
By categorizing information-related tweets, these studies were able to not only identify tweets useful to enhance SA, but also to determine the extent of the damages from disasters by analysing the topics of communication on social media over the course of the disaster. Having subcategories such as ‘personal’ and ‘community’ under high-level categories like ‘preparation’ or ‘response to warning’ provide an additional filter for different audiences (public, government, emergency responders, etc.) who may find the generated Twitter data useful in an emergency.
Content classification was used across a wide variety of events, with the majority of the studies using the method for more than one natural disaster (various events). The classification categories vary from one study to another, but the purpose of these classifications is to categorize different types of relevant information that would benefit different groups of audiences. The category that is most prevalent throughout all event types that use content classification is ‘information’, which describes all contents that provide useful, relevant information about the event. For flood, the most prevalent categories are ‘discussion,’ ‘requests,’ ‘personal,’ and ‘situational.’ The topic ‘personal’ refers to any type of personal experience, feelings, or emotions. From these topics, the group of audience that uses this information would be the general public or individuals who share their own information with one another. For wildfire, the most prevalent categories are ‘evacuation’ and ‘wildfire.’ Wildfire has been the only event that has ‘evacuation’ as one of the most frequent topics. During wildfires, this information would be beneficial to emergency responders to locate areas where people need to be evacuated and would also be beneficial to the general public to know if which areas to avoid. For a hurricane, the most prevalent categories are “providing,” “help,” “missing,” “damage,” “assistance,” and “status.” These categories show an emphasis on relief and recovery efforts in the event of a hurricane, which is useful to emergency responders and organizations. For earthquake, the categories from each existing studies do not show much significance in certain areas over another, showing the most prevalent categories to be “action-related,” “opinion-related,” “emotion-related,” “community,” “support,” and “people.” For typhoons, the most prevalent categories are “relief,” “help,” and “personal,” which shows consistency with the hurricane category’s theme of relief. For various events, the most prevalent categories are “people,” “awareness,” “personal,” situational,’ and ‘infrastructure.’ Although only two of the reviewed studies (Acar and Muraki Citation2011; Landwehr et al. Citation2016) studied tsunami, Valenzuela, Puente, and Flores (Citation2017) included ‘tsunami’ as a category to classify contents relevant to the earthquake. In addition, Gao, Barbier, and Goolsby (Citation2011) studying various events also had an ‘earthquake/tsunami’ category, grouping contents relating to these two events together. Thus, it may be useful for future studies on earthquakes, especially those with high magnitudes, to include a category for tsunamis.
3.2. Sentiment classification
The study by Verma et al. (Citation2011) showed that categorization of tweets by subjectivity, personal or impersonal style, and linguistic (formal or informal) can help predict whether an individual tweet will contain useful/relevant information, where formal and impersonal tweets usually contain SA information. The classification categories within studies using sentiment analyses vary, but most studies include negative tweets within their categories. Negative tweets include different kinds of negative feelings such as fear, anxiety, and concern, which may provide information on affected locations in need of help, as opposed to positive tweets that are not particularly useful in SA analyses during a disaster (Buscaldi and Hernandez-Farias Citation2015). Rather than categorizing tweets as negative vs. positive, more fine-grained classification on negative tweets could be used to identify different kinds of negative feelings that may provide important insights to emergency responders (Schulz, Paulheim, and Schweizer Citation2013). Vo and Collier (Citation2013) discarded tweets that fall into the ‘Happiness’ and ‘Pleasantness’ categories since they did not contribute much to negative situations like natural disasters. The authors used six different categories to perform sentiment classification on tweets during an earthquake and found that the volume of tweets under the categories Fear and Anxiety correspond to the intensity of earthquakes, and the majority of tweets then fall under the Calm category following the first hours of Fear and Anxiety. Besides using unigrams that express emotions, most studies (Mandel et al. Citation2012; Caragea et al. Citation2014; Buscaldi and Hernandez-Farias Citation2015; Schulz, Paulheim, and Schweizer Citation2013; Vo and Collier Citation2013) also incorporated sentiment features such as emoticons into their machine learning algorithms.
Sentiment analysis should include demographic attributes to sentiment classification and adjust for demographic bias inherent in social media. For example, Mandel et al. (Citation2012) found that women show more levels of concern in tweets than men do. Cho, Jung, and Park (Citation2013) discuss the differences in the characteristic of emotional messages in when the crisis in regionwide as opposed to nationwide. In nationwide crises, social media posts for emotional support generally were not directed towards anyone in particular, while the posts in a more localized crisis usually are personal messages and information directed towards someone related to the user. Sentiment analysis enables us to gain insight into people’s emotions as well as the status/intensity of natural disasters during the course of the event to help better mitigation.
Event types studied using sentiment analysis include hurricanes, floods, and earthquakes. From the existing studies, there are two main types of sentiment classification used: range (Wang and Taylor Citation2018; Caragea et al. Citation2014) and category (Nair, Ramya, and Sivakumar Citation2017; Schulz, Paulheim, and Schweizer Citation2013; Vo and Collier Citation2013; Mandel et al. Citation2012) classification. Studies that use categories for classification examine the different types of emotions including but not limited to anger, disgust, fear, happiness, and relief. These studies have the same general purpose of identifying tweets that contribute to SA and DM by using categories to filter out relevant content. Other studies (e.g., Wang and Taylor Citation2018; Caragea et al. Citation2014) using range-based method, usually classify sentimental contents from negative to positive integers, representing the emotions expressed by the contents. Negative emotions such as anger or fear would be represented as a negative integer, while positive emotions like happiness or gratitude would be represented as a positive integer. The purpose of these studies is to analyse the trend of user response towards the disaster, which would vary according to the phase of the crises. All of the studies using sentiment classification that we analysed have used Twitter as the social media platform. Twitter is usually used for posting about daily activities, which makes it a convenient platform to update one’s daily feelings and emotions.
3.3. User classification
Distinguishing what group the user is in provides insight on what the social media content may be about. Each study categorizes users in their own ways, but most studies include these three main categories: (1) individuals, (2) organizations (3) journalists/media bloggers (Takahashi, Tandoc, and Carmichael Citation2015; Choudhury, Diakopoulos, and Naaman Citation2012; Diakopoulos, De Choudhury, and Naaman Citation2012; Houston et al. Citation2015). Individuals refer to the general public or private citizens who may or may not be within the disaster-affected region. Organizations are structured groups of people that may be facilitating some events associated with the disaster such as relief organizations. Journalists or media bloggers are small or large organizations in traditional media such as a local community blog or a news organization. Knowing which group the user belongs to may also indicate the level of credibility of the content.
Most studies included eyewitnesses in their classification categories. Kumar et al. (Citation2013) found that eyewitnesses generate the most meaningful information in their tweets. Identifying the group of users who provide useful information would make data collection more efficient by filtering more quantity and better quality of tweets to support SA. Both contents from eyewitnesses and sympathizers are relevant to the topic but eyewitnesses show variety in discussion – important for accessing various types of information from within the impact region, while sympathizers are generally talking about the same topics – used for understanding the global impact of the crisis. Zahra, Imran, and Ostermann (Citation2018) classify eyewitnesses into three categories: direct, indirect, and vulnerable direct witnesses. Direct eyewitnesses use words related to perceptual senses such as seeing, hearing, and feeling, while indirect eyewitnesses mainly express emotions such as thoughts, prayers, worry. Lastly, vulnerable direct witnesses mostly share warnings and alerts about an expected disaster situation. Another method in identifying tweets from direct witnesses is to filter out tweets containing Uniform Resource Locators (URLs) and tweets containing the text ‘RT’ or ‘@’, which indicates a retweet, often associating to users who are outside the affected areas (Earle, Bowden, and Guy Citation2011).
On the other hand, studies that did not focus on the type of eyewitness categorized users by their groups instead. Choudhury, Diakopoulos, and Naaman (Citation2012) found that tweets from organizations generally contain the words ‘headline’ and ‘news,’ while tweets from journalists/bloggers would contain second-person pronouns words like ‘you’ to encourage an interactive behaviour. Individual tweets would most likely contain sentiment words such as ‘excited,’ ‘awesome,’ or ‘bad’ and first-person pronouns like ‘my’ and ‘us.’ By identifying the content of the tweets, they were able to classify which user category the information source belonged to. While organizations frequently point to external sources of information through URLs in their posts, ordinary individuals tend to be more representative of their personal experiences and feelings about events. Classifying users by type can expedite DM processes, as the type of social media content (e.g. sentiment, informative, alert) can often be determined by the user group. However, classifying users according to direct or indirect eyewitnesses would be analysing content posted by individual users and not organizations or journalists. Individual users may provide insight on sentiment and human coping mechanisms, but social media content from individual users may also be biased and subjective.
3.4. Temporal classification
There are generally three phases in a course of a disaster: pre-incident, during the incident, and post-incident. During the pre-incident, social media contents usually include topics of warning and alert (Chowdhury et al. Citation2013). During the incident, topics usually include damage and casualty reporting (Terpstra et al. Citation2012). Post-incident contents include topics on recovery and relief (Chowdhury et al. Citation2013). The most prevalent event type for studies using temporal classification is hurricane, accounting for 36% of all studies indicated in this schema. Both floods and hurricanes are considered to develop progressively, as opposed to earthquakes that happen rather instantaneously (Olteanu, Vieweg, and Castillo Citation2015). We observe a corresponding pattern where temporal classification is most often used with progressive events since these events usually have warning periods and other development phases. Since temporal classification for disaster management is often used to explore communication topics and what people are discussing on social media over the course of a disaster, this classification method complements sentiment classification as people’s emotions correspond to the phase of the disaster.
3.5. Spatiotemporal analysis
Social media allows for real-time data and information at a local level to be shared at a global level. The scale and location of the natural disaster play an important role in social media activity where the larger the size and significance of the disaster, the higher the frequency of Twitter activity. An example can be seen when Hurricane Ike, estimated to be 27 USD billion in damages, had a much higher tweet activity than that of Hurricane Gustav with an estimation of 4-14 USD billion in damages (Hughes and Palen Citation2009). As for location, there will most likely be fewer social media activity in less-populated areas than areas that are high in population. If the centre of an earthquake happens to be in an oceanic area, then it would be difficult to determine its location from social media threads because of a lack of people (Sakaki, Okazaki, and Matsuo Citation2013). Crooks et al. (Citation2013) showed that reaction time tends to increase away from the epicentre, serving as an indicator to estimate the epicentre of the event by considering the temporal stamps of relevant data. Furthermore, the dataset in the study showed that information dissemination through Twitter can reach distant communities and locations faster than the physical event itself, suggesting how social media can be used as an early warning system for large-scale incidents. The most prevalent event types used for spatiotemporal classification are earthquakes and floods. Spatiotemporal analysis was used to locate areas affected by the disaster and to assess how heavily it was affected.
4. Research agenda
Though each classification schema has its own limitations, there are multiple challenges in using social media data for DM that are cross-cutting among all thematic areas. First, the data from individual users are inherently subjective. User’s opinion about the disaster condition can vary depending on several factors such as demographics, education level, personal motivation (Jamali et al. Citation2019). Another challenge is locational errors from using geolocated social media data as the majority of informative disaster-related content is often from people who are physically close to the location of the disaster and not necessarily in the exact location of the disaster (Li et al. 2018). This situation may be due to the lack of internet access and that people experiencing the disaster would be prioritizing their safety before engaging in social media interactions. In addition, this limitation also affects using social media data for disasters that take place in remote regions. Unlike floods, earthquakes, and hurricanes that could happen in urban areas with a large population size, wildfires usually occur in forested areas that are far away from the majority of the human population so there may be a lack of informative data shared on social media. As such, there are more studies in this review on flood, hurricane, or earthquake compared to studies on wildfire or blizzard. To address this issue, future research should incorporate spatiotemporal analysis when assessing social media data in addition to the classification method (content, temporal, user, and/or sentiment) they may be using. Due to the near real-time nature of social media data, using spatiotemporal analysis can assist data acquisition in weakly institutionalized areas by monitoring the frequency and pattern of social media activity.
Based on the review, a future research agenda is envisioned for SA classification and extraction methods from five different aspects (e.g., content, temporal, user, sentiment, and spatiotemporal) elaborated as below.
4.1 Content classification
Current content classification models mostly rely on features derived from text only (Arthur et al. Citation2018; Verma et al. Citation2011; David, Ong, and Legara Citation2016; Vieweg et al. Citation2010; Cho, Jung, and Park Citation2013; Qu, Wu, and Wang Citation2009; Qu et al. Citation2010; Chowdhury et al. Citation2013; Kongthon et al. Citation2012; Vieweg Citation2011; Olteanu, Vieweg, and Castillo Citation2015; Imran, Mitra, and Srivastava Citation2016; Acar and Muraki Citation2011; Smith Citation2010; Wang, Ye, and Tsou Citation2016; Bruns et al. Citation2012; Shaw et al. Citation2013; Gurman and Ellenberger Citation2015; Temnikova and Castillo Citation2015; Herfort et al. Citation2013; Landwehr et al. Citation2016; Spence et al. Citation2015; Sutton et al. Citation2014; Takahashi, Tandoc, and Carmichael Citation2015; Valenzuela, Puente, and Flores Citation2017; Wang and Zhuang Citation2017; Win and Aung Citation2017; Yu et al. Citation2019). These models are often limited in accuracy due to the variability, uncertainty and succinct characteristics of social media messages. Therefore, more clues or signals are necessary to improve entirely text-based approaches. Others features, especially spatial and temporal information, can potentially be integrated because messages within the same category likely form spatiotemporal clusters (e.g., posts reporting a flood zone and infrastructure damaged by the flood would have close locations; posts about donation and aid are more likely to occur during and after a disaster event) to which spatial and temporal features can improve text classification .
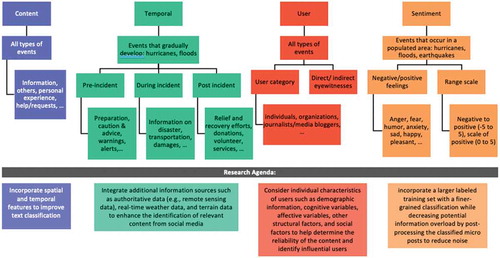
Figure 10. Classification methods and the types of events they are recommended to be used with, along with their subcategories and research agenda. Content and user classification may be used with all types of events. Temporal classification is advised to be used with events that develop over time such as hurricanes and floods. Sentiment classification would be appropriate for events that occur in a populated area, since it depends on user response and emotions. Spatiotemporal classification (not shown in figure) should be used for investigating patterns of events over time and disaster mapping
4.2. Temporal classification
The process of automatically detecting and classifying tweets by periods is important when using temporal classification on social media data to detect the different phases of a disaster (Chowdhury et al. Citation2013). Rather than just being able to detect the timeframe of when an event starts and ends, future studies should incorporate more data sources concerning different aspects of the emergency events into their models to develop filters that enable early detection of this information. Combining these additional information sources such as authoritative data (e.g., remote sensing data), real-time weather data, and terrain data may enhance the identification of relevant content from social media to ensure that the model can be used to help better prepare for different types of emergency situations.
4.3. User classification
User classification and analysis are important for addressing the challenge of finding reliable data from social media streams. Current models of user classification focus on determining which category (e.g., organizations, journalists/media bloggers, ordinary individuals) the information source is in or determining the relationship between the information source and the event (e.g., direct/indirect eyewitness) (Choudhury, Diakopoulos, and Naaman Citation2012; Diakopoulos, De Choudhury, and Naaman Citation2012; Kumar et al. Citation2013). However, there are still many opportunities to enhance these models by considering additional factors including individual characteristics of users such as demographic information (e.g. gender, age), cognitive variables (e.g. scientific knowledge, language), affective variables (e.g. emotions), other structural factors (e.g. access to Internet, type of technological capacity), and social factors (e.g. culture) (Takahashi, Tandoc, and Carmichael Citation2015). Considering these factors would help determine the reliability of the post, and identify influential users.
4.4. Sentiment classification
Although the current machine learning models for sentiment classification provide broad coverage of the ongoing event, the accuracy rate could still be improved due to a high rate of false positives (e.g., ironic tweets) (Buscaldi and Hernandez-Farias Citation2015; Schulz, Paulheim, and Schweizer Citation2013). To address this issue, future studies should incorporate a larger labelled training set with a finer-grained classification while decreasing potential information overload by post-processing the classified micro posts to reduce noise. In addition, integrating spatiotemporal analysis by providing visualization of these sentiment posts on a geographical map would help reveal the trend of users’ responses throughout the event related to their location and distance from disaster.
4.5. Spatiotemporal analysis
While examining the spatiotemporal patterns of extracted information from social media, some common limitations are that only a small percentage of users geotag their posts/tweets (Wang, Wang, and Taylor Citation2017) and that the analysis is done after the event (Crooks et al. Citation2013). Future studies should perform real-time trend detection over the social media stream to be able to access all crawled user-generated content. Moreover, it is important to consider the spatial size and significance of the natural disaster, since the quality of the visualization map corresponds to the number of users in the location of the event.
Lastly, Twitter has been the platform most frequently used for all classification schemas . Therefore, a future study should investigate the characteristics and effectiveness of different social media platforms in relation to their feasibility and reliability as an information diffuser in the event of a natural disaster, and fuse data (e.g., texts, images, and videos) from different platforms for better SA information extraction and establishment.
5. Conclusion
Identifying relevant information efficiently and accurately to support SA is a main priority during a natural disaster. Effective threat assessment and logical reactions are critical in the disaster mitigation processes (Perry and Lindell Citation2003). In this paper, we reviewed studies that use different methods to extract information from social media during natural hazards. These studies include work from across multiple social media platforms, with the most used platform being Twitter. We categorized these studies’ methods into five categories (content, sentiment, user, temporal, spatiotemporal), with some studies showing up in more than one category. As shown in , content classification can be used for all types of events, as it is efficient and appropriate for filtering relevant tweets that contribute to SA. However, the classification category/topic would vary according to the event itself. Sentiment classification is most often used when the purpose of the study is to analyse the trend of people’s emotions and responses to the event, which changes throughout the different phases of the natural disaster. User classification is recommended to check for information credibility and track the main influencers on discussions in social media. Temporal classification is most appropriate for events that develop progressively like hurricanes since there are clear distinctions on the different phases of the event. Lastly, spatiotemporal classification would be most appropriate for disaster mapping.
This paper presents an overview of methods used to analyse social media content across multiple events and social media platforms. Furthermore, this paper also summarizes (1) the content topics or information categories are commonly extracted and examined from the social media datasets for four classification schemas listed previously, (2) what types of events mostly leverage social media for each of the five schemas, (3) what was the most prevalent classification purpose for each event, (4) what social media platforms are most popular, and (5) what classification schemas are most popular for each event.
In particular, the analysis results indicate that the major topics used to classify social media data include information, others, personal expression and experience, help and requests, and sentiment/emotion. For content classification, the majority of the reviewed literature analysed various event types with the purpose of identifying tweets contributing to SA and disaster management. Likewise, various event types were most commonly used for user classification. For both temporal and sentiment classification, the event type studied most frequently is hurricane. However, the most prevalent study purpose observed in the literature that used temporal classification was exploring communication topics throughout the course of the disaster, while the purpose for sentiment classification was more focused on analysing people’s emotions and feelings. Lastly, studies that employed spatiotemporal analysis mostly studied flood and earthquake. Across the majority of the event types studied, Twitter has been the most prevalent platform for SA extraction, while the most frequently used classification method is content classification.
Finally, a future research agenda for SA classification and extraction methods are envisioned from five different aspects (e.g., content, temporal, user, sentiment, and spatiotemporal) in Section 3.2. We hope this paper would contribute to future studies of analysing social media content by providing a framework on which categorization to use based on the purpose of the study, the social media platform, and the type of event. The main limitation of this review is the uneven distribution of studies for each type of event as well as the classification methods, causing some exaggerations in the percentage analysis and lack of information to perform analysis on as seen with tsunami and storm. Despite the limitations of this paper, we were able to see the general classification methods and categories used on each type of natural disaster.
Disclosure statement
No potential conflict of interest was reported by the authors.
Additional information
Funding
References
- Acar, Adam, and Yuya Muraki. 2011. “Twitter for Crisis Communication: Lessons Learned from Japan’s Tsunami Disaster.” International Journal of Web Based Communities 7 (3): 392. https://doi.org/10.1504/IJWBC.2011.041206.
- Alexander, David E. 2014. “Social Media in Disaster Risk Reduction and Crisis Management.” Science and Engineering Ethics 20 (3): 717–33. https://doi.org/10.1007/s11948-013-9502-z.
- Al-Saggaf, Yeslam, and Peter Simmons. 2015. “Social Media in Saudi Arabia: Exploring Its Use during Two Natural Disasters.” Technological Forecasting and Social Change 95 (June): 3–15. https://doi.org/10.1016/j.techfore.2014.08.013.
- Arthur, Rudy, Chris A. Boulton, Humphrey Shotton, and Hywel T. P. Williams. 2018. “Social Sensing of Floods in the UK.” Edited by Guy J-P. Schumann. PLOS ONE 13 (1): e0189327. https://doi.org/10.1371/journal.pone.0189327.
- BBC News. 2018. “Why the Kerala Floods Proved so Deadly,” August 21, 2018, sec. India. https://www.bbc.com/news/world-asia-india-45243868.
- Beigi, Ghazaleh, Xia Hu, Ross Maciejewski, and Huan Liu. 2016. “An Overview of Sentiment Analysis in Social Media and Its Applications in Disaster Relief.” In Sentiment Analysis and Ontology Engineering: An Environment of Computational Intelligence, edited by Witold Pedrycz and Shyi-Ming Chen, 313–40. Studies in Computational Intelligence. Cham: Springer International Publishing. https://doi.org/10.1007/978-3-319-30319-2_13.
- Bruns, Axel, Jean Burgess, Kate Crawford, and Frances Shaw. 2012. “#qldfloods and @QPSMedia: Crisis Communication on Twitter in the 2011 South East Queensland Floods,” 58.
- Brynielsson, Joel, Magdalena Granåsen, Sinna Lindquist, Maribel Narganes Quijano, Susanna Nilsson, and Jiri Trnka. 2018. “Informing Crisis Alerts Using Social Media: Best Practices and Proof of Concept.” Journal of Contingencies and Crisis Management 26 (1): 28–40. https://doi.org/10.1111/1468-5973.12195.
- Buscaldi, Davide, and Irazú Hernandez-Farias. 2015. “Sentiment Analysis on Microblogs for Natural Disasters Management: A Study on the 2014 Genoa Floodings.” In Proceedings of the 24th International Conference on World Wide Web - WWW ’15 Companion, 1185–88. Florence, Italy: ACM Press. https://doi.org/10.1145/2740908.2741727.
- Caragea, Cornelia, Anna Squicciarini, Sam Stehle, Kishore Neppalli, and Andrea Tapia. 2014. “Mapping Moods: Geo-Mapped Sentiment Analysis During Hurricane Sandy,” 10.
- Cervone, Guido, Elena Sava, Qunying Huang, Emily Schnebele, Jeff Harrison, and Nigel Waters. 2016. “Using Twitter for Tasking Remote-Sensing Data Collection and Damage Assessment: 2013 Boulder Flood Case Study.” International Journal of Remote Sensing 37 (1): 100–124. https://doi.org/10.1080/01431161.2015.1117684.
- Cho, Seong Eun, Kyujin Jung, and Han Woo Park. 2013. “Social Media Use during Japan’s 2011 Earthquake: How Twitter Transforms the Locus of Crisis Communication.” Media International Australia 149 (1): 28–40. https://doi.org/10.1177/1329878X1314900105.
- Choudhury, Munmun De, Nicholas Diakopoulos, and Mor Naaman. 2012. “Unfolding the Event Landscape on Twitter: Classification and Exploration of User Categories,” 4.
- Chowdhury, Soudip Roy, Muhammad Imran, Muhammad Rizwan Asghar, Sihem Amer-Yahia, and Carlos Castillo. 2013. “Tweet4act: Using Incident-Specific Profiles for Classifying Crisis-Related Messages,” 5.
- Crooks, Andrew, Arie Croitoru, Anthony Stefanidis, and Jacek Radzikowski. 2013. “#Earthquake: Twitter as a Distributed Sensor System: #Earthquake: Twitter as a Distributed Sensor System.” Transactions in GIS 17 (1): 124–47. https://doi.org/10.1111/j.1467-9671.2012.01359.x.
- Dabner, Nicki. 2012. “‘Breaking Ground’ in the Use of Social Media: A Case Study of a University Earthquake Response to Inform Educational Design with Facebook.” The Internet and Higher Education 15 (1): 69–78. https://doi.org/10.1016/j.iheduc.2011.06.001.
- David, Clarissa C., Jonathan Corpus Ong, and Erika Fille T. Legara. 2016. “Tweeting Supertyphoon Haiyan: Evolving Functions of Twitter during and after a Disaster Event.” Edited by Frederic Amblard. PLOS ONE 11 (3): e0150190. https://doi.org/10.1371/journal.pone.0150190.
- De Longueville, Bertrand, Robin S. Smith, and Gianluca Luraschi. 2009. “‘OMG, from Here, I Can See the Flames!’: A Use Case of Mining Location Based Social Networks to Acquire Spatio-Temporal Data on Forest Fires.” In Proceedings of the 2009 International Workshop on Location Based Social Networks - LBSN ’09, 73. Seattle, Washington: ACM Press. https://doi.org/10.1145/1629890.1629907.
- Diakopoulos, Nicholas, Munmun De Choudhury, and Mor Naaman. 2012. “Finding and Assessing Social Media Information Sources in the Context of Journalism.” In Proceedings of the 2012 ACM Annual Conference on Human Factors in Computing Systems - CHI ’12, 2451. Austin, Texas, USA: ACM Press. https://doi.org/10.1145/2207676.2208409.
- Earle, P., M. Guy, R. Buckmaster, C. Ostrum, S. Horvath, and A. Vaughan. 2010. “OMG Earthquake! Can Twitter Improve Earthquake Response?” Seismological Research Letters 81 (2): 246–51. https://doi.org/10.1785/gssrl.81.2.246.
- Earle, Paul S., Daniel C. Bowden, and Michelle Guy. 2011. “Twitter Earthquake Detection: Earthquake Monitoring in a Social World.” Annals of Geophysics, 708–715.
- Ellis, Ralph, Faith Karimi, Azadeh Ansari, and Natalie Gallon. 2016. “Ecuador Earthquake: Death Toll Jumps to 272.” CNN. April 18, 2016. https://www.cnn.com/2016/04/17/americas/ecuador-deadly-earthquake/index.html.
- Fang, Jian, Jiameng Hu, Xianwu Shi, and Lin Zhao. 2019. “Assessing Disaster Impacts and Response Using Social Media Data in China: A Case Study of 2016 Wuhan Rainstorm.” International Journal of Disaster Risk Reduction 34 (March): 275–82. https://doi.org/10.1016/j.ijdrr.2018.11.027.
- Fohringer, J., D. Dransch, H. Kreibich, and K. Schröter. 2015. “Social Media as an Information Source for Rapid Flood Inundation Mapping.” Natural Hazards and Earth System Sciences 15 (12): 2725–38. https://doi.org/10.5194/nhess-15-2725-2015.
- Gao, Huiji, Geoffrey Barbier, and Rebecca Goolsby. 2011. “Harnessing the Crowdsourcing Power of Social Media for Disaster Relief.” IEEE INTELLIGENT SYSTEMS, 5.
- Gibbens, Sarah. 2019. “Hurricane Katrina, Explained.” Environment. January 16, 2019. https://www.nationalgeographic.com/environment/natural-disasters/reference/hurricane-katrina/.
- Guan, Xiangyang, and Cynthia Chen. 2014. “Using Social Media Data to Understand and Assess Disasters.” Natural Hazards 74 (2): 837–50. https://doi.org/10.1007/s11069-014-1217-1.
- Gurman, Tilly A., and Nicole Ellenberger. 2015. “Reaching the Global Community During Disasters: Findings From a Content Analysis of the Organizational Use of Twitter After the 2010 Haiti Earthquake.” Journal of Health Communication 20 (6): 687–96. https://doi.org/10.1080/10810730.2015.1018566.
- Hall, Symons, and College Park. 2012. “National Consortium for the Study of Terrorism and Responses to Terrorism,” 39.
- Herfort, Benjamin, João Porto de Albuquerque, Svend-Jonas Schelhorn, and Alexander Zipf. 2013. “Does the Spatiotemporal Distribution of Tweets Match the Spatiotemporal Distribution of Flood Phenomena? A Study about the River Elbe Flood in June 2013,” 6.
- Houston, J. Brian, Joshua Hawthorne, Mildred F. Perreault, Eun Hae Park, Marlo Goldstein Hode, Michael R. Halliwell, Sarah E. Turner McGowen, et al. 2015. “Social Media and Disasters: A Functional Framework for Social Media Use in Disaster Planning, Response, and Research.” Disasters 39 (1): 1–22. https://doi.org/10.1111/disa.12092.
- Huang, Qunying, and Yu Xiao. 2015. “Geographic Situational Awareness: Mining Tweets for Disaster Preparedness, Emergency Response, Impact, and Recovery.” ISPRS International Journal of Geo-Information 4 (3): 1549–68. https://doi.org/10.3390/ijgi4031549.
- Hughes, Amanda L., Lise A. A. St. Denis, Leysia Palen, and Kenneth M. Anderson. 2014. “Online Public Communications by Police & Fire Services during the 2012 Hurricane Sandy.” In Proceedings of the 32nd Annual ACM Conference on Human Factors in Computing Systems - CHI ’14, 1505–14. Toronto, Ontario, Canada: ACM Press. https://doi.org/10.1145/2556288.2557227.
- Hughes, Amanda Lee, and Leysia Palen. 2009. “Twitter Adoption and Use in Mass Convergence and Emergency Events.” International Journal of Emergency Management 6 (3/4): 248. https://doi.org/10.1504/IJEM.2009.031564.
- Imran, Muhammad, Carlos Castillo, Fernando Diaz, and Sarah Vieweg. 2015. “Processing Social Media Messages in Mass Emergency: A Survey.” ACM Computing Surveys 47 (4): 1–38. https://doi.org/10.1145/2771588.
- Imran, Muhammad, Shady Elbassuoni, Carlos Castillo, Fernando Diaz, and Patrick Meier. 2013a. “Extracting Information Nuggets from Disaster- Related Messages in Social Media,” 10.
- Imran, Muhammad, Shady Elbassuoni, Carlos Castillo, Fernando Diaz, and Patrick Meier. 2013b. “Practical Extraction of Disaster-Relevant Information from Social Media.” In Proceedings of the 22nd International Conference on World Wide Web - WWW ’13 Companion, 1021–24. Rio de Janeiro, Brazil: ACM Press. https://doi.org/10.1145/2487788.2488109.
- Imran, Muhammad, Prasenjit Mitra, and Jaideep Srivastava. 2016. “Enabling Rapid Classification of Social Media Communications During Crises:” International Journal of Information Systems for Crisis Response and Management 8 (3): 1–17. https://doi.org/10.4018/IJISCRAM.2016070101.
- Iyengar, Akshaya, Tim Finin, and Anupam Joshi. 2011. “Content-Based Prediction of Temporal Boundaries for Events in Twitter.” In 2011 IEEE Third Int’l Conference on Privacy, Security, Risk and Trust and 2011 IEEE Third Int’l Conference on Social Computing, 186–91. Boston, MA, USA: IEEE. https://doi.org/10.1109/PASSAT/SocialCom.2011.196.
- Jamali, Mehdi, Ali Nejat, Souparno Ghosh, Fang Jin, and Guofeng Cao. 2019. “Social Media Data and Post-Disaster Recovery.” International Journal of Information Management 44 (February): 25–37. https://doi.org/10.1016/j.ijinfomgt.2018.09.005.
- Jongman, Brenden, Jurjen Wagemaker, Beatriz Revilla Romero, and Erin Coughlan De Perez. 2015. “Early Flood Detection for Rapid Humanitarian Response: Harnessing Near Real-Time Satellite and Twitter Signals.” ISPRS International Journal of Geo-Information 4 (4): 2246–66. https://doi.org/10.3390/ijgi4042246.
- Kaufhold, Marc-André, and Christian Reuter. 2016. “The Self-Organization of Digital Volunteers across Social Media: The Case of the 2013 European Floods in Germany.” Journal of Homeland Security and Emergency Management 13 (1). https://doi.org/10.1515/jhsem-2015-0063.
- Kent, Joshua D., and Henry T. Capello. 2013. “Spatial Patterns and Demographic Indicators of Effective Social Media Content during TheHorsethief Canyon Fire of 2012.” Cartography and Geographic Information Science 40 (2): 78–89. https://doi.org/10.1080/15230406.2013.776727.
- Kim, Jooho, Juhee Bae, and Makarand Hastak. 2018. “Emergency Information Diffusion on Online Social Media during Storm Cindy in U.S.” International Journal of Information Management 40 (June): 153–65. https://doi.org/10.1016/j.ijinfomgt.2018.02.003.
- Kim, Jooho, and Makarand Hastak. 2018. “Social Network Analysis: Characteristics of Online Social Networks after a Disaster.” International Journal of Information Management 38 (1): 86–96. https://doi.org/10.1016/j.ijinfomgt.2017.08.003.
- Kongthon, A., C. Haruechaiyasak, J. Pailai, and S. Kongyoung. 2012. “The Role of Twitter during a Natural Disaster: Case Study of 2011 Thai Flood.” In 2012 Proceedings of PICMET ’12: Technology Management for Emerging Technologies, 2227–32.
- Kumar, Shamanth, Fred Morstatter, Reza Zafarani, and Huan Liu. 2013. “Whom Should I Follow?: Identifying Relevant Users during Crises.” In Proceedings of the 24th ACM Conference on Hypertext and Social Media - HT ’13, 139–47. Paris, France: ACM Press. https://doi.org/10.1145/2481492.2481507.
- Landwehr, Peter M., Wei Wei, Michael Kowalchuck, and Kathleen M. Carley. 2016. “Using Tweets to Support Disaster Planning, Warning and Response.” Safety Science 90 (December): 33–47. https://doi.org/10.1016/j.ssci.2016.04.012.
- Laylavi, Farhad, Abbas Rajabifard, and Mohsen Kalantari. 2017. “Event Relatedness Assessment of Twitter Messages for Emergency Response.” Information Processing & Management 53 (1): 266–80. https://doi.org/10.1016/j.ipm.2016.09.002.
- Leavitt, Alex, and Joshua A. Clark. 2014. “Upvoting Hurricane Sandy: Event-Based News Production Processes on a Social News Site.” In Proceedings of the 32nd Annual ACM Conference on Human Factors in Computing Systems - CHI ’14, 1495–1504. Toronto, Ontario, Canada: ACM Press. https://doi.org/10.1145/2556288.2557140.
- Li, Zhenlong, Cuizhen Wang, Christopher T. Emrich, and Diansheng Guo. 2018. “A Novel Approach to Leveraging Social Media for Rapid Flood Mapping: A Case Study of the 2015 South Carolina Floods.” Cartography and Geographic Information Science 45 (2): 97–110. https://doi.org/10.1080/15230406.2016.1271356.
- Lindsay, Bruce R. 2011. “Social Media and Disasters: Current Uses, Future Options, and Policy Considerations,” 13.
- Liu, Sophia B, Leysia Palen, Jeannette Sutton, Amanda L Hughes, and Sarah Vieweg. 2008. “In Search of the Bigger Picture: The Emergent Role of On-Line Photo Sharing in Times of Disaster,” 11.
- Lu, Xin, and Christa Brelsford. 2015. “Network Structure and Community Evolution on Twitter: Human Behavior Change in Response to the 2011 Japanese Earthquake and Tsunami.” Scientific Reports 4 (1). https://doi.org/10.1038/srep06773.
- Luna, Sergio, and Michael J. Pennock. 2018. “Social Media Applications and Emergency Management: A Literature Review and Research Agenda.” International Journal of Disaster Risk Reduction 28 (June): 565–77. https://doi.org/10.1016/j.ijdrr.2018.01.006.
- MacEachren, A. M., A. Jaiswal, A. C. Robinson, S. Pezanowski, A. Savelyev, P. Mitra, X. Zhang, and J. Blanford. 2011. “SensePlace2: GeoTwitter Analytics Support for Situational Awareness.” In 2011 IEEE Conference on Visual Analytics Science and Technology (VAST), 181–90. https://doi.org/10.1109/VAST.2011.6102456.
- Macias, Wendy, Karen Hilyard, and Vicki Freimuth. 2009. “Blog Functions as Risk and Crisis Communication During Hurricane Katrina.” Journal of Computer-Mediated Communication 15 (1): 1–31. https://doi.org/10.1111/j.1083-6101.2009.01490.x.
- Mandel, Benjamin, Aron Culotta, John Boulahanis, Danielle Stark, Bonnie Lewis, and Jeremy Rodrigue. 2012. “A Demographic Analysis of Online Sentiment during Hurricane Irene,” 10.
- Middleton, S. E., L. Middleton, and S. Modafferi. 2014. “Real-Time Crisis Mapping of Natural Disasters Using Social Media.” IEEE Intelligent Systems 29 (2): 9–17. https://doi.org/10.1109/MIS.2013.126.
- Nair, Meera R., G.R. Ramya, and P. Bagavathi Sivakumar. 2017. “Usage and Analysis of Twitter during 2015 Chennai Flood towards Disaster Management.” Procedia Computer Science 115: 350–58. https://doi.org/10.1016/j.procs.2017.09.089.
- Oh, Onook, Kyounghee Kwon, and H. Raghav Rao. 2010. “An Exploration of Social Media in Extreme Events: Rumor Theory and Twitter during the HAITI Earthquake 2010.” In ICIS 2010 Proceedings - Thirty First International Conference on Information Systems. https://asu.pure.elsevier.com/en/publications/an-exploration-of-social-media-in-extreme-events-rumor-theory-and.
- Olteanu, Alexandra, Sarah Vieweg, and Carlos Castillo. 2015. “What to Expect When the Unexpected Happens: Social Media Communications Across Crises.” In Proceedings of the 18th ACM Conference on Computer Supported Cooperative Work & Social Computing - CSCW ’15, 994–1009. Vancouver, BC, Canada: ACM Press. https://doi.org/10.1145/2675133.2675242.
- Perez-Lugo, Marla. 2004. “Media Uses in Disaster Situations: A New Focus on the Impact Phase.” Sociological Inquiry 74 (2): 210–25. https://doi.org/10.1111/j.1475-682X.2004.00087.x.
- Perry, Ronald W., and Michael K. Lindell. 2003. “Preparedness for Emergency Response: Guidelines for the Emergency Planning Process.” Disasters 27 (4): 336–50. https://doi.org/10.1111/j.0361-3666.2003.00237.x.
- Qu, Yan, Chen Huang, Pengyi Zhang, and Jun Zhang. 2010. “Microblogging after a Major Disaster in China: A Case Study of the 2010 Yushu Earthquake,” 10.
- Qu, Yan, P. F. Wu, and Xiaoqing Wang. 2009. “Online Community Response to Major Disaster: A Study of Tianya Forum in the 2008 Sichuan Earthquake.” In 2009 42nd Hawaii International Conference on System Sciences, 1–11. https://doi.org/10.1109/HICSS.2009.330.
- Restrepo-Estrada, Camilo, Sidgley Camargo de Andrade, Narumi Abe, Maria Clara Fava, Eduardo Mario Mendiondo, and João Porto de Albuquerque. 2018. “Geo-Social Media as a Proxy for Hydrometeorological Data for Streamflow Estimation and to Improve Flood Monitoring.” Computers & Geosciences 111 (February): 148–58. https://doi.org/10.1016/j.cageo.2017.10.010.
- Rosser, J. F., D. G. Leibovici, and M. J. Jackson. 2017. “Rapid Flood Inundation Mapping Using Social Media, Remote Sensing and Topographic Data.” Natural Hazards 87 (1): 103–20. https://doi.org/10.1007/s11069-017-2755-0.
- Sakaki, T., M. Okazaki, and Y. Matsuo. 2013. “Tweet Analysis for Real-Time Event Detection and Earthquake Reporting System Development.” IEEE Transactions on Knowledge and Data Engineering 25 (4): 919–31. https://doi.org/10.1109/TKDE.2012.29.
- Schulz, Axel, Heiko Paulheim, and Immanuel Schweizer. 2013. “A Fine-Grained Sentiment Analysis Approach for Detecting Crisis Related Microposts,” 6.
- Science, jurisdiction=Queensland; sector=government; corporateName=Department of Environment and. 2018. “What Are the Consequences of Floods?” Office of the Queensland Chief Scientist. June 12, 2018. https://www.chiefscientist.qld.gov.au/publications/understanding-floods/flood-consequences.
- Shaw, Frances, Jean Burgess, Kate Crawford, and Axel Bruns. 2013. “Sharing News, Making Sense, Saying Thanks.” Making Sense, 18.
- Shklovski, Irina, Moira Burke, Sara Kiesler, and Robert Kraut. 2010. “Technology Adoption and Use in the Aftermath of Hurricane Katrina in New Orleans.” American Behavioral Scientist 53 (8): 1228–46. https://doi.org/10.1177/0002764209356252.
- Shklovski, Irina, Leysia Palen, and Jeannette Sutton. 2008. “Finding Community Through Information and Communication Technology During Disaster Events,” 10.
- Simon, Tomer, Avishay Goldberg, and Bruria Adini. 2015. “Socializing in Emergencies—A Review of the Use of Social Media in Emergency Situations.” International Journal of Information Management 35 (5): 609–19. https://doi.org/10.1016/j.ijinfomgt.2015.07.001.
- Smith, Brian G. 2010. “Socially Distributing Public Relations: Twitter, Haiti, and Interactivity in Social Media.” Public Relations Review 36 (4): 329–35. https://doi.org/10.1016/j.pubrev.2010.08.005.
- Spence, Patric R., Kenneth A. Lachlan, Xialing Lin, and Maria del Greco. 2015. “Variability in Twitter Content Across the Stages of a Natural Disaster: Implications for Crisis Communication.” Communication Quarterly 63 (2): 171–86. https://doi.org/10.1080/01463373.2015.1012219.
- Sutton, Jeannette, Leysia Palen, and Irina Shklovski. 2008. “Backchannels on the Front Lines: Emergent Uses of Social Media in the 2007 Southern California Wildfires,” 9.
- Sutton, Jeannette, Emma S. Spiro, Britta Johnson, Sean Fitzhugh, Ben Gibson, and Carter T. Butts. 2014. “Warning Tweets: Serial Transmission of Messages during the Warning Phase of a Disaster Event.” Information, Communication & Society 17 (6): 765–87. https://doi.org/10.1080/1369118X.2013.862561.
- Takahashi, Bruno, Edson C. Tandoc, and Christine Carmichael. 2015. “Communicating on Twitter during a Disaster: An Analysis of Tweets during Typhoon Haiyan in the Philippines.” Computers in Human Behavior 50 (September): 392–98. https://doi.org/10.1016/j.chb.2015.04.020.
- Takayasu, Misako, Kazuya Sato, Yukie Sano, Kenta Yamada, Wataru Miura, and Hideki Takayasu. 2015. “Rumor Diffusion and Convergence during the 3.11 Earthquake: A Twitter Case Study.” Edited by Roeland M.H. Merks. PLOS ONE 10 (4): e0121443. https://doi.org/10.1371/journal.pone.0121443.
- Temnikova, Irina, and Carlos Castillo. 2015. “EMTerms 1.0: A Terminological Resource for Crisis Tweets,” 13.
- Terpstra, Teun, R Stronkman, de Vries, A, and Paradies, G.L. 2012. “Towards a Realtime Twitter Analysis during Crises for Operational Crisis Management,” 9.
- Tim, Yenni, Shan L. Pan, Peter Ractham, and Laddawan Kaewkitipong. 2017. “Digitally Enabled Disaster Response: The Emergence of Social Media as Boundary Objects in a Flooding Disaster: Social Media for Disaster Response.” Information Systems Journal 27 (2): 197–232. https://doi.org/10.1111/isj.12114.
- Valenzuela, Sebastián, Soledad Puente, and Pablo M. Flores. 2017. “Comparing Disaster News on Twitter and Television: An Intermedia Agenda Setting Perspective.” Journal of Broadcasting & Electronic Media 61 (4): 615–37. https://doi.org/10.1080/08838151.2017.1344673.
- Verma, Sudha, Sarah Vieweg, William J. Corvey, Leysia Palen, James H. Martin, Martha Palmer, Aaron Schram, and Kenneth Mark Anderson. 2011. “Natural Language Processing to the Rescue? Extracting ‘Situational Awareness’ Tweets During Mass Emergency.” In ICWSM.
- Vieweg, Sarah. 2011. 1 Linguistic Analysis and Ontological Representation of Twitter Communications During Crisis: Contributions to Situational Awareness.
- Vieweg, Sarah, Amanda L Hughes, Kate Starbird, and Leysia Palen. 2010. “Microblogging during Two Natural Hazards Events: What Twitter May Contribute to Situational Awareness,” 10.
- Villegas, Paulina, Elisabeth Malkin, and Kirk Semple. 2017. “Mexico Earthquake, Strongest in a Century, Kills Dozens.” The New York Times, September 8, 2017, sec. World. https://www.nytimes.com/2017/09/08/world/americas/mexico-earthquake.html.
- Vo, Bao-Khanh H, and Nigel Collier. 2013. “Twitter Emotion Analysis in Earthquake Situations,” 15.
- Wang, Bairong, and Jun Zhuang. 2017. “Crisis Information Distribution on Twitter: A Content Analysis of Tweets during Hurricane Sandy.” Natural Hazards 89 (1): 161–81. https://doi.org/10.1007/s11069-017-2960-x.
- Wang, Yan, and John E. Taylor. 2018. “Coupling Sentiment and Human Mobility in Natural Disasters: A Twitter-Based Study of the 2014 South Napa Earthquake.” Natural Hazards 92 (2): 907–25. https://doi.org/10.1007/s11069-018-3231-1.
- Wang, Yan, Qi Wang, and John E. Taylor. 2017. “Aggregated Responses of Human Mobility to Severe Winter Storms: An Empirical Study.” Edited by Wei-Xing Zhou. PLOS ONE 12 (12): e0188734. https://doi.org/10.1371/journal.pone.0188734.
- Wang, Yandong, Teng Wang, Xinyue Ye, Jianqi Zhu, and Jay Lee. 2015. “Using Social Media for Emergency Response and Urban Sustainability: A Case Study of the 2012 Beijing Rainstorm.” Sustainability 8 (1): 25. https://doi.org/10.3390/su8010025.
- Wang, Zheye, and Xinyue Ye. 2019. “Space, Time, and Situational Awareness in Natural Hazards: A Case Study of Hurricane Sandy with Social Media Data.” Cartography and Geographic Information Science 46 (4): 334–46. https://doi.org/10.1080/15230406.2018.1483740.
- Wang, Zheye, Xinyue Ye, and Ming-Hsiang Tsou. 2016. “Spatial, Temporal, and Content Analysis of Twitter for Wildfire Hazards.” Natural Hazards 83 (1): 523–40. https://doi.org/10.1007/s11069-016-2329-6.
- Wiegmann, Matti, Jens Kersten, Hansi Senaratne, Martin Potthast, Friederike Klan, and Benno Stein. 2020. “Opportunities and Risks of Disaster Data from Social Media: A Systematic Review of Incident Information.” Preprint. Databases, GIS, Remote Sensing, Early Warning Systems and Monitoring Technologies. https://doi.org/10.5194/nhess-2020-221.
- Win, S. S. M., and T. N. Aung. 2017. “Target Oriented Tweets Monitoring System during Natural Disasters.” In 2017 IEEE/ACIS 16th International Conference on Computer and Information Science (ICIS), 143–48. https://doi.org/10.1109/ICIS.2017.7959984.
- Xu, Zheng, Hui Zhang, Vijayan Sugumaran, Kim-Kwang Raymond Choo, Lin Mei, and Yiwei Zhu. 2016. “Participatory Sensing-Based Semantic and Spatial Analysis of Urban Emergency Events Using Mobile Social Media.” EURASIP Journal on Wireless Communications and Networking 2016 (1). https://doi.org/10.1186/s13638-016-0553-0.
- Yeo, Jungwon, Claire Connolly Knox, and Kyujin Jung. 2018. “Unveiling Cultures in Emergency Response Communication Networks on Social Media: Following the 2016 Louisiana Floods.” Quality & Quantity 52 (2): 519–35. https://doi.org/10.1007/s11135-017-0595-3.
- Yu, Manzhu, Qunying Huang, Han Qin, Chris Scheele, and Chaowei Yang. 2019. “Deep Learning for Real-Time Social Media Text Classification for Situation Awareness – Using Hurricanes Sandy, Harvey, and Irma as Case Studies.” International Journal of Digital Earth, February, 1–18. https://doi.org/10.1080/17538947.2019.1574316.
- Zahra, Kiran, Muhammad Imran, and Frank O Ostermann. 2018. “Understanding Eyewitness Reports on Twitter During Disasters,” 9.
- Zou, Lei, Nina S. N. Lam, Shayan Shams, Heng Cai, Michelle A. Meyer, Seungwon Yang, Kisung Lee, Seung-Jong Park, and Margaret A. Reams. 2019. “Social and Geographical Disparities in Twitter Use during Hurricane Harvey.” International Journal of Digital Earth 12 (11): 1300–1318. https://doi.org/10.1080/17538947.2018.1545878.
Appendix
Table 3. Content classification topic categories