
 ?Mathematical formulae have been encoded as MathML and are displayed in this HTML version using MathJax in order to improve their display. Uncheck the box to turn MathJax off. This feature requires Javascript. Click on a formula to zoom.
ABSTRACT
The adoption of bus rapid transit (BRT) systems has gained worldwide popularity over the past several decades. China is no exception as it has long been aiming at promoting public transportation. Prior studies have provided extensive evidence that BRT has substantial effects on house prices with traditional econometric techniques, such as hedonic pricing models. However, few of those investigations have discussed the non-linear relationship between BRT and house prices. Using the Xiamen data, this study employs a machine learning technique, namely the gradient boosting decision tree (GBDT), to scrutinize the non-linear relationship between BRT and house prices. This study documents a positive association between accessibility to BRT stations and house prices and a negative association between proximity to the BRT corridor and house prices. Moreover, it suggests a non-linear relationship between BRT and house prices and indicates that GBDT has more substantial predictive power than hedonic pricing models.
1. Introduction
At present, numerous cities/regions worldwide encounter several vexing problems, such as traffic congestion, air pollution, road accidents, urban sprawl, and environmental degradation (Bao et al. Citation2019; Bao and Lu Citation2020; Xia, Yeh, and Zhang Citation2020; Li et al. Citation2020, Citation2021). Private automobiles are considered to be the culprit of many of the problems (Dong et al. Citation2020; Meng et al. Citation2020). Therefore, encouraging the use of public transportation has frequently been regarded as a paramount transportation objective. Public transportation is viewed as a way of overcoming automobile dependence, redressing automobile-induced urban/regional problems, and promoting high-density and mixed land-use development patterns (Cervero and Kockelman Citation1997). Public transportation has gained increasing attention and popularity worldwide as an essential mode in the sustainable, green, and low-carbon-oriented transportation system.
As a developing economy with ultra-dense populations, China has experienced unprecedentedly rapid economic growth and acceleration of urbanization and recently spent considerable effort to promote public transportation, which includes bus rapid transit (BRT, also called a busway or transitway) as an emerging branch. With its prominent feature of a dedicated right-of-way, BRT is proliferating because it combines the advantages of the metro (i.e. carrying capacity, speed, and reliability) with those of the conventional bus transit (i.e. flexibility, simplicity, and low costs) (Yang et al. Citation2020a). In 1999, the first (pro-)BRT system in China was introduced into Kunming. As of December 2020, the BRT system has expanded to 20 Chinese cities, with a length of 672 km and adaily passenger volume of more than four million (BRTDATA.ORG Citation2020).
Consistent with typical public transportation modes (e.g. metro), BRT provides station-to-station services to citizens. If citizens choose to live adjacent to BRT stations, they can access opportunities available at crucial destinations (e.g. office, school, and shopping center) via the convenient BRT service. Therefore, improving BRT accessibility is a precondition for and an essential and marvelous element in developing an attractive BRT system and promoting BRT use. Moreover, house purchasers are likely willing to pay a price premium for a house with high BRT accessibility (near a BRT station), which is an observable utility-generating (or utility-bearing) house attribute. The positive effect of BRT accessibility on house prices has been extensively reported (e.g. Bocarejo, Portilla, and Pérez Citation2013; Páez, Scott, and Morency Citation2012). However, BRT does not always generate positive externalities because residents living adjacent to BRT infrastructures may suffer from undesirable issues (e.g. noise, air pollution, and road vibration) (Kilpatrick et al. Citation2007). Indeed, an emerging line of literature finds an adverse house price effect of proximity to the BRT corridor (abbreviated to ‘BRT proximity’ later) by using various econometric models (Yang, Chau, and Chu Citation2019; Yang et al. Citation2020a).
Prior studies have broadly evaluated the relationship between BRT and house prices. However, most, if not all, studies assume a pre-determined or pre-specified association (e.g. linear association) between the house price and its contributory factors. Indeed, the relationship between house attributes and the house price may not be linear. Understanding the potentially non-linear relationship is needed to avoid potentially erroneous implications for real estate development and urban planning (Olszewski, Waszczuk, and Widłak Citation2017). Fortunately, some recent studies have begun to pay attention to the non-linear association between the house price and its attributes. For instance, Xiao et al. (Citation2019) examined the non-linear impact of floor level on house prices. To recap, although much of the existing literature has shed light on the BRT effect on house prices, more in-depth analysis and evaluation of the potentially non-linear effect still remains a problem.
To address the aforementioned concern and fill the void in knowledge, we choose Xiamen Island (China) as the study area and employ a machine learning technique (i.e. gradient boosting decision tree, GBDT) to examine the non-linear effect of BRT on house prices. GBDT originated from computer science (Friedman Citation2001) and gradually became popular in other fields for its capacity of capturing the non-linear association between factors and its strong predictive power (e.g. Zhang and Haghani Citation2015). GBDT has some applications in the field of urban studies. For example, Yang, Cao, and Zhou (Citation2021) used GBDT to investigate the non-linear relationship between subway accessibility and urban vitality in Shenzhen, China. Moreover, we compare the modeling outcomes of GBDT and traditional hedonic pricing models and confirm that GBDT has a more substantial predictive power than its hedonic pricing counterpart.
This paper contributes to the existing literature from the following two aspects. Firstly, prior studies have extensively explored the linear relationship between BRT and house prices. By contrast, this study examines the non-linear association using a machine learning technique. Secondly, this research provides insights into the employment of machine learning techniques in the property market. Some studies investigated that research stream (e.g. Baldominos et al., Citation2018; Rafiei and Adeli Citation2016; Park and Bae Citation2015), but they mostly focus on (house price) prediction rather than inference and thus seldom evaluate the role of specific house attributes in determining house prices.
The remainder of this paper proceeds as follows. Section 2 reviews the literature on the association between transit and house prices and that between BRT and house prices. Sections 3 and 4 present the data and the methodology (i.e. hedonic pricing model and GBDT), respectively. Section 5 reports the analysis results of GBDT and compares them with hedonic modeling outcomes. Section 6 discusses policy implications and the employment of machine learning techniques in the property market. The last section winds up the paper and discusses research limitations.
2. Literature review
2.1. Transit and house prices
The theoretical underpinnings of the association between transit and house (or land) prices (or rents) can be traced back to land rent theory (Alonso Citation1964; Mills Citation1967; Muth Citation1969). Much existing literature has empirically determined such an association. Chau and Ng (Citation1998) assessed the impacts of metro accessibility on house prices in Hong Kong and verified positive impacts. Bowes and Ihlanfeldt (Citation2001) concluded that rail accessibility is positively related to single-family house prices in a region of the United States. Cervero and Duncan (Citation2002) reported that being near commuter rail stations added commercial land values in a Californian county, and the value of land in the business district and other districts within 0.25 mile of a station was 23% and 120% higher, respectively. Cao and Lou (Citation2018) confirmed that rail accessibility has a positive relationship with single-family house prices in St. Paul, the United States. Using a dataset of single-family houses transacted from 2000 to 2018, Zhang et al. (Citation2016) quantitatively evaluated the house price effect of urban rail transit using a dataset of 35 cities in China and determined that house prices increase by 2.33% for every 100% increase in rail transit mileage. Hess and Almeida (Citation2007) suggested that houses located within 0.25 mile of a light rail station can exhibit a price premium of 1300–3000 U.S. dollars, an amount which equals 2% to 5% of the city’s median house price.
Furthermore, Armstrong and Rodriguez (Citation2006) applied the distinct functional forms of the hedonic price equation to empirically evaluate the effects on house prices of accessibility to commuter rail service in seven municipalities of Eastern Massachusetts and validated the substantial benefits of accessibility’s capitalization. More specifically, the value of houses located in municipalities with rail stations was 9.6%-10.1% higher than those outside the area. Mathur (Citation2020) found that the prices of houses located within eight km of a transit station will increase across all price quantiles in a region of the United States. Zhang et al. (Citation2014) comprehensively analyzed the effect of various types of public transportation on house prices. They revealed that (1) metro rail transit increases the prices of houses located within 1 km, (2) light rail transit increases the prices of houses located within 0.5 km, and (3) BRT has an indiscernible effect on house prices. Nelson (Citation1992) identified a heterogeneous effect of heavy-rail transit stations on house prices. Specifically, accessibility to heavy-rail transit stations has a positive house price effect in a lower-income neighborhood but a negative effect in a higher-income neighborhood.
In summary, rail transit has frequently been inverstigated while BRT and conventional or traditional bus transit, especially the latter, have received much less scholarly attention. Existing studies have confirmed that transit can profoundly affect house prices and provided empirical supports for further investigation of BRT’s impact on house prices.
2.2. BRT and house prices
As noted earlier, in the BRT setting, prior studies reach a relatively consistent conclusion that BRT accessibility is positively related to house prices. We will discuss the literature in the sequence of the geographic location.
As a popular area of BRT, South America serves as an excellent laboratory for researchers to observe the BRT’s effect on house prices. A Columbia study by Rodríguez and Targa (Citation2004) made the earliest contribution to this research topic. This work found that rents will decrease by 6.8% to 9.3% for a 5-min increase in walk time. Rodríguez and Mojica (Citation2009) observed that the BRT system extension provides 13% to 14% price premiums to houses located in the catchment area. Using a propensity score matching (PSM) approach, Perdomo-Calvo et al. (Citation2007) suggested that BRT provides a 5.8%-17% price premium to adjacent houses. Perdomo (Citation2011) further verified the positive effect of BRT accessibility on house prices using PSM and the spatial hedonic pricing model. Munoz-Raskin (Citation2010) identified an 8.7% premium for houses close to the BRT feeder lines in Bogotá, Colombia. The author also determined a heterogeneous effect of BRT accessibility on house prices. Specifically, BRT accessibility is positively related to the prices of houses in an area populated by middle-income residents, and the association for houses assembled by low-income residents shows the opposite outcome.
Similar findings have also been documented in the studies of developed countries. For instance, Perk and Catala (Citation2009) reported approximately 16% price premiums associated with BRT accessibility in the United States. Using a quasi-natural experiment and a difference-in-differences research design, Dubé et al. (Citation2011) revealed that BRT adds value (2.9% to 6.9%) to adjacent houses in Canada. Mulley and Tsai (Citation2016) and Mulley and Tsai (Citation2017) also supported the preceding arguments with different house price estimation models in an Australian context.
For East Asian regions where densely populated cities dominate, the positive association between BRT accessibility and house prices has been reported in many cities, such as Seoul, Beijing, Guangzhou, and Xiamen. Cervero and Kang (Citation2011) found that houses located within 0.3 km of BRT stations experience 5%-10% price premiums in Seoul. Pang and Jiao (Citation2015) and Deng, Ma, and Nelson (Citation2016) documented a positive correlation between BRT accessibility and house prices in Beijing.
Moreover, an emerging strand of literature began to discuss the negative externalities of BRT in the Chinese context. Yang, Chau, and Chu (Citation2019) and Yang et al. (Citation2020a) concluded that proximity to the BRT corridor negatively affects house prices by using a series of econometric models, including the hedonic pricing model, Box-Cox transformed model, and spatial econometric models.
A large body of literature has investigated the effect of BRT on house prices using models that pre-determine the relationship between BRT-related attributes and the house price (more broadly, predictor variables and the predicted variable), but no investigations have examined the non-linear relationship between BRT and the house price. Hence, this study aims to fill this lacuna by using the supervised learning approach.
3. Data
3.1. Study area and the BRT system
Xiamen was selected as the study area (). With its enticing nickname as the ‘Garden on the Sea (haishang huayuan)’, Xiamen is a seaport and tourism city in Southeastern Fujian. As of 2019, Xiamen has a total area of 1700.61 km2 and a permanent resident population of 4.29 million, and its GDP reached 599.5 billion yuan. Moreover, the city is one of the major ancestral homes of overseas Chinese. More information on this city can be found in Tang et al. (Citation2013).
Figure 1. Map of Xiamen Island
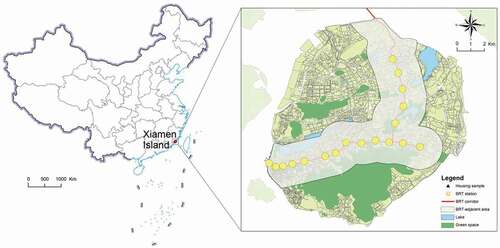
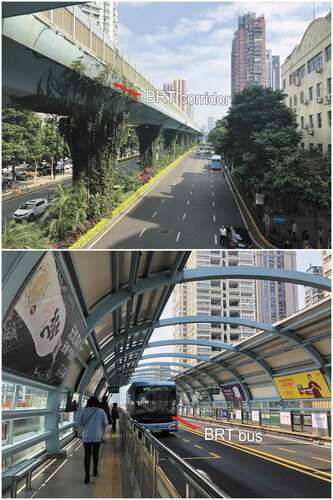
The BRT system in Xiamen Island () was put into service in the second half of 2008. The original three BRT lines (Line 1, Line 2, and Line 3) connect No.1 Port and Xiamen North Railway Station (outside the island), Xike (outside the island), and Qianpu (on the island), respectively. Furthermore, the BRT system is the first elevated system in China. This BRT system is special as it mostly has elevated lanes and thus achieves the complete separation from other traffic and involves no risks of traffic congestion. But the capital costs of Xiamen’s BRT are higher than those of other BRT systems as it was designed with the standards of light rail systems, enabling it to be easily transformed to light rapid transit whenever necessary. Moreover, Xiamen’s BRT fare is 1 yuan (1 U.S. dollar equals approximately 6.5 yuan), beyond which 0.15 yuan for every additional km. The peak price is 4 yuan for a single-way trip. In summary, the convenient and inexpensive service makes BRT an indispensable part of Xiamen residents’ daily life. Statistically, the total passenger volume has exceeded 1 billion, and the daily passenger volume is now approximately 0.3 million (People.cn Citation2019). Considering the importance of BRT in Xiamen, we can expect that BRT will have notable impacts on the value of adjacent houses.
Figure 2. BRT system in Xiamen Island
3.2. Data
To analyze the association between BRT and house prices, we collected a dataset of second-hand houses in the study area from Fang.com, one of the largest platforms for house rents and transactions on the Chinese mainland (covering many cities), in March 2017. The dataset is also used in the work of Yang et al. (Citation2020a). By employing corridor analysis (e.g. Olaru, Smith, and Taplin Citation2011; Salon, Wu, and Shewmake Citation2014), we selected houses located in the areas within 1.5 km of the BRT corridor. We finally obtained 5,185 observations, which are widely disseminated along the BRT corridor in Xiamen Island.
3.3 Variables
It is widely acknowledged that size (or total gross floor area) plays a dominating role in determining total house price. As such, if we choose total house price as the predicted variable, size has very high importance (over 90%), whereas all the other predictor variables have limited importance (below 10%). To better reveal the contributory role of the BRT-related variables, we used the house price per square meter (the ratio of the total house price to size) as the predicted variable.
showcases the descriptions and summary statistics of both predicted and predictor variables. As noted in Section 2, key explanatory variables representing BRT accessibility and BRT proximity are Distance to the BRT station and Proximity_400 m, respectively. Distance to the BRT station is measured as the distance between a house and the closest BRT station. Proximity_400 m is a dichotomous variable, which equals one if a house is located within 400 m of the BRT corridor and zero otherwise. Moreover, choosing independent variables that are expected to influence the value of a property and yield consumer utility, such as neighborhood and location variables, is an essential decision (Butler Citation1982; Case, Pollakowski, and Wachter Citation1991). Hence, we follow the existing literature in the process of choosing control variables (e.g. building height and distance to the airport).
Table 1. Descriptions and summary statistics of the predicted and predictor variables
4. Methodology
4.1. Hedonic pricing model
By exclusively focusing on the demand side of products, the hedonic pricing model is a common, prevalent revealed-preference tool for empirically assessing and identifying the determinants of the prices of heterogeneous products, such as houses (Yang et al. Citation2020a, Citation2020b). Its basic assumption is that a product consists of a series of its attributes (e.g. age, sea view, and access to shopping centers), and therefore, the price of a product is the linear combination of its attributes (Lancaster Citation1966; Rosen Citation1974).
The hedonic pricing model is mathematically formulated as
where represents the price of observation i (
),
is the intercept of the estimated model (which is usually added because product attributes included in the model are by no means exhaustive),
denotes a vector of attributes of observation i,
is a vector of coefficients (which can be viewed as shadow prices), and
is a residual that represents unobserved factors affecting product prices. Generally,
is estimated as
by the ordinary least squares (OLS) method and is calculated as
4.2. GBDT
This study employs GBDT to examine the non-linear impact of BRT on house prices. GBDT combines the strengths of both decision trees and gradient boosting. The GBDT algorithm can be divided into several steps. Firstly, a sample is categorized into several groups through decision trees. Secondly, the average value of the observed parameter is treated as the predicted variable. The model will generate a set of decision trees at this stage. Third, the model calculates the prediction errors and selects the optimal number of trees that minimizes prediction errors. The function of gradient boosting aggregates these simple models into a complex model by minimizing the prediction errors in the steepest route. Mathematically, the GBDT algorithm can be formulated as follows.
where is the function of the predicted variable (i.e. house price in this study);
is determined by minimizing the value of a loss function; and
is the basic function of decision trees. Generally, the equation can be interpreted as follows: the GBDT approach estimates the function
by expanding the basic function of decision trees
(Ding et al. Citation2016; Zhang and Haghani Citation2015).
Moreover, the GBDT approach estimates the relative importance of each predictor variable (i.e. house attributes in this study) in estimating the predicted variable. Specifically, GBDT can calculate the potential of each predictor variable to reduce its prediction errors. The sum of the relative importance of all variables equals 100%. For predictor variable , its relative importance can be described as follows (Breiman et al. Citation1984):
The GBDT model is superior to traditional regression models in several aspects. Firstly, it can avoid multicollinearity problems. Secondly, it has stronger predictive power. Thirdly, it can accommodate outliers and missing values. Moreover, GBDT does not generate p-values and other statistical indicators and does not pre-determine the association between predictor variables and the predicted variable.
5. Results
Following Ding, Cao, and Næss (Citation2018), the maximum number of trees was set as 10,000, and the shrinkage parameter was set as 0.001. A ten-way interaction was selected in the model. After 1400 boosting iterations, we obtained the optimal results from the model.
5.1. Relative importance of predictor variables
As noted, machine learning techniques cannot generate statistical significance indicators, in stark contrast to statistical models with a pre-determined relationship between predictor variables and the predicted variable. Nevertheless, GBDT will display the relative importance of each predictor variable.
presents the results of the GBDT model and displays the relative importance of each predictor variable. Distance to the sea is allocated the largest weight (40.4%) and therefore exhibits the most considerable importance among all variables. Two other important variables associated with house prices are Age and Building height, which account for 21.8% and 11.5% of relative importance, respectively.
Table 2. Relative importance of all predictor variables
The interpretation of the two BRT-related variables is of fundamental importance. The two variables account for 2.1% of the total relative importance. Additionally, the BRT accessibility variable has much higher importance than the BRT proximity variable.
5.2. Partial dependence plots (PDPs) of predictor variables
Aside from relative importance, GBDT and most, if not all, machine learning techniques can generate PDPs, which graphically demonstrate the association between the predicted variable and predictor variables. The x-axis of a PDP showcases the distribution of the predictor variable.
The PDP of the BRT accessibility variable (Distance to the BRT station) () shows the non-linear effect of BRT accessibility on house prices. Note that BRT accessibility is positively related to house prices. Moreover, we find that when the distance between BRT stations and houses ranges from 0.6 km to 1.3 km, house prices vary slightly. The result also highlights the advantage of GBDT as it cannot be discovered by traditional pre-determined statistical models.
Figure 3. PDP of distance to the BRT station
displays the PDP of the BRT proximity variable (Proximity_400 m). As the variable is an indicator variable, we only find that BRT proximity is negatively related to house prices.
Figure 4. PDP of proximity_400 m
The relationship between control variables and the predicted variable can be revealed by using the corresponding PDPs. To save space, we only provide the PDP of a dominant variable, namely age (). We observe that age has a negative but non-linear relationship with the house price, which is in congruence with reality.
Figure 5. PDP of age
5.3. Comparison of GBDT modeling and hedonic regression
Does GBDT outperform the hedonic pricing model in predicting our data? To answer this question, we compared the performance of the two kinds of models. We tested three basic hedonic functional forms (i.e. linear, semi-log, and double-log). The double-log hedonic pricing model performed best and was therefore adopted in subsequent comparative analysis. The hedonic modeling results are shown in . The two BRT-related variables have statistically negative coefficients and confirm positive BRT accessibility effects and negative BRT proximity effects. They performed as we expected.
Table 3. Hedonic regression results
We used 10-fold cross-validation to compare the performance of GBDT modeling and hedonic regression. presents the comparison results. The mean value of the out-of-sample R-squared of GBDT is much larger than (nearly double) that of the traditional hedonic pricing model, thereby indicating that GBDT has a stronger predictive power than the hedonic pricing model.
Table 4. Comparison of out-of-sample R-squared (10-fold cross-validation)
6. Discussion
6.1. Policy implications
The overwhelmingly high house price in China has aroused worldwide attention. Zhao (Citation2014) explained that a reason for the escalating (or skyrocketing) house price is the substantial improvement of urban public services. This study provides some evidence supporting his argument. At the end of 2016, Chinese President Xi Jinping explicitly stated that ‘homes are for living in, not for speculating on (fangzi shi yonglai zhu de, bushi yonglai chao de)’. This statement clarifies the residential (instead of investment) nature of houses. Although the government has periodically taken a host of policy measures (e.g. home-purchase restriction and increase in mandatory down-payments) to calm the market, real estate is still dynamic, and the house price surges. Purchasing a house has become difficult for residents in many Chinese cities, especially in megacities such as Beijing and Shenzhen. Given that a house is supposed to be an essential component of one’s life, persistently high prices may destabilize society.
In general, public transportation improves urban mobility (Stiglic et al. Citation2018) and brings price premiums to the adjacent land (including properties) (Zheng and Kahn Citation2008). House owners can enjoy house price appreciation with the development of public transportation. However, the operating costs of public transportation, as quasi-public goods, cannot be covered by its gross income (fare-box revenues). Government subsidies are often a necessity for guaranteeing the normal construction and operation of public transportation. Therefore, value capture schemes are often used to fill the fiscal gap (Aveline-Dubach and Blandeau Citation2019) and ease the government’s financial burden, contributing to the sustainable development of public transportation systems.
A property tax scheme is generally served as a value capture measure and has been adopted in many countries, but the measure is still at the pilot stage in some transitional economies with underdeveloped institutions (e.g. China) (Sharma and Newman Citation2018). Property tax schemes have only been implemented in two cities on the Chinese mainland (i.e. Shanghai and Chongqing). A more common approach for Chinese cities to conduct value capture is through transit-oriented development (TOD). In 2011, the Ministry of Transport of China selected 37 Chinese cities as the foci of TOD efforts (Xu et al. Citation2017). Nowadays, the land around public transportation stations is usually developed as commercial buildings and upmarket (high-end) residential buildings. Besides, value capture measures successfully implemented in other countries cannot directly transfer to China because of the considerable discrepancy of regulations, institutions, laws, norms, and so forth. As such, China-specific revenue-generating measures should be explored.
All land in China is owned by the state, and developers can acquire land use rights through land auctions. Hence, governments and developers need to estimate land values precisely. As our GBDT modeling results show, the relationship between accessibility to the BRT station and house prices is highly complex and not easy to be accurately modeled and correctly interpreted. Therefore, taking the complexity into consideration when crafting value capture schemes and other relevant policy measures is indispensable.
We found negative externalities of proximity to the BRT corridor. BRT proximity has a negative effect on house prices, which is possibly attributed to noise (rumbling of locomotives), traffic congestion, and road vibration. Consequently, relevant measures, including setting up acoustic barriers and planting vegetation wherever appropriate along the BRT corridor, can be implemented (Yang, Chau, and Chu Citation2019; Yang et al. Citation2020a). Moreover, the BRT corridor is far from the only facility with dis-amenity effects. Addressing the dis-amenity effects of NIMBY (not in my back yard) facilities, such as hospitals, funeral homes, airports, mobile base stations, oil wells, chemical plants, oil and chemical pipelines, power plants, and nursing homes (Yang et al. Citation2018; Zahirovic-Herbert and Gibler Citation2020), can be paid special attention in their planning and development.
6.2. Application of machine learning techniques in the real estate market
House prices are typically estimated by traditional econometric models, such as hedonic pricing models. Some studies have attempted to adopt machine learning techniques for real estate appraisal. Baldominos et al. (Citation2018) used a series of machine learning techniques, such as regression trees and neural networks, to predict house prices in Madrid, Spain. Park and Bae (Citation2015) compared the performance of different machine learning algorithms in predicting house prices in the United States. Hausler, Ruscheinsky, and Lang (Citation2018) created various market sentiment measures by using trained support vector networks and investigating how news affects direct and indirect commercial real estate markets. Viriato (Citation2019) examined the adoption of artificial intelligence and machine learning in real estate investment. Hu et al. (Citation2019) tested six machine-learning algorithms in predicting house rentals in Shenzhen, China.
This study provides valuable insights into the employment of machine learning techniques in the property market. Inspired by the recent application of machine learning techniques, this work concentrates on the relationship between BRT and house prices. Its results show that accessibility to BRT stations has a complex and non-linear effect on house prices and thus advance our understanding of the genuinely non-linear relationship. Moreover, in a departure from much literature that employs machine techniques for prediction, we focused on only a set of (two) variables and utilized machine techniques for inference. The analysis result is reasonable and in agreement with our expectations.
7. Concluding remarks
Predominately as a response to various conspicuous urban problems, transit has aroused substantial attention from governments, researchers, and so forth. It is becoming increasingly important worldwide. As a popular mode of transit, BRT, which is characterized by cost-effectiveness, environmental friendliness, and high flexibility. Therefore, residents are willing to pay more for a property near a BRT station. On the contrary, proximity to the BRT corridor often generates negative externalities to residents, thereby resulting in a price discount to nearby houses. Although both issues have been discussed by prior studies, this work further investigates the non-linear impact of BRT on house prices.
In this study, we scrutinized the non-linear effect of BRT on house prices using a machine learning technique (i.e. GBDT). By using a dataset of Xiamen, we confirmed that house prices are positively related to accessibility to BRT stations but are negatively correlated with proximity to the BRT corridor. The relationship between accessibility to BRT stations and house prices is highly non-linear and complex. Moreover, GBDT has a stronger predictive power than the hedonic pricing model, which is frequently employed in traditional real estate valuation studies. This study can serve as a valuable reference for researchers and institutions working on similar topics and governments that concern the relationship between transportation accessibility and house prices. Broadly, this study also improves the understanding of open geographic modeling (e.g. Eisman, Gebelein, and Breslin Citation2017; Chen et al. Citation2020; Gao et al. Citation2019).
This study is by no means without limitations. Firstly, this work only compares the performance of a single machine learning approach and the hedonic pricing model. Therefore, it would be of interest to introduce different machine learning techniques to estimate house prices and compare their results with those of the hedonic pricing model in future research. Secondly, many databases owned by governments or companies are confidential and not open to the public. Therefore, this work was restricted by data unavailability to some degree. Indeed, the missing variable bias in relation to our research topic was challenging, if not impossible, to overcome. However, with sufficient data, more price-influencing attributes of houses (e.g. neighborhood-level socioeconomic status, school district, crime rate, and landscape view) can be measured and controlled in the models. Thirdly, there is no doubt that Xiamen’s housing prices have changed dramatically from 2008 to now. Therefore, it is important to track the time-series effect of BRT on house prices in Xiamen for future studies. Fourthly, there may be a strong endogeneity between BRT and house prices because, in general, BRT stations are preferentially placed in urban centers with excellent locations and high pedestrian traffic, which are also areas with high housing prices. Hence, more sophisticated modeling techniques (e.g. instrumental variable and regression discontinuity design) are needed to delve into this research problem. Lastly, BRT gradually loses its role and significance with the opening and development of the metro system in the study area (since the last day of 2017). The BRT accessibility-induced house price premium may diminish and even evaporate. Exploring the change in the premium is worthy of further investigation.
Acknowledgments
This study is sponsored by the National Natural Science Foundation of China (No. U20A20330). The authors are beholden to the editor and the two reviewers for their helpful comments.
Disclosure statement
The authors declare no conflict of interest.
References
- Alonso, W. 1964. Location and Land Use. Toward a General Theory of Land Rent. Cambridge: Harvard University Press.
- Armstrong, R. J., and D. A. Rodriguez. 2006. “An Evaluation of the Accessibility Benefits of Commuter Rail in Eastern Massachusetts Using Spatial Hedonic Price Functions.” Transportation 33 (1): 21–43. doi:https://doi.org/10.1007/s11116-005-0949-x.
- Aveline-Dubach, N., and G. Blandeau. 2019. “The Political Economy of Transit Value Capture: The Changing Business Model of the MTRC in Hong Kong.” Urban Studies 56 (16): 3415–3431. doi:https://doi.org/10.1177/0042098018821519.
- Baldominos, A., I. Blanco, A. J. Moreno, R. Iturrarte, Ó. Bernárdez, and C. Afonso. 2018. “Identifying Real Estate Opportunities Using Machine Learning.” Applied Sciences 8 (11): 2321. doi:https://doi.org/10.3390/app8112321.
- Bao, Z., and W. Lu. 2020. “Developing Efficient Circularity for Construction and Demolition Waste Management in Fast Emerging Economies: Lessons Learned from Shenzhen, China.” Science of the Total Environment 724: 138264. doi:https://doi.org/10.1016/j.scitotenv.2020.138264.
- Bao, Z., W. Lu, B. Chi, H. Yuan, and J. Hao. 2019. “Procurement Innovation for a Circular Economy of Construction and Demolition Waste: Lessons Learnt from Suzhou, China.” Waste Management 99: 12–21. doi:https://doi.org/10.1016/j.wasman.2019.08.031.
- Bocarejo, J. P., I. Portilla, and M. A. Pérez. 2013. “Impact of TransMilenio on Density, Land Use, and Land Value in Bogotá.” Research in Transportation Economics 40 (1): 78–86. doi:https://doi.org/10.1016/j.retrec.2012.06.030.
- Bowes, D. R., and K. R. Ihlanfeldt. 2001. “Identifying the Impacts of Rail Transit Stations on Residential Property Values.” Journal of Urban Economics 50 (1): 1–25. doi:https://doi.org/10.1006/juec.2001.2214.
- Breiman, L., J. Friedman, C. J. Stone, and R. A. Olshen. 1984. Classification and Regression Trees. Wadsworth international group, Belmont, CA, U.S.A..
- BRTDATA.ORG 2020. Accessed 10 January 2021. http://brtdata.org
- Butler, R. V. 1982. “The Specification of Hedonic Indexes for Urban Housing.” Land Economics 58 (1): 96–108. doi:https://doi.org/10.2307/3146079.
- Cao, X., and S. Lou. 2018. “When and How Much Did the Green Line LRT Increase Single-family Housing Values in St. Paul, Minnesota?” Journal of Planning Education and Research 38 (4): 427–436. doi:https://doi.org/10.1177/0739456X17707811.
- Case, B., H. O. Pollakowski, and S. M. Wachter. 1991. “On Choosing among House Price Index Methodologies.” Real Estate Economics 19 (3): 286–307. doi:https://doi.org/10.1111/1540-6229.00554.
- Cervero, R., and C. D. Kang. 2011. “Bus Rapid Transit Impacts on Land Uses and Land Values in Seoul, Korea.” Transport Policy 18 (1): 102–116. doi:https://doi.org/10.1016/j.tranpol.2010.06.005.
- Cervero, R., & Duncan, M. (2002). Benefits of proximity to rail on housing markets: Experiences in Santa Clara County. Journal of Public Transportation, 5(1), 3.
- Cervero, R., and K. Kockelman. 1997. “Travel Demand and the 3Ds: Density, Diversity, and Design.” Transportation Research. Part D: Transport and Environment 2 (3): 199–219. doi:https://doi.org/10.1016/S1361-9209(97)00009-6.
- Chau, K. W., and F. F. Ng. 1998. “The Effects of Improvement in Public Transportation Capacity on Residential Price Gradient in Hong Kong.” Journal of Property Valuation and Investment 16 (4): 397–410. doi:https://doi.org/10.1108/14635789810228204.
- Chen, M., A. Voinov, D. P. Ames, A. J. Kettner, J. L. Goodall, A. J. Jakeman, … G. Lü. 2020. “Position Paper: Open Web-distributed Integrated Geographic Modelling and Simulation to Enable Broader Participation and Applications.” Earth-Science Reviews 207: 103223. doi:https://doi.org/10.1016/j.earscirev.2020.103223.
- Deng, T., M. Ma, and J. D. Nelson. 2016. “Measuring the Impacts of Bus Rapid Transit on Residential Property Values: The Beijing Case.” Research in Transportation Economics 60: 54–61. doi:https://doi.org/10.1016/j.retrec.2016.08.005.
- Ding, C., X. Wu, G. Yu, and Y. Wang. 2016. “A Gradient Boosting Logit Model to Investigate Driver’s Stop-or-run Behavior at Signalized Intersections Using High-resolution Traffic Data.” Transportation Research Part C: Emerging Technologies 72: 225–238. doi:https://doi.org/10.1016/j.trc.2016.09.016.
- Ding, C., X. J. Cao, and P. Næss. 2018. “Applying Gradient Boosting Decision Trees to Examine Non-linear Effects of the Built Environment on Driving Distance in Oslo.” Transportation Research Part A: Policy and Practice 110: 107–117.
- Dong, N., F. Meng, J. Zhang, S. C. Wong, and P. Xu. 2020. “Towards Activity-based Exposure Measures in Spatial Analysis of Pedestrian–motor Vehicle Crashes.” Accident Analysis & Prevention 148: 105777. doi:https://doi.org/10.1016/j.aap.2020.105777.
- Dubé, J., F. Des Rosiers, M. Thériault, and P. Dib. 2011. “Economic Impact of A Supply Change in Mass Transit in Urban Areas: A Canadian Example.” Transportation Research Part A: Policy and Practice 45 (1): 46–62.
- Eisman, E., J. Gebelein, and T. A. Breslin. 2017. “Developing a Geographically Weighted Complex Systems Model Using Open-source Data to Highlight Locations Vulnerable to Becoming Terrorist Safe-havens.” Annals of GIS 23 (4): 251–267. doi:https://doi.org/10.1080/19475683.2017.1368705.
- Friedman, J. H. 2001. “Greedy Function Approximation: A Gradient Boosting Machine.” Annals of Statistics 29 (5): 1189–1232.
- Gao, S., M. Li, Y. Liang, J. Marks, Y. Kang, and M. Li. 2019. “Predicting the Spatiotemporal Legality of On-street Parking Using Open Data and Machine Learning.” Annals of GIS 25 (4): 299–312.. doi:https://doi.org/10.1080/19475683.2019.1679882.
- Hausler, J., J. Ruscheinsky, and M. Lang. 2018. “News-based Sentiment Analysis in Real Estate: A Machine Learning Approach.” Journal of Property Research 35 (4): 344–371. doi:https://doi.org/10.1080/09599916.2018.1551923.
- Hess, D. B., and T. M. Almeida. 2007. “Impact of Proximity to Light Rail Rapid Transit on Station-area Property Values in Buffalo, New York.” Urban Studies 44 (5–6): 1041–1068. doi:https://doi.org/10.1080/00420980701256005.
- Hu, L., S. He, Z. Han, H. Xiao, S. Su, M. Weng, and Z. Cai. 2019. “Monitoring Housing Rental Prices Based on Social Media: An Integrated Approach of Machine-learning Algorithms and Hedonic Modeling to Inform Equitable Housing Policies.” Land Use Policy 82: 657–673. doi:https://doi.org/10.1016/j.landusepol.2018.12.030.
- Kilpatrick, J., R. Throupe, J. Carruthers, and A. Krause. 2007. “The Impact of Transit Corridors on Residential Property Values.” Journal of Real Estate Research 29 (3): 303–320. doi:https://doi.org/10.1080/10835547.2007.12091201.
- Lancaster, K. J. 1966. “A New Approach to Consumer Theory.” Journal of Political Economy 74 (2): 132–157. doi:https://doi.org/10.1086/259131.
- Li, W., J. Zhu, L. Fu, Q. Zhu, Y. Guo, and Y. Gong. 2021. “A Rapid 3D Reproduction System of Dam-break Floods Constrained by Post-disaster Information.” Environmental Modelling & Software 139: 104994. doi:https://doi.org/10.1016/j.envsoft.2021.104994.
- Li, W., J. Zhu, L. Fu, Q. Zhu, Y. Xie, and Y. Hu. 2020. “An Augmented Representation Method of Debris Flow Scenes to Improve Public Perception.” International Journal of Geographical Information Science 1–24. doi:https://doi.org/10.1080/13658816.2020.1833016.
- Mathur, S. 2020. “Impact of Transit Stations on House Prices across Entire Price Spectrum: A Quantile Regression Approach.” Land Use Policy 99: 104828. doi:https://doi.org/10.1016/j.landusepol.2020.104828.
- Meng, F., P. Xu, C. Song, K. Gao, Z. Zhou, and L. Yang. 2020. “Influential Factors Associated with Consecutive Crash Severity: A Two-level Logistic Modeling Approach.” International Journal of Environmental Research and Public Health 17 (15): 5623. doi:https://doi.org/10.3390/ijerph17155623.
- Mills, E. S. 1967. “An Aggregative Model of Resource Allocation in a Metropolitan Area.” The American Economic Review 57 (2): 197–210.
- Mulley, C., and C.-H. Tsai. 2016. “When and How Much Does New Transport Infrastructure Add to Property Values? Evidence from the Bus Rapid Transit System in Sydney, Australia.” Transport Policy 51: 15–23. doi:https://doi.org/10.1016/j.tranpol.2016.01.011.
- Mulley, C., and C.-H. Tsai. 2017. “Impact of Bus Rapid Transit on Housing Price and Accessibility Changes in Sydney: A Repeat Sales Approach.” International Journal of Sustainable Transportation 11 (1): 3–10. doi:https://doi.org/10.1080/15568318.2015.1106223.
- Munoz-Raskin, R. 2010. “Walking Accessibility to Bus Rapid Transit: Does It Affect Property Values? The Case of Bogotá, Colombia.” Transport Policy 17 (2): 72–84. doi:https://doi.org/10.1016/j.tranpol.2009.11.002.
- Muth, R. F. 1969. Cities and Housing: The Spatial Pattern of Urban Residential Land Use. Chicago: Third Series: Studies in Business and Society, University of Chicago Press.
- Nelson, A. C. 1992. “Effects of Elevated Heavy-rail Transit Stations on House Prices with respect to Neighborhood Income.” Transportation Research Record (1359). 127-132.
- Olaru, D., B. Smith, and J. H. Taplin. 2011. “Residential Location and Transit-oriented Development in a New Rail Corridor.” Transportation Research Part A: Policy and Practice 45 (3): 219–237.
- Olszewski, K., J. Waszczuk, and M. Widłak. 2017. “Spatial and Hedonic Analysis of House Price Dynamics in Warsaw, Poland.” Journal of Urban Planning and Development 143 (3): 04017009. doi:https://doi.org/10.1061/(ASCE)UP.1943-5444.0000394.
- Páez, A., D. M. Scott, and C. Morency. 2012. “Measuring Accessibility: Positive and Normative Implementations of Various Accessibility Indicators.” Journal of Transport Geography 25: 141–153. doi:https://doi.org/10.1016/j.jtrangeo.2012.03.016.
- Pang, H., and J. Jiao. 2015. “Impacts of Beijing Bus Rapid Transit on Pre-owned Home Values.” Journal of Public Transportation 18 (2): 34–44. doi:https://doi.org/10.5038/2375-0901.18.2.3.
- Park, B., and J. K. Bae. 2015. “Using Machine Learning Algorithms for Housing Price Prediction: The Case of Fairfax County, Virginia Housing Data.” Expert Systems with Applications 42 (6): 2928–2934. doi:https://doi.org/10.1016/j.eswa.2014.11.040.
- People.cn. 2019. http://fj.people.com.cn/n2/2019/0227/c181466-32689216.html
- Perdomo, J. A. 2011. “A Methodological Proposal to Estimate Changes of Residential Property Value: Case Study Developed in Bogota.” Applied Economics Letters 18 (16): 1577–1581. doi:https://doi.org/10.1080/13504851.2011.554360.
- Perdomo-Calvo, J. A., C. A. Mendoza, A. F. Baquero-Ruiz, and J. C. Mendieta-Lopez 2007. “Study of the Effect of the TransMilenio Mass Transit Project on the Value of Properties in Bogotá, Colombia.” Lincoln Institute of Land Policy Working Paper No. WP07CA1.
- Perk, V. A., and M. Catala 2009. Land use impacts of bus rapid transit: Effects of BRT station proximity on property values along the Pittsburgh Martin Luther King, Jr. East Busway. No. FTA-FL-26-7109.2009.6.
- Rafiei, M. H., and H. Adeli. 2016. “A Novel Machine Learning Model for Estimation of Sale Prices of Real Estate Units.” Journal of Construction Engineering and Management 142 (2): 04015066. doi:https://doi.org/10.1061/(ASCE)CO.1943-7862.0001047.
- Rodríguez, D. A., and C. H. Mojica. 2009. “Capitalization of BRT Network Expansions Effects into Prices of Non-expansion Areas.” Transportation Research Part A: Policy and Practice 43 (5): 560–571.
- Rodríguez, D. A., and F. Targa. 2004. “Value of Accessibility to Bogotá’s Bus Rapid Transit System.” Transport Reviews 24 (5): 587–610. doi:https://doi.org/10.1080/0144164042000195081.
- Rosen, S. 1974. “Hedonic Prices and Implicit Markets: Product Differentiation in Pure Competition.” Journal of Political Economy 82 (1): 34–55. doi:https://doi.org/10.1086/260169.
- Salon, D., J. Wu, and S. Shewmake. 2014. “Impact of Bus Rapid Transit and Metro Rail on Property Values in Guangzhou, China.” Transportation Research Record 2452 (1): 36–45. doi:https://doi.org/10.3141/2452-05.
- Sharma, R., and P. Newman. 2018. “Does Urban Rail Increase Land Value in Emerging Cities? Value Uplift from Bangalore Metro.” Transportation Research Part A: Policy and Practice 117: 70–86.
- Stiglic, M., N. Agatz, M. Savelsbergh, and M. Gradisar. 2018. “Enhancing Urban Mobility: Integrating Ride-sharing and Public Transit.” Computers & Operations Research 90: 12–21. doi:https://doi.org/10.1016/j.cor.2017.08.016.
- Tang, L., Y. Zhao, K. Yin, and J. Zhao. 2013. “Xiamen.” Cities 31: 615–624. doi:https://doi.org/10.1016/j.cities.2012.09.001.
- Viriato, J. C. 2019. “AI and Machine Learning in Real Estate Investment.” The Journal of Portfolio Management 45 (7): 43–54. doi:https://doi.org/10.3905/jpm.2019.45.7.043.
- Xia, C., A. G. O. Yeh, and A. Zhang. 2020. “Analyzing Spatial Relationships between Urban Land Use Intensity and Urban Vitality at Street Block Level: A Case Study of Five Chinese Megacities.” Landscape and Urban Planning 193: 103669. doi:https://doi.org/10.1016/j.landurbplan.2019.103669.
- Xiao, Y., E. C. Hui, and H. Wen. 2019. “Effects of Floor Level and Landscape Proximity on Housing Price: A Hedonic Analysis in Hangzhou, China.” Habitat International 87: 11–26. doi:https://doi.org/10.1016/j.habitatint.2019.03.008.
- Xu, W., A. Guthrie, Y. Fan, and Y. Li. 2017. “Transit-oriented Development in China: Literature Review and Evaluation of TOD Potential across 50 Chinese Cities.” Journal of Transport and Land Use 10 (1): 743–762. doi:https://doi.org/10.5198/jtlu.2017.922.
- Yang, J., J. Cao, and Y. Zhou. 2021. “Elaborating Non-linear Associations and Synergies of Subway Access and Land Uses with Urban Vitality in Shenzhen.” Transportation Research Part A: Policy and Practice 144: 74–88.
- Yang, L., B. Wang, J. Zhou, and X. Wang. 2018. “Walking Accessibility and Property Prices.” Transportation Research Part D: Transport and Environment 62: 551–562. doi:https://doi.org/10.1016/j.trd.2018.04.001.
- Yang, L., K. W. Chau, W. Y. Szeto, X. Cui, and X. Wang. 2020b. “Accessibility to Transit, by Transit, and Property Prices: Spatially Varying Relationships.” Transportation Research Part D: Transport and Environment 85: 102387. doi:https://doi.org/10.1016/j.trd.2020.102387.
- Yang, L., K. W. Chau, and X. Chu. 2019. “Accessibility-based Premiums and Proximity-induced Discounts Stemming from Bus Rapid Transit in China: Empirical Evidence and Policy Implications.” Sustainable Cities and Society 48: 101561. doi:https://doi.org/10.1016/j.scs.2019.101561.
- Yang, L., X. Chu, Z. Gou, H. Yang, Y. Lu, and W. Huang. 2020a. “Accessibility and Proximity Effects of Bus Rapid Transit on Housing Prices: Heterogeneity across Price Quantiles and Space.” Journal of Transport Geography 88: 102850. doi:https://doi.org/10.1016/j.jtrangeo.2020.102850.
- Zahirovic-Herbert, V., and K. M. Gibler. 2020. “Neighbouring House Transaction Response to Assisted Living Facilities and Nursing Homes.” Housing Studies 35 (2): 195–213. doi:https://doi.org/10.1080/02673037.2019.1594714.
- Zhang, M., X. Meng, L. Wang, and T. Xu. 2014. “Transit Development Shaping Urbanization: Evidence from the Housing Market in Beijing.” Habitat International 44: 545–554. doi:https://doi.org/10.1016/j.habitatint.2014.10.012.
- Zhang, X., X. Liu, J. Hang, D. Yao, and G. Shi. 2016. “Do Urban Rail Transit Facilities Affect Housing Prices? Evidence from China.” Sustainability 8 (4): 380. doi:https://doi.org/10.3390/su8040380.
- Zhang, Y., and A. Haghani. 2015. “A Gradient Boosting Method to Improve Travel Time Prediction.” Transportation Research Part C: Emerging Technologies 58: 308–324. doi:https://doi.org/10.1016/j.trc.2015.02.019.
- Zhao, Y. 2014. “Land Finance in China: History, Logic and Choice.” Urban Development Studies 21 (1): 1–13.
- Zheng, S., and M. E. Kahn. 2008. “Land and Residential Property Markets in a Booming Economy: New Evidence from Beijing.” Journal of Urban Economics 63 (2): 743–757. doi:https://doi.org/10.1016/j.jue.2007.04.010.