
 ?Mathematical formulae have been encoded as MathML and are displayed in this HTML version using MathJax in order to improve their display. Uncheck the box to turn MathJax off. This feature requires Javascript. Click on a formula to zoom.
ABSTRACT
The traditional hill-shading map is usually produced from a digital elevation model (DEM) by using the method of hypsometric tinting, which is capable of demonstrating the changes in geomorphology by setting the colors for hill-shading. However, the disadvantage is obvious that the surface features of the terrain can only be utilized by putting vector data on the map. Hence, the terrain display effect will be altered, especially in the production of large-scale maps, for which the artistic effect will be greatly weakened. This paper proposes a solution to this problem. First, we transform the RGB color space of the Digital orthophotographic map (DOM) image into the intensity-hue-saturation (IHS) color space. Then, we calculate the new value of the intensity as I′ for each pixel of the shaded relief model (SRM) of the high-resolution remote sensing image. Finally, we replace the component I with the new component I′ and then proceed with the inverse IHS transform. The case study shows that an objective representation of the actual situation is presented in the mapping area, and the 3D performance capabilities are enhanced. This research indicates that when the method of fusing the processed SRM with the IHS color system is used, the optimum index factor (OIF) and entropy of the generated map are 41.26 and 12.05, respectively, which are much greater than for the results of the traditional method. In other words, the proposed method can greatly enhance the terrain effect.
1. Introduction
Hill-shading is a technique for creating relief maps, showing the topographical shape of hills and mountains using shading (levels of grey) on a map to indicate relative slopes, mountain ridges et al. And hill-shading map is commonly used to provide an objective but artistic representation of varying terrain in a 2D map (Maguire, Goodchild, and Rhind Citation1991; Robinson, Morrison, and Muehrcke et al. Citation1995; Wilson and Gallant Citation2000; Slocum, McMaster, and Kessler Citation2004; Li and Du Citation2004; Kennelly Citation2008). Because of its intuitive visual experience for map users, the hill-shading method is widely applied in many fields including digital cartography, geographical information science (GIS), and 3D terrain visualization (Goodchild Citation2018, Gil et al. Citation2014). In the production of hill-shading map, digital elevation model (DEM) data and digital orthophotographic map (DOM) have become an important data source. With the developments of remote sensing and computer cartographic technology, hill-shading methods with the support of DEM and DOM are the focus of digital hill-shading mapping.
There are mainly three categories for hill-shading methods with the support of DEM and DOM. The first is the DEM-based method which uses the DEM data of the target area as the main data source (Guan, Huang, and Rong Citation2017; Wang et al. Citation2018). In this method, the basic idea is as follows: 1) setting colours for the DEM by using the hypsometric tinting method, which enables the map to have different colours reflecting the geomorphological traits of the different geographic regions (Billingsley Citation2000) such as the plateau, hills, and snow-covered areas; 2) using specific GIS software, such as ArcGIS, to generate the terrain shadow data for a certain illumination angle that stands for a certain time of day (Brewer Citation2005); and, 3) with the help of the software, the hypsometric DEM data is converted into a shadow file with inputs of the above two categories of data. Finally, by setting the attributes of the layers (Brewer and Marlow Citation1993; Dang Citation2005), the extent of hypsometric transparency is set between 10% and 70% to obtain a good landscape simulation with mutual visual penetration between the hypsometric files and shadow files. The images are then exported as high-resolution raster data files (El-Sheimy, Valeo, and Habib Citation2005). In this type of method, the continuous surface of the terrain model is divided into many units, such as triangles or quadrilaterals. The units are projected onto a plane and the corresponding colour system is used to create a simulation of the ups and downs of the landforms in the real world (Çöltekin and Biland Citation2019). The smaller the unit selected for this process, the more continuous and more natural the hill-shading maps are. With the increase in the unit, the resources of computation will increase greatly, and then the cartographic efficiency would be lowered. Therefore, this type of method is limited by production efficiency especially when the data is huge. Another problem is that only vector data can be put on the hill-shading files which would convey a great amount of geographic information, the capability for geolocation in the hill-shading files is diminished.
The second is a DOM-based method which uses the DOM image as the background of a map. The DEM data is superimposed directly on the DOM to generate a 3D model (Aronoff Citation2005), and then the illumination angle is input as a vertical parameter to generate the hill-shading files (Lillesand, Kiefer, and Chipman Citation2004). This method is widely used in the production of 3D image maps, especially for a hill-shading map equipped with an image function whereby geolocation features can be generated, and such a map has better reading efficiency. However, the rolling nature of the terrain is not presented well enough and the visual effect of the terrain is poor, the shadow correspondence problem manifests itself in cartography through the relief inversion effect which describes a perplexing visual illusion that occurs in DOM images (Çöltekin and Biland Citation2019), so the expressiveness of the map is affected.
The third method is based on both DEM and DOM. This method integrates the different raster file sources (DOM and DEM) with the same coordinate system in the same cartographic area to produce the hill-shading map. Three steps are needed in this approach. The first step is to extract the areas of mountains and hills in the DOM data and divide the image area into two layers: one is the mountain area layer with 50% transparency, and the other is the flat area layer. Second, GIS software is used to prepare the hypsometric file from DEM data in accordance with the colour characteristics of the different geographical regions by dividing the gradual changes of the DEM into 32–64 levels, as the RGB values of each colour level, need to correspond with the extracted mountain image in order to enhance the aesthetics of the map (Kennelly and Kimerling Citation2001, Citation2004). At the same time, the DEM data are used to generate the shadow (shade) file of certain incident angles (Kennelly and Stewart Citation2006). Third, the GIS software is used to produce a new hill-shading map by overlaying the veneer data and the shadow file with the same coordinate system. Usually, in order to take the artistic expression of thematic maps into account by highlighting the positive landforms, the heights in the DEM are exaggerated appropriately when the terrain files are produced (Mark Citation1992). Finally, the transparent DOM file with mountain or hill areas is used to replace the transparent hypsometric file used in the hill-shading method based on a DEM.
The method based on both DEM and DOM has conquered many problems, including 1) the problem of the enormous workload in the traditional method of hand-painted hill-shading; 2) the problem of the inability to realize the 3D effect with the hypsometric tinting method, and 3) the problem of integrating the expressiveness of the DEM for terrain and the expressiveness of the DOM for geographic information. However, the key point of this method is to set the transparency of the image data and hypsometric colour for terrain. In terms of the image, we should not set them over transparent in case losing the geographic information in the hill-shading. In terms of the hypsometric DEM, the selection of colour is very critic, the following factors should be taken into account: the colour system of the hypsometric DEM should be corresponding to the geographical situation in the mapping area, and the colour should be weaken in order to avoid affecting the presentation of geographic information displayed on the hill-shading. At the same time, repeated testing of the image transparency coefficient and the colour of the hypsometric for DEM is needed to find an optimal junction in order to achieve the best expression of art and science for the hill-shading and this junction remains changing, needing a constant adjusting to adapt to the changing in the geographical characteristics of the mapping areas. Description of the problem above indicates that problems involved in the hill-shading like the geographical accuracy, the diversity of software, size limits in the data conversion, etc., cannot be resolved thoroughly by the method of simply overlay the DOM and the DEM file to produce hill-shading method, and we should deal with the problem in the method of integrating the image (the raster file).
This paper explores methods by which realistic hill-shading map can be effectively generated. The methods are based on shaded relief map and digital orthophotographic map image fusion and IHS transformation. The basic idea is to construct a model using image fusion technology for the production of hill-shading maps. Method details will be described in the next section and the third part is experiments and results. Discussions are in the forth section. The last is the conclusion.
2. Methods
2.1. Principle of image fusion
Image fusion is considered as the process which combines multi-sensor and multi-resolution images (Chavez, Guptill, and Bowell Citation1984). It endows the image with the attributes of high spatial resolution and high spectral resolution and is commonly used to enhance remote sensing images. There are some commonly used methods such as the false-colour composite of RGB, the colour transform of IHS (Sun, Liu, and Li Citation1998; Schetselaar Citation1998), the principal component transform of PCA, and exchanges of components (Li, Zhou, and Li Citation1999).
Many researchers have shown that the fusion of high-resolution images and multi-spectral images can combine the advantages of two different kinds of sensors to improve the capability of the colour restoration and the analytical usefulness of the image. These studies have provided the theoretical and practical foundations for the production of hill-shading based on modern high-quality GIS data (DOM and DEM). Until now, we have focused on the enhancement and fusion of the remotely sensed images, and we have not discussed the method that uses the fused images to construct thematic maps (2D and 3D maps). The image fusion technology is believed able to serve as a new method for the production of hill-shading maps (McCullagh Citation1998).
2.2. IHS and SRM-based method for construction of hill-shading map
According to the principle of image fusion, a new method combining the shaded relief model (SRM) and the IHS colour system is designed to enhance the effect of a hill-shading map. DEM and DOM images are used as basic inputs of the presented method.
First, the DOM image is processed by using an IHS colour transform with the following equations.
where I stands for component of intensity (the brightness); H stands for component of hue (the spectral information), and S stands for component of saturation; V1 and V2 are intermediate variables used for the calculation of H and S. Among the three components, the brightness, which refers to the feeling of the human eye to the brightness of a light source or object, is generally proportional to the reflectivity of the object. It is independent and contributing to the effect of hill-shading most. Two parts of important information are included in the I component. One part is the terrain factor formed by the different brightness, which is also the main influence factor of DOM image pseudoscopic effect, and the other is the different reflectivity of different objects formed by the different brightness. Therefore, we use shaded relief maps (SRM) to replace the topographic factors in the I component, while retaining the different reflectivity factors of the ground features, thus combining into a new intensity component. The shaded relief maps (SRM), which is a colour 3D representation of the terrain and is created by merging the images from the elevation-coded and shaded methods, is mainly produced from digital elevation model (DEM) data sources by using GIS functions, which uses the altitude and azimuth properties to specify the sun’s position. So replacing the intensity component with a new intensity component containing the contents of natural terrain information and shading textures will help us to acquire the more realistic hill-shading map. After using the new intensity component, the inverse equation for IHS to RGB transformation can be expressed as:
The new brightness I′ should include both the brightness of the terrain and the brightness caused by different reflections. If we directly replace the brightness I with the SRM data, it would inevitably result in the loss of the geographic information represented by the brightness I and make the resultant stereo images appear too smooth. Experiments have revealed that when the DOM image is relatively dark (e.g., converted to radiation brightness) and the original values of the pixels are thus relatively low. The SRM value will much bigger than the other two components. Hence, the SRM terrain information is overwhelmingly predominant and the spectral information on ground objects is difficult to maintain, so the tone of the stereo images is affected and the whole image is somewhat too bright. For example, the low-brightness part in the original image that corresponds to water is converted into a high-brightness part in the SRM because of its flatness and is then rendered in bright blue, so the spectrum is distorted. If the original image is stretched to make the I value and the SRM value equal in the order of magnitude, then the spectrum of the image is altered in meaning even though the tonal distortion of the stereo images is eliminated to some extent.
In order to acquire a good expression for the new component I′ and preserve the spectral information of the naturally low-brightness part and brighter part, the new component I′ can be acquired by combining the SRM value and the brightness value Inew when the sun is in the northwest at a certain ratio (Qi, Zhu, and McAllister Citation2015; Buddeberg, Jenny, and Willett Citation2017). Under this principle, a new equation for intensity calculation is constructed as follows:
where I′ is the new intensity components; SRM is the pixel value from SRM image with value ranging from 0 to 1 that represents the direct reflection from the land in certain direction corresponding to different incidence angles; a and b are weight coefficients calculated according to the relative importance of terrain information and spectral information with a + b equal to 1. If the value of weight b is set relatively high, the spectral information will be more preserved in the new intensity component. However, if the weight b is too high, the 3D effect will be altered, so the value of the weight b needs repeated testing, and the fusion operation alone cannot fully retain the meaning of the spectrum of the image. Inew stands for the brightness from the sun at a specific direction and the northeast is commonly used. According to the human vision system and observing habit, the sun is supposed in the northwest and Inew can be acquired by EquationEq. (6)(6)
(6) .
where Inor is the brightness of the pixel of vertical incidence; i′ is the incidence angle of the pixel when the sun is in the northwest. The cosine value of i′ can be further calculated by EquationEq. (7)(7)
(7) . EquationEq. (8)
(8)
(8) and EquationEq. (9)
(9)
(9) are used for the calculation of Inor.
where θs and ϕs are the solar altitude and azimuth; θp and ϕp are the solar incidence angles of the pixel; θ′s and ϕ′s are the solar altitude and azimuth when the sun is in the northwest; i is the original incidence angle; I is the brightness of the original image. The basic principle is to use the image solar altitude and azimuth to calculate the brightness of the pixel of vertical incidence and then calculate the image brightness when the sun is in the northwest.
From the calculation of new intensity, it can be seen that it maintains both the brightness of the terrain as the hill-shading map and the spectral information of the remote sensing image. The spectral information of the flat areas with low reflectance is retained and the hill-shading is given an outstanding semblance of reality.
3. Experimental design and results analysis
3.1. Study area and data preprocessing
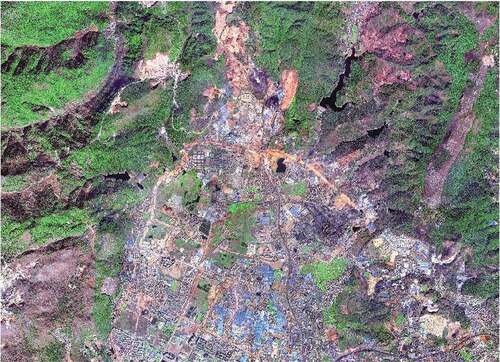
We begin by prescribing a model for image calculation and selecting the Dianchi Lake basin of Yunnan Province in China as the test area. The study area is located around Kunming, which is a city in Yunnan Province, southwest China. The range is from (23°14ʹ15”N, 105°41ʹ18”E) to (23°18ʹ03”N, 105°46ʹ35”E). The terrain is typified by a combination of mountains and plains. Its ups and downs are large, and the surface features are complex as well as broken. The whole district has an area of 61.8 km2 and the elevation is between 1864 m and 2415 m. The data are mainly from the ‘River Distribution Map for the Entry to the Dianchi Basin’ compiled by the Kunming Underground Pipeline Detection and Management Office. The image used in this study consists of the data generated by the fusion of the QuickBird multi-spectral image () and panchromatic image from March 2010. Its spatial resolution is 0.61 m, its solar elevation angle is 56.2°, and its azimuth is 137.2°. The DEM was produced from the 1:2000 scale full-field digital measured results of June 2009. The contour interval is 1 m, and the DEM raster data have a resolution of 1 m × 1 m.
Figure 1. The original QuickBird image
First, the 1:2000 digital terrain maps are used to produce the DEM data, and the images are resampled to 0.61 m (). The position of the northwest light source is obtained by keeping the solar altitude angle of the original image but increasing the azimuth by 180°. Then, the SRM for northwest illumination is extracted from the DEM (). Consequently, the SRM for the same lighting condition but the opposite orientation is obtained, and the corrected image has colours similar to those of the original image.
Figure 2. DEM after resampling
Figure 3. Illumination with the light source in Northwest
3.2. Experimental design
To illustrate the effectiveness of the proposed method in producing realistic hill-shading map, the following experiment was designed and compared with the existing methods. The purpose of the experiment is to examine the ability of this proposed method to produce a more realistic hill-shading map than other existing methods. We choose the lake basin area of Kunming as the experimental area, and use the DEM-based method, the DOM-based method and the method proposed in this paper to make the hill-shading map of the experimental area, and then use the following four indexes to evaluate the effect of geomorphological shading map: Correlation coefficient of the SRM for the northwest light source, Average difference of the band ratio (band 2/band 3) and the original image, Entropy, OIF.
The correlation coefficient of the generated map and the SRM for the northwest illumination source is to test the hill-shading effects of the different methods. A positive coefficient indicates that the illuminated surface and the shaded surface have the same direction as the SRM and the hill-shading effect is good.
The average difference of the image band ratios before and after the hill-shading process is used for measuring the extent to which the geographic spectral information is preserved. The image band ratio (Band 2/Band 3) is the spectral ratio between the two bands after the image processing. If the geographic spectral information remains the same, the ratio between the two bands will be unchanged. To some extent, the smaller the average difference in the image band ratio, the more that geographic spectral information will be retained.
Entropy is an important indicator for measuring the richness of information. The entropy and joint entropy for the images before and after the hill-shading method are often calculated to determine the amount of information. The greater the entropy, the more information the images contain and the better the image quality. According to the principle of Shannon information theory, the entropy of the 8-bit image x is given by
where x denotes the input image variables and Pi is the probability that an image pixel has a greyscale value of i. In addition, the amount of information can be measured by the concept of the optimum index factor (OIF) that was proposed by Chavez, Guptill, and Bowell (Citation1984). The mathematical expression is
where σi is the standard deviation of the ith band and Ri,j is the correlation coefficient of the ith band and jth band. This is used to select the data with high standard deviations and low correlation coefficients based on the statistical analysis. The greater the standard deviation, the greater the amount of information contained. Moreover, the smaller the correlation coefficient of the bands is, the stronger the independence of the surface image data and the smaller the redundancy of the information. Therefore, a greater OIF indicates that a greater amount of information is retained in the hill-shading.
3.3. Analysis of experiment results
3.3.1. The experiment results
In the case study, three methods, namely the DEM-based hill-shading method, the DOM-based method and the method fusing the processed terrain shading model (SRM) with the IHS colour system, are applied to conduct the experiment on the same region for comparative analysis. In the proposed method, according to our training test, the values of the parameters a and b were set to 0.62 and 0.38, respectively. , and show the experimental results of each method.
Figure 4. Map generated by the DEM-based hill-shading method
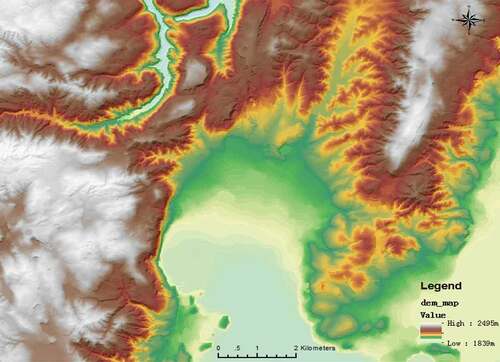
Figure 5. Map generated by the DOM-based method
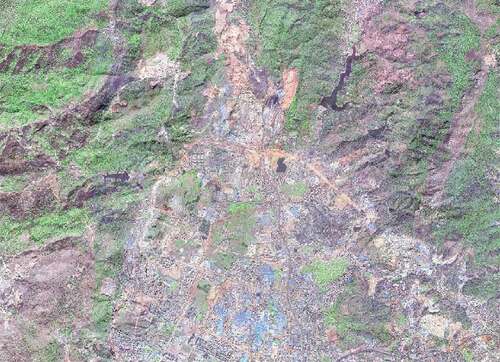
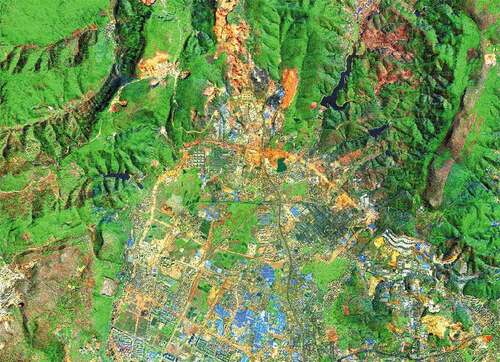
Figure 6. Map generated by the method of fusing SRM with IHS colour system
3.3.2. Comparative analysis of the visual effect
Compared with the original image (), the DEM-based hill-shading method, the DOM-based method and the proposed method in this article have provided the hill-shading effect of the landscape, that is, the ridge is protruding, the valley is concave, and the hypsometric tinting method describes the ups and downs of the terrain. However, the sense of three dimensions, the amount of information, and the visual effects are very different between the different hill-shadings.
The DEM-based hill-shading method () is based on the hypsometric DEM, which is capable of representing the changes in the landscape by differences in colours. This has the advantages of a good 3D effect, delicate texture, rich layers, strong contrast, and a good representation of the changes and details in the mapping area. However, the disadvantages are that lighting conditions are complicated to handle, colour adjustment is difficult, mistakes occur in the shady and sunny slopes, and the information represented is confined to a description of the landscape. The problem of the DOM-based () is that it cannot highlight the rolling nature of the terrain well and the effects of the presentation for the terrain is not good enough, which affects the expression of the map. The hill-shading method fusing the SRM with the IHS colour system () presented the following characteristics: the 3D effect of the hill-shading is strong; the resultant image and the original image have similar colours; the layers are rich; the texture is delicate; and the details of the landforms, topography, and ground objects are fully exhibited.
3.3.3. Comparative analysis of the spectral information
In this part, the above four evaluation indexes are calculated. As shown in , the correlation coefficient of the original image and the SRM is negative, indicating that the illuminated surface and the shaded surface of the original image are in the opposite direction from the SRM, generating an inverse-3D effect, while this index of the other three methods is positive, indicating that the illumination has the same direction and the hill-shading effect is good. The difference between the rendering method based on DEM and the method proposed in this paper is 0.02, and the effect is similar. The parameter of band ratio (band 2/band 3) and the average difference of the original image shows that the rendering method based on DEM and the method proposed in this paper are very close to 1, indicating that the rendering effect retains the relevant terrain information of the original data to the maximum extent, while the evaluation index value of the DOM-based method is only 0.63, indicating that the information after rendering is weakened. From the index of entropy, we can also see that the entropy of the rendering method based on DEM decreases slightly, while the entropy of the rendering method based on DOM and the method proposed in this paper increases, indicating that the fusion of remote sensing images can effectively increase the amount of information of mountain shadow map. Similarly, for the OIF index, the index value of the method proposed in this paper is 41.26, which is much higher than other methods, and further verify the effectiveness of the method proposed in this paper.
Table 1. Quantitative test parameters for hill-shading
Therefore, as shown in , the original image exhibits no relief-shading effect, the ups and downs of the terrain are not well represented, and the information content is low. Moreover, the traditional hill-shading image has less entropy than the original image, indicating that the amount of information is less because merely the ups and downs of the terrain and the hypsometric terrain information are reflected. The hill-shading image obtained by fusing the processed SRM with the IHS taking into account the topography, terrain, terrain factors, and other information, thus greatly integrating various information sources and producing the best hill-shading effect.
3.3.4. Effects in the engineering application
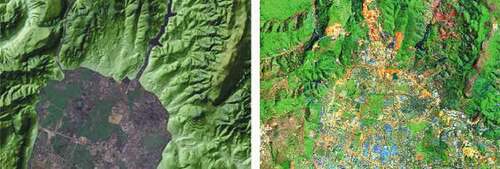
The method proposed in this study is also used in the project to map the Dianchi Lake basin. The project is meant to create a map of the central lake in the Dianchi Lake area by using a 4D data product. This map will be used for acquiring the distribution of the rivers that connect to the lakes within the district of Dianchi Lake. Because the mapping area of the Dianchi Lake district covers 3000 km2, the mapping data and GIS attribute data of the mapping area constitute a vast amount of data including the digital line model, the digital orthophoto model, and the digital elevation model of Kunming and the Dianchi Lake district. The results include a river distribution map that exploits the hill-shading as the background and a 3D aerial view image that portrays the whole district. The standard for the production of the hill-shading is strict: a vertical-view hill-shading map and a 3D hill-shading map are needed, and the requirements for mathematical accuracy and image resolution in the map products should be fulfilled concurrently. Therefore, the hill-shading production methods discussed in this paper are essential to the success of this map compilation. In this compilation project, 1:10,000 DEM data on the 3000 km2 range are combined with 0.6 m resolution QuickBird data, thus generating colourful thematic image maps with a good hill-shading effect that emphasizes the landforms and the distribution of spatial information. The objective hill-shading of the maps (, and ) has vivid colours and the geographic information is preserved, so the requirements for expressiveness and practicability are fulfilled by the maps.
Figure 7. The result of the hill-shading method using the fusion of DEM and DOM
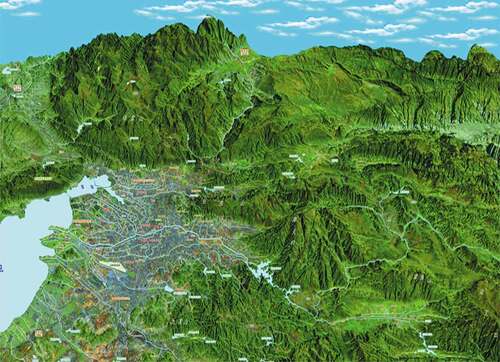
Figure 8. The result of the hill-shading method when compared with the traditional method
4. Discussions
This paper proposes a new method of fusing SRM and IHS to produce a hill-shading map. It is rarely taken in cartography and so this is a new attempt for methods of hill-shading map generation. It has been proved by our experiments that this method is capable of enriching the geographic information of the hill-shading and has the advantage of good artistry. In this method, a fusion of remote sensing images is used to produce the landform veneer, which is different from the traditional hill-shading methods. Because the traditional methods attempt to enhance the DEM effect, the main focus of the traditional methods is the colour, the light incidence model (Imhof Citation1965), the shading effect (Oguchi, Aoki, and Matsuta Citation2003), or the enhancement method for the terrain (Kennelly Citation2008). The methods above solve the artistic problem from the viewpoint of making a map and enhancing the ability of the hill-shading to reproduce the real world. However, none of these studies pay attention to the application of the DOM image of the mapping area in the production of a hill-shading map. That is why the hill-shading lacks the support of high-resolution map data, resulting in the lack of some important geographic information and geolocation capability. The new hill-shading method proposed in this paper mainly addresses the following issues: (1) the construction of the fusion model, and (2) its use for thematic map compilation.
The advantages of this method can be concluded as follows:
Aided by the realistic presentation of the terrain in the high-resolution image of the landscape, the SRM calculated from the DEM eliminates the differences in brightness caused by undulations in the terrain;
The radiance of each pixel is transformed into a reference plane to ensure the sense of reality and enhance the visual effect of the hill-shading map.
Panchromatic remote sensing images are replaced by the shadow file generated from the DEM, and the fusion method integrates the DOM and DEM data, which are used to produce the hill-shading directly;
The IHS model keeps the shadow of the terrain consistent with the original shadow in the remotely sensed images so as to avoid the abovementioned mismatch between the two images in the production of the vertical-view hill-shading maps, thus improving the fidelity of the result;
The hill-shading is enabled to present geographic information on different scales, and the effect is particularly evident in large-scale maps;
By using the satellite image data of the mapping area, the colour of the mapping area is somewhat consistent with the real world, thus avoiding the map distortion caused by improper hypsometric tinting.
The proposed method can be used for thematic map compilation. On the basis of the image fusion result, the terrain is highlighted, the reliability of the map colour is assured, the artistry of the map is retained to some extent, and overall the resultant image can be used as the background of thematic maps. The majority of the research on production methods for hill-shading has been carried out with respect to the elevation model (Wood Citation1999), lighting model, (Oguchi, Aoki, and Matsuta Citation2003), or colour model (Xie Citation2011, Citation2005). Therefore, this study corrects the shortcomings of the abovementioned work, not only in the appearance and visual expression but also in the method of expression for the geographic information. It focuses on the image processing technology for hill-shading production and how to convey important geographic information in the hill-shading result.
By fusing the SRM with IHS, the consistency of the hill-shading with the real world is enhanced, and by highlighting the effect of the terrain at the same time, the generated map is objective. The new hill-shading method shows that the ups and downs in the real world are preserved in the simulation, the integrity of the geographic information is maintained, and colours are enhanced to avoid distortion. This method enhances hill-shading maps of different scales and improves the 3D effect of the map display.
There are also some inadequate aspects of this method. First, because the DOM is overlaid with the DEM data in the production of the hill-shading, the capability of the DEM for artistic expression is confined to some extent. For instance, the DOM image data on the mapping area describes the natural landscape in a specific time period, such as summer or winter, so it can only reflect the colour of the mapping area in that specific season, whereas the traditional production method for hill-shading uses the DEM data freely by designing the colour system of the hypsometric tinting to display the same areas under different seasonal circumstances. We solve this problem by using the DOM data of different seasons and different areas in the integration with the raster data in order to reflect the landscape colours of different regions. Second, this study has revealed that because the DEM used for producing the hill-shading is fused with the image data, the colour brightness values of the DEM are reduced, thereby weakening the capacity for colour expression in the hill-shading. One solution is to adjust the H-value and I–value of the abovementioned image to enhance the image brightness in order to improve the colour expressiveness of the hill-shading. Another method is to artificially enhance the brightness and contrast of the integrated image map by means of the image-editing software, such as ERDAS or Photoshop, in order to improve the result.
5. Conclusions
Realistic hill-shading maps are important to both geomorphologists and cartographers. Many quantitative techniques for defining topographic features and representing images are available to both disciplines. This study analysed the production methods for hill-shading mapping and provided a new kind of production method for a hill-shading map that improved the results by directly combining remote sensing image data and DEM data. The details of the production process for hill-shading and its application to mapping engineering are demonstrated. By comparing the advantages and disadvantages with those of the extant method for the production of hill-shading, the method based on the fusion of the SRM and the DOM image emphasizes the status and role of geographic information in the production of hill-shading. It solves the problem of surface features that are difficult to attach well on the hill-shading body, provides the terrain in the map with a capability for geolocation, and improves the function of hill-shading in map compilation. The method also solves the problem of a bad hill-shading effect in a large-scale map, perfectly merges the hill-shading image into the surrounding data environment, and enhances the visualization capabilities of image-based thematic maps. The method is of special value for the compilation of future maps, especially image maps and atlases, so it is worth promoting.
The functional bottleneck in the performance of computer software and hardware is the main obstacle to the implementation of this method. For example, some GIS editing software like ERDAS10 does not accept image data that exceed 2 GB. While editing a large-scale dataset, the resolution of the veneer data is necessarily decreased and the mapping scale is affected. Another problem is that some of the professional GIS software like ArcGIS does not have a strong image processing function like Photoshop. Hence, this study had to be conducted with various GIS and image-editing software, which increased the cost of map compilation.
According to the analysis of the results of the method, the OIF and entropy of the generated map are 41.26 and 12.05, respectively, which are much greater than for the results of the traditional method. In other words, the proposed method can greatly enhance the terrain effect.
Acknowledgements
This work was supported by the Natural Science Foundation of China [Nos. 41771430, 41961064, 41631177,42061052], the Strategic Priority Research Program of the Chinese Academy of Sciences [No. XDA23100100], the Project of Innovative Talents Cultivation for Graduate Students of Yunnan University: Construction of Graduate Tutor Team [No. C176230200], the Joint Fund of Yunnan Provincial Science and Technology Department and Yunnan University [No. 2018FY001(−017), 2019FY003017], and by a grant of Open Science Foundation from State Key Laboratory of Resources and Environmental Information System, Chinese Academy of Sciences.
Disclosure statement
No potential conflict of interest was reported by the authors.
Additional information
Funding
References
- Aronoff, A. 2005. Remote Sensing for GIS Managers, 524 pp. Redlands: ESRI Press.
- Billingsley, G. H. 2000. “Geologic Map of the Grand Canyon 30ʹ×60ʹ Quadrangle, Coconino and Mohave Counties, Northwestern Arizona.” U.S. Geological Survey Geologic Investigations Series I-2688 Version 1.0. doi:https://doi.org/10.3133/i2688.
- Brewer, C. A. 2005. Designing Better Maps: A Guide for GIS Users. Redlands: ESRI Press.
- Brewer, C. A., and K. A. Marlow. 1993. “Computer Representation of Aspect and Slope Simultaneously.” Proceedings of the Eleventh International Symposium on Computer-Assisted Cartography (Auto-Carto-11), Minneapolis, Minnesota, 328–337.
- Buddeberg, J., B. Jenny, and W. Willett. 2017. “Interactive Shearing for Terrain Visualization: An Expert Study.” Geoinformatica 21 (3): 643–665. doi:https://doi.org/10.1007/s10707-016-0283-9.
- Chavez, P. S., S. C. Guptill, and J. A. Bowell. 1984. “Image Processing Techniques for Thematic Mapper Data.” Proc. ASPRS-ACSM Tech. Paper 2: 728–742.
- Çöltekin, A., and J. Biland. 2019. “Comparing the Terrain Reversal Effect in Satellite Images and in Shaded Relief Maps: An Examination of the Effects of Color and Texture on 3D Shape Perception from Shading.” International Journal of Digital Earth 12 (4): 442–459. doi:https://doi.org/10.1080/17538947.2018.1447030.
- Dang, A. 2005. Processing Methods for Remote Sensing Images in ERDAS IMAGE, 107–108. Beijing: Tsinghua University Publishing House.
- El-Sheimy, N., C. Valeo, and A. Habib. 2005. Digital Terrain Modeling: Acquisition, Manipulation and Applications, 270 pp. Boston: Artech House Publishers.
- Gil, M. L., M. Arza, J. Ortiz, and A. Ávila. 2014. “DEM Shading Method for the Correction of Pseudoscopic Effect on Multi-platform Satellite Imagery.” GIScience & Remote Sensing 51 (6): 630–643. doi:https://doi.org/10.1080/15481603.2014.988433.
- Goodchild, M. F. 2018. “Reimagining the History of GIS.” Annals of GIS 24 (1): 1–8. doi:https://doi.org/10.1080/19475683.2018.1424737.
- Guan, Z., S. Huang, and J. Rong. 2017. “Experimental Analysis of the Geomorphic Hill Shading Map Production Based on ArcGIS.” Journal of Geomatics 42: 101–103. doi:https://doi.org/10.14188/j.2095-6045.2017.02.024.
- Imhof, E. 1965. Kartographische Geländedarstellung, 425 pp. Berlin: Walter de Gruyter. English translation published as Imhof, E., 1982. Steward, H.J., (Ed.), Cartographic Relief Representation, 389 pp. New York: Walter de Gruyter .
- Kennelly, P., and A. J. Kimerling. 2001. “Modifications of Tanaka’s Illuminated Contour Method.” Cartography and Geographic Information Science 28 (2): 111–123. doi:https://doi.org/10.1559/152304001782173709.
- Kennelly, P., and A. J. Kimerling. 2004. “Hill Shading of Terrain Using Layer Tints with Aspect Variant Luminosity.” Cartography and Geographic Information Science 31 (2): 67–77. doi:https://doi.org/10.1559/1523040041649416.
- Kennelly, P., and J. Stewart. 2006. “A Uniform Sky Model to Enhance Shading of Terrain and Urban Elevation Models.” Cartography and Geographic Information Science 33 (1): 21–36. doi:https://doi.org/10.1559/152304006777323118.
- Kennelly, P. J. 2008. “Terrain Maps Displaying Hill-shading with Curvature.” Geomorphology 102 (3–4): 567–577. doi:https://doi.org/10.1016/j.geomorph.2008.05.046.
- Li, J., Y. Zhou, and D. Li. 1999. “Transform for High-resolution Panchromatic and Multi-spectral Image Fusion.” Journal of Remote Sensing 3 (2): 116–121.
- Li, X. D., and Q. Y. Du. 2004. “Research on the Hill-shading Expression Method Based on Stereo Vision.” Geospatial Information 2 (4): 27–29.
- Lillesand, T. M., R. W. Kiefer, and J. W. Chipman. 2004. Remote Sensing and Image Interpretation, 763 pp. New York: John Wiley & Sons.
- Maguire, D. J., M. F. Goodchild, and D. W. Rhind. 1991. “An Overview and Definition of GIS.” In D. J. Maguire, M. F. Goodchild and D. W. Rhind, Eds., Geographical Information Systems: Principles and Applications, pp. 9–20. Vol. 1. London: Longman Scientific & Technical.
- Mark, R., 1992. A Multidirectional, Oblique-weighted, Shaded-relief Image of the Island of Hawaii. U.S. Geological Survey Open-File Report 92–422, 3 pp. http://wrgis.wr.usgs.gov/open-file/of92-422/of92-422.pdf
- McCullagh, M. J. 1998. “Quality, Use and Visualisation in Terrain Modeling.” In Landform Monitoring, Modeling and Analysis, edited by S. N. Lane, K. S. Richards, and J. H. Chandler, 95–117. Chichester: John Wiley & Sons.
- Oguchi, T., T. Aoki, and N. Matsuta. 2003. “Identification of an Active Fault in the Japanese Alps from DEM-based Hill Shading.” Computers & Geosciences 29 (7): 885–891. doi:https://doi.org/10.1016/S0098-3004(03)00083-9.
- Qi, M., B.-F. Zhu, and D. McAllister. 2015. “A Method to Estimate the Light Source of A Hill-Shading Map and Recover the Terrain Height.” Proceedings of 2015 International Conference on Simulation,Modelling and Mathematical Statistics, Chiang Mai, Thailand (SMMS 2015).
- Robinson, A. H., J. L. Morrison, P. C. Muehrcke, et al. 1995. Elements of Cartography. 6th ed., 688 pp. New York: John Wiley & Sons.
- Schetselaar, E. M. 1998. “Fusion by the IHS Transform: Should We Use Cylindrical or Spherical Coordinates?” International Journal of Remote Sensing 19 (4): 759–765. doi:https://doi.org/10.1080/014311698215982.
- Slocum, T., R. McMaster, and F. Kessler. 2004. Thematic Cartography and Geographic Visualization, 528 pp. 2nd ed. Upper Saddle River: Pearson Prentice-Hall.
- Sun, J., J. Liu, and J. Li. 1998. “Multi-source Remote Sensing Image Fusion.” Journal of Remote Sensing 2 (1): 47–50.
- Wang, C., Z. Zhang, D. Tang, and J. Yang. 2018. “Topographical Hill Shading Map Production Based Tianditu (Map World).” ISPRS - International Archives of the Photogrammetry, Remote Sensing and Spatial Information Sciences. XLII-3. 1681–1684. 10.5194/isprs- archives-XLII-3-1681–2018.
- Wilson, J. P., and J. C. Gallant. 2000. “Digital Terrain Analysis.” In Terrain Analysis: Principles and Applications, edited by J. P. Wilson and J. C. Gallant, 1–27. New York: John Wiley & Sons.
- Wood, J. D., 1999. “Visualisation of Scale Dependencies in Surface Models.” International Cartographic Association Annual Conference, Session 37-B, Ottawa, Canada, presentation. http://www.soi.city.ac.uk/~jwo/ica99/.
- Xie, Z. Q. 2005. “Construction of Digital Elevation Model Based on GIS and RS Technology in Huge Amounts of Data.” Journal of Urban Surveying 1: 20–23.
- Xie, Z. Q. 2011. “A Mountain River System Map Compilation Based on the Fusion of DEM and DOM.” Surveying and Mapping Science 36 (1): 207–209.