
 ?Mathematical formulae have been encoded as MathML and are displayed in this HTML version using MathJax in order to improve their display. Uncheck the box to turn MathJax off. This feature requires Javascript. Click on a formula to zoom.
ABSTRACT
This paper analyzes and discusses the potential and limits of using Facebook data to analyse spatial-temporal urban rhythms and city centrality through the availability of services and retail. During September 2020, we harvested Facebook Places data using Graph API for our pilot area consisting in the city of Brno. Specifically, we focused on the spatial distribution of ‘Food & Beverage’, ‘Shopping & Retail’ and ‘Medical & Health’ categories, and their associated opening hours. The paper provides a detailed description of data collection and post-processing among possible analysis methods and visualizations presented in the context of our case study. The study focuses on inter-urban structures and urban rhythms through the analysis of opening hours of retail and services. We also discuss the benefits and potential problems associated with the use of these data.
1. Introduction
The topic of using location-based network data is currently very popular and widespread among a whole spectrum of scientific disciplines. Social networks are a powerful source of interesting geographic data. However, their use is significantly linked to sufficient use of the network in the studied locality and also to the conditions under which the data are available for download and use.
Facebook was considered a location-based network later than its competitors such as Google, Foursquare and Twitter (Wilken Citation2014). However, since the launch of Facebook Places in 2010 and Facebook Nearby in 2011, the importance of Facebook in the location-based networks market has grown rapidly. In addition to the considerable popularity of Facebook among users, it is also becoming an attractive platform for businesses as they can more efficiently and effectively reach their potential customers. Since Facebook tries to carefully protect the privacy of its users, there is not much room left to analyse this kind of data. Nevertheless, apart from the private content that users share in messages or on their walls, there is also a large amount of non-private information, such as public Facebook pages accessible through the Facebook Graph API.
Data taken from the location-based social networks have found use in various situations. Considering social geography, they provide new opportunities for analysing urban rhythms and structures, including city centrality (Bawa-Cavia Citation2011).
This paper provides a detailed description of data collection using Facebook Graph API and further processing in the Geographic Information System (GIS). In our pilot study, we present possible methods of spatial-temporal analysis and data visualization. We harvested Facebook Places data for the area comprising the city of Brno in the Czech Republic. Alongside geographical position (spatial component), place category and name, we also obtained the opening hours (temporal component) of the places. Further, we focused on the subcategories ‘Food & Beverage’, ‘Shopping & Retail’ and ‘Medical & Health’ and analysed their spatial and temporal distribution in the context of predefined city regions. Finally, we evaluate the benefits, limitations, and further potential of Facebook Places data for social geography.
The main objective of this paper is to demonstrate the possibility of using data from social networks such as Facebook concerning the background of social geography concepts. Attention is paid especially to the extraction of spatial data, which are subsequently used for analyses focused on the temporal characteristics (time curves) and intra-urban structures. Results of these analyses are crucial for interpreting the dynamics of post-industrial cities.
1.1 Related work
A wide range of more or less recent processes such as economic globalization, development of telecommunications and changes in transport systems has led authors to re-think the urban environment and its spatial formation. The pressure exerted by these processes has disturbed the traditional centripetal and centrifugal relations, which in the past formed structures of industrial cities. The original circular conception of the city based on an idealized pattern of cities had lost its explanatory power. In other words, cities are becoming more and more complex, and thereby it is difficult to achieve understanding using traditional approaches which has historically relied on economic functions or functions that accentuate higher degrees of specialization and diversity (e.g. Burgess’ model applied to Chicago, Robson’s Model applied to Sunderland and others (Knox and Pinch Citation2010)). On the other hand, this does not mean that economic functions (retail, services, etc.) will cease to be an indicator of the spatial formation of cities and intra-urban structures. In principle, they represent its dominant components.
The need to capture the dynamics of contemporary cities has led to abandoning previously constructed static models. Works that noticed (daily, weekly) rhythms became inspiring for urban geographers. Rhythms are mainly based on the works of Zerubavel (Zerubavel Citation1981) and especially Lefebvre (Lefebvre Citation2004), who also paid more attention to urban context – urban rhythms. These are widely described by Mareggi (Mareggi Citation2013). Nevertheless, capturing the constantly changing socio-spatial differentiation of urban population in time still remains a challenging task (Nemeškal, Ouředníček, and Pospíšilová Citation2020; Mulíček, Osman, and Seidenglanz Citation2015). In this paper, we focus primarily on the intra-urban scale (administrative unit) of the city, which has been partially pushed back in the city centrality debate compared to studies related to the overall assessment of polycentricity of metropolitan areas or even larger settlement systems (Cladera, Marmolejo Duarte, and Urban Structure Citation2009; Functional Polycentricity: Citation2012). In academia, intra-urban space debates are more theoretical compared to the discourse on polycentricity, which is aimed more at currently existing formations utilizing available datasets (e.g. commuting, population size and economic specialization). However, in recent years the availability of new data has encouraged interest in the analysis of intra-urban spaces.
Other researchers have found that data taken from location-based social networks, cell phones (localization data) and other sources provide a new opportunity for analysis (Martí, Serrano-Estrada, and Social Citation2019). In contrast to more conventional use cases, i.e. to refine population distribution models (Kubíček et al. Citation2019; Ali Haidery et al. Citation2020) and human mobility (Hawelka et al. Citation2014; Nemeškal, Ouředníček, and Pospíšilová Citation2020), Boy and Uitermark (Boy and Uitermark Citation2017) focused on the image of the city presented through Instagram. Authors were able to analyse places with different concentrations of people (posts) in the intra-urban space of Amsterdam. Based on geotags, they conclude (p. 619) that ‘the urban imagination promoted by Instagram sees the city as a collection of “hot spots”’. Except for often geotagged places, they also focused on the various groups of people who notify their presence at a certain time. Some places, such as clubs or lounges, become ‘central’ in the late evening. In the sense of urban space, they conclude the following (p. 622): ‘The ideals that are cultivated and visualized on Instagram and the uneven relationships that are constructed also implicate the city: some places are elevated and feature centre stage, while others remain peripheral or areal together ignored.’ Similarly, the presence was analysed by Bawa-Cavia (Bawa-Cavia Citation2011), who, however, relied on data from another social network, namely from Foursquare. Bawa-Cavia (Bawa-Cavia Citation2011) analysed information from the social network in the cities of Paris, New York and London, where he also focused directly on the expression of polycentricity. Although each of the cities has its own imprint, the results are not entirely clear and rather show certain tendencies (decentralization processes in Paris, spatially concentrated activities in New York, etc.). Su et al., (Su, Spierings, Dijst and Tong, Citation2020) Rizwan and Wan (Rizwan and Wan Citation2018) analysed location-based network data from Chinese microblog Sina Weibo. Khan et al. (Khan, Wan, and Yu Citation2020a) examined the association between time, frequency of check-ins and land use categories based on users’ check-in behaviour and the city’s characteristics and behaviour of tourists and residents. They found that aggregation of activities and their temporal regularity differs between visitors and local inhabitants and also between different kinds of land use categories. Rizwan and Wan (Rizwan and Wan Citation2018) identified gender-based differences, with women being more inclined towards using social media, differences were also observed in check-in behaviour during weekdays and weekends.
Palumbo et al. (Palumbo, Thompson, and Thakur Citation2019) developed a graph database for the integration of POIs (Point of Interest) from various sources (including Wikimapia, OpenStreetMap, Foursquare and also Facebook) for potential in land use mapping and population modelling.
However, to the best of our knowledge, we are not aware of any similar research focusing on an analysis of intra-urban spaces using Facebook data. We focused on the application of this social network in studies within the Web of Science databases, and we found a similar number of papers as Owuor and Hochmair (Owuor and Hochmair Citation2020). However, most of these papers mentioned Facebook only in the abstract or literature review part. The practical parts of the papers then often worked with data from Twitter. Although Owuor and Hochmair (Owuor and Hochmair Citation2020) claim that Facebook is often used in studies, this statement is related to the fact that the term ‘Facebook’ was searched within the field ‘Topic’ in WoS.
1.2 Social networks and retail and services
According to the latest statistics, global internet penetration has reached 59% of the world population, while social networks are actively used by more than 3.8 billion people (Clement Citation2020a). Better accessibility of technologies and development of mobile devices contributed to the increasing number of daily active users of social networks. Social media data is a rich source of information for many research areas including psychology, sociology, political science, business and disaster management.
When researching social networks, it is necessary to consider the fact that there is no uniform demographic stratification of age groups among users (Mellon and Twitter Citation2017; Mulíček and Stachoň Citation2019). In the Czech Republic, social networks are used more by the younger population (96% of people aged 16–24 years compared to 9% of people aged 65+). However, the average age of social network users has been increasing in recent years. In 2019, 54% of Czech residents were users of social networks (CZSO Citation2020a).
Social media users include not only individuals but also businesses. According to Czech Statistical Office (CZSO Citation2019), in 2019, 45% of companies were using traditional social networks (e.g. Facebook, LinkedIn), compared to 18.4% using multimedia networks (YouTube, Instagram) and 8.7% of all companies using microblogging websites (Twitter). During the previous five years, the number of companies using social networks has almost tripled. Social media platforms enable the creation of virtual customer environments (Culnan, McHugh, and Zubillaga Citation2010). The aim of company promotion on social networks is building a relationship with their customers, providing support, or sharing relevant information. This also enables businesses to get feedback on their products and services in a relatively convenient, interactive way. Effective communication can also improve customer support and can be a source of competitive advantage for companies.
The business promotion activity is mostly linked to the content of Facebook pages. If a Facebook page has been assigned any geographical location, we talk about a Facebook Place. The advantage of setting a location of a place is that the business is visible through Facebook Search (in case of a location-based query). Users can check-in at that place and also include a photo, a text post and tag a friend. Check-ins help local businesses to increase visibility on Facebook and make it easier for new customers to find them.
1.3 Social networks data
The content of social networks is created simply by engaging in social networking and sharing ideas (e.g. in the form of a Facebook status, tweets on Twitter, YouTube videos, photos on YouTube, Instagram). By contributing to the content of social networks, users provide voluntary information often containing spatial reference. Geographical information shared through social networks is essentially a by-product and its creation has never been the primary objective of creators and users of these networks (Fukanová Citation2016). The resulting spatial data is based on a similar principle as voluntary geographic information (VGI) (Goodchild Citation2007). However, it is created passively as a user’s ability to add geographic information to their posts and contributions. Therefore, spatial information created on social networks is differentiated and referred to as ambient geospatial information (AGI) (Stefanidis, Crooks, and Radzikowski Citation2013).
The content of social networks, availability and the opportunities it provides for data analysis are dependent on the specific social network. There are several types of social networks based on their purpose, which includes photo sharing, video sharing, gaming, reunion networks, blogging, business, lifestyle and general purposes (Owuor and Hochmair Citation2020). The overall popularity and usage of social networks differ between countries as a result of their purpose, as well as accessibility, legal regulations and social awareness. The most popular social networks worldwide, according to the number of users, are listed in . Facebook has the largest user base with over 2.6 billion users (Kemp Citation2020), with the majority belonging to the age group of the economically active population (Clement Citation2020b).
Figure 1. Number of users of popular social networks (Kemp Citation2020).
Based on the social network used, the data harvested for further analysis can differ. For example, Twitter is a popular social network for research purposes because all data on Twitter are publicly available without restrictions. However, in most countries the amount of Twitter users is not large enough to be taken as a representative sample (Clement Citation2020b). It is also important to mention that only a small percentage of Twitter users have activated the geocode function when publishing ‘tweets’ (Sloan Citation2017). It was also established that Facebook provides a much higher level of customer engagement than Twitter, Instagram, and YouTube and is the most interactive social media platform for destination marketing organizations (Uşaklı, Koç, and Sönmez Citation2019).
Consequently, in the case of social media data, the data from Facebook Pages may be considered a representative sample in some cases. For example, regarding POI, Kysela et al. (Kysela, Horálek, and Holík Citation2015) discovered that in the case of large Czech cities, the coverage of guest facilities on Facebook might be around 80%. Since his research was carried out in 2015, we could assume that the percentage is even higher nowadays.
2. Materials and methods
2.1 Study area
The practical part of the research was conducted in the city of Brno, located in the South Moravian region in the Czech Republic. Since Brno is the second-largest city in the Czech Republic with around 380,000 inhabitants, we assume that it is large enough to obtain a representative sample of Facebook Places data. Since the 1990s, Brno has developed a diversified urban economy while the total retail area increased rapidly following the end of the Communist era (Mulíček and Osman Citation2018). Brno has a historical city centre where a large number of shops and restaurants are situated.
The historical (pre-industrial) core of Brno, originally based on the medieval city layout, has been the most important element of the spatial formation of the city. This inherited formation was further strengthened by the Communist regime, which was generally more inclined to centralization. This was especially reflected in retail distribution, as Mulíček (Mulíček Citation2010) described. Before 1989, for example, about 30% of all retail sales were concentrated in the historical city centre. However, this situation would be difficult to sustain for a longer period of time. At the beginning of 1990, the saturation of places with significant deficits of services began, including large shopping malls. Nevertheless, this transformation, which is often understood as one of the signs of transition to a post-industrial city, could hardly be considered completed. Thus, several large shopping centres located on the outskirts of Brno, represent an opportunity to analyse the concentration of retail and services.
The retail network in Brno city is monitored by quasi-regular municipal retail surveys, the last of which took place in 2017. The latter survey takes into account both retail establishments and services in the entire administrative area of the municipality of Brno. Field surveyors manually update the previous survey database as they pass through the city (Altimapo Citation2017). According to the offered assortment or type of service, the collected data are divided into more than 130 categories, such as groceries, drugstores, clothes shop, pubs, wellness and many others. Each store (service) has a record in the database with several attributes, including exact location, floor space, and opening hours. The public version of this dataset (KAM Citation2020) does not contain all attributes (e.g. information about opening hours). Thanks to the established methodology, this dataset was chosen for evaluating the reliability of our collected Facebook Places dataset.
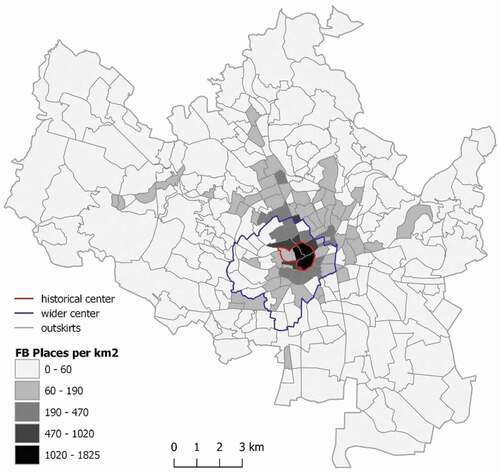
For our analysis, we divided the city of Brno into three areas (see ) based on centrality using official administrative division. We defined the historical centre of the city (corresponding to the cadastral unit ‘Město Brno’) and the wider city centre (equal to the administrative district ‘Brno-střed’ but excluding the historical centre); the rest of the city was defined as outskirts.
2.2 Facebook graph API
Since our study uses data from Facebook Pages, the following chapters describe in some detail the possibilities of harvesting data through Facebook API, licencing and data format.
Facebook data is stored in a so-called social graph, where users, pages, photos and comments present nodes; relations between these objects are presented by edges while characteristics and object attributes are stored in fields (Graph Citation2020). Facebook offers a secure HTTP-based API to access data from the social graph. This is called the Graph API, and it allows to query data, create and publish posts, manage ads and perform additional tasks (Graph Citation2020).
Personal data such as information from personal profiles, posts, pictures cannot be accessed without a specific permission from each user. Regarding public places, a Places Search API for Web was operating publicly until November 2020 (Places Search API for Web Citation2021). It enabled access to information about places that are represented as Place Information nodes in the Graph API. By 2021, Pages Search API is recommended as an alternative (Places Search API for Web Citation2021). Each user can access operating Facebook APIs via a unique access token that can be freely generated when registering as a Facebook developer. However, this access is limited. Users can execute up to 500 requests per day (The Places Graph FAQ Citation2020). Consequently, in the case of a large area with a high amount of data, it is impossible to obtain all the data at once.
The Graph API can be queried directly from the internet browser or through any language with an HTTP library. The response from the HTTP request is provided in a JSON notation. In the case of location-based Places Search API (or Pages Search API) requests, the JSON file does not always contain all Facebook Places in the specified area. When the area contains more than twenty Facebook Places, the JSON file includes another object with a link to the next API request.
Apart from a single-user access to the Graph API, Facebook also provides different APIs and developer tools to create custom applications using the social graph data. However, technologies using this kind of data must respect the privacy restrictions of the Facebook platform (Facebook Platform Policy Citation2020). Official Facebook Data Policy (Facebook: Data Policy Citation2020) prevents anyone from collecting private data from user profiles, photos, private events and messages. However, some publicly available data, such as page information, can be freely collected and used.
2.3 Data processing & analysis
As indicated above, we selected Facebook Places (Facebook pages with a defined geographical location) as a data source which is public and (in time of data collection) was accessible using Facebook Places Search API. The whole data collecting and processing process consisted of multiple steps as illustrated in .
Figure 2. Data collection, processing and analysis process.
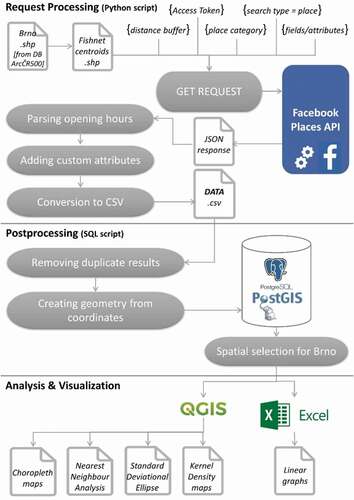
Figure 3. Spatial distribution of collected ‘Food & Beverage’, ‘Shopping & Retail’ and ‘Medical & Health’ Facebook Places related to the area of basic settlement units in Brno.
Because of the API limits number of requests, it was not possible to collect data for our specified area at once. To overcome these limits and automate the process of creating multiple GET requests and saving the results, a Python script was written, which harvested the data for two weeks in September 2020. To make the harvesting process more effective, we created a regular point grid (QGIS tool ‘Create grid’) covering the whole city cadastral area and processed the GET request for each of these points separately. Due to overlapping circular search areas, duplicate results had to be additionally removed based on ID and download timestamp (we only kept the newest results).
The data harvesting was carried out using multiple GET requests through the HTTPS application protocol. Each Place Information GET request is composed of various parameters (Places Search API for Web Citation2021). Mandatory parameters include a WWW link to API, type of search (place, for instance), searched categories, centre point of searched area (latitude and longitude in geographical coordinates), distance (search radius in metres) and requested fields (attributes divided by comma, for example name and hours). This indicates that the browsed area is always circular. An example GET request string can be as follows:
https://graph.facebook.com/v3.0/search?type=place&categories=[‘FOOD_BEVERAGE’]¢er=49.1938264,16.6141061&distance=500&fields=location,id,hours,name,is_permanently_closed,is_always_open&access_token=XXXXXXXXXXXXXXXXXXXXXXXXXXXXFor each category of Facebook Places (Places Search API for Web Citation2021), we obtained all objects in the area of Brno. For each of those objects, we targeted several attributes (name, location, is_permanently_closed, is_always_open, hours) (Graph API: Place Information Citation2020). For each Facebook Place, we also added custom attributes – download timestamp and the general category of a place that is not natively contained in the JSON object and, therefore, must be added according to the category used in the query. The name attribute corresponds to the name of the Facebook Page. Attributes is_permanently_closed and is_always_open state if the place is closed down or permanently open; both attributes hold a Boolean (true/false) value (Graph API: Place Information Citation2020). For places that have one of those two attributes filled in, it is not possible to enter opening hours. The location attribute includes a city name, country, latitude, longitude, street and zip code (Graph API: Place Information Citation2020). The following is an example of a location object:
‘location’: { ”city”: ‘Brno’, ”country”: ‘Czech Republic’, ”latitude”: 49.19402, ”longitude”: 16.61301, ”street”: ‘Novobranská 80/10’, ”zip”: ‘602 00’ }The hours attribute is stored as a list, including up to 28 objects (Graph API: Place Information Citation2020). Each object includes two pairs. The first one is named ‘key’, and its value is an event composed as a day of the week, order (two is maximum) and open or close identifier. The second pair is named ‘value’ and its value corresponds to a time of the key event. For each day of the week, there can be zero, two or the maximum of four objects (e.g. mon_1_open, mon_1_close, mon_2_open and mon_2_close for Mondays) referring to an opening or closing time. For example:
‘hours’: { ”key”: ‘mon_1_open’, ”value”: ‘10:00’ }, { ”key”: ‘mon_1_close’, ”value”: ‘20:00’ }, { ”key”: ‘tue_1_open’, ”value”: ‘10:00’ }, { ”key”: ‘tue_1_close’, ”value”: ‘20:00’ }Since this way of storing opening hours data is too complicated for further analysis, we parsed the content of hours attribute to new columns for each of the possible pairs (28 columns in total). The processing of opening hours was also a part of the Python script. Conversion from the JSON file to CSV was also included.
The resulting CSV file with all harvested Facebook Places was imported into PostgreSQL 10.11 database with PostGIS extension. For spatial analysis, we added a vector layer of basic settlement units as defined by Act No. 89/1995 Coll., on the State Statistical Service, which is a part of the Register of Territorial Identification, Addresses and Real Estate. The vector layer of basic settlement units was then joined with demographic data, specifically the number of habitual residents for each basic settlement unit (CZSO Citation2020b). PostgreSQL was also used in combination with QGIS 3.4 to retrieve open places at each hour of the day. This resulting data was used in the following analysis.
Altogether, we collected over 6,800 Facebook Places located in the city of Brno. On average, around 54% of them had filled in opening hours; more than 12% stated they were always open. Other indicators are shown in .
Table 1. Basic descriptive statistic for collected Facebook places in the city of Brno
Firstly, we focused on the general spatial distribution of obtained Facebook Places in the city of Brno. We created a choropleth map (see ) that illustrates the density of Facebook Places in Brno in basic settlement units. The majority of selected Facebook Places are naturally located in the city centre and the surrounding settlement units. Solitary occurrences of higher density correspond to the location of larger shopping centres on the outskirts.
Overall, there were eight categories of Facebook Places available in the time of data collection (Places Search API for Web Citation2021). In the analysis, we focused exclusively on three place categories – ‘Food & Beverage’ (‘F&B’), ‘Shopping & Retail’ (‘S&H’), and ‘Medical & Health’ (‘M&H’) – because their opening hours fill rate exceeded 50%. ‘F&B’ category includes restaurants, bars, cafés, fast food restaurants and others. Category ‘S&H’ contains many retail companies, for example, clothing stores, cosmetics and sporting goods stores. Most common places in the ‘M&H’ category are drugstores, hospitals, medical centres, doctors and dentists.
We analysed the data from both the spatial and temporal perspectives. Wednesday was chosen as a representative day for the temporal analysis as it is not influenced by specific spatial-temporal variations in urban rhythms occurring on the weekends and Mondays. Only 1.5% of selected Facebook Places had not provided the opening hours for Wednesday, despite having filled them in for different days of the week.
The descriptive data analysis was conducted using Microsoft Excel v. 2016. All map outputs were created in QGIS 3.4, which enables native connection to the PostgreSQL database. For the choropleth maps, we used rounded Jenks Natural breaks data classification (Jenks Citation1967). Using a series of maps in a 30-minute interval we analysed the spatial distribution of currently open places throughout the day. Maps were generated using a custom Python script, using the QGIS functionality. Time series Kernel Density layers were constructed using a 100 m radius. For the visualization, we used a diverging colour scheme with a maximum value corresponding to 10 and more places. Consequently, the geo-visualization highlights the differences in places with more diffused Facebook places and blurs the difference between places with dense occurrences. For each map (every 30 minutes) containing at least two places, the Nearest Neighbour Index was calculated. The p-value had to be calculated using the SciPy library (Virtanen et al. Citation2020), as it is not included in the standard QGIS Nearest Neighbour Analysis output (QGis Documentation v: 3.10: 7.4.4 Citation2020). All Kernel Density maps containing at least three places were also supplemented by Standard Deviational Ellipses (SDE), covering approximately 68% (one time the standard deviation) of the currently open Facebook Places. Ellipses were calculated using a QGIS plugin (Tveite Citation2020). To compare the collected data with the reference dataset, we used the aggregation of point data into the fishnet (a standardized Brno urban grid (Data.Brno. Brno Urban Grid), which were subsequently used to calculate the normalized difference index according to the formula below. Normalization by summary value is suitable in case we need to remove biases and misleading messages that are found in differences between the enumeration units (University Consortium for Geographic Information Science: Geographic Information Science & Technology, Body of Knowledge Citation2021).
where:
Places identified in the 2017 municipality retail survey dataset for the given grid cell,
Facebook Places collected in September 2020 for the given grid cell.
3. Results
3.1 Temporal analysis of opening hours
Firstly, we compared the proportion of open Facebook Places during Wednesdays for three previously mentioned categories (‘M&H’, ‘S&R’ and ‘F&B’), as shown in . We found that the opening time for ‘F&B’ places stretches widely between 7 to 11 AM. Almost 90% of restaurants (and food/drink shops) are open between 4 to 6 PM. After that time, there is a slight decrease in the number of open places until night. Regarding ‘S&R’ places, the distribution is different, with almost no places open before 6 AM and very few open before 8 AM. A total of 41% of places open at 9 AM, but less than 30% of places remain open after 6 PM. The ‘M&H’ places have a similar distribution to the ‘S&R’ category, except they start opening about an hour earlier. Overall, demonstrates considerable differences between opening hours for different categories of services.
Figure 4. Comparison of the proportion of Facebook Places open on Wednesdays for different place categories.
Next, we analysed the differences between opening and closing hours on Wednesdays for the chosen categories. shows the proportion of places opening in each hour. More than 65% of places from the ‘M&H’ category open between 6 AM to 8 AM and close between 6 and 7 PM. Almost half of the places from the ‘S&R’ category open between 8 AM to 9 AM, and almost 40% of them close between 5 PM to 6 PM. Opening and closing hours of places from the ‘F&B’ category are more widely dispersed throughout the day. The chart shows two waves of opening, with the first beginning at 5 AM and the second in the afternoon. Approximately 50% of these places close between 10 PM and midnight.
Figure 5. Comparison of the opening and closing hours on Wednesdays for different place categories.
3.2 Spatial-temporal analysis of opening hours
We also combined both the spatial and temporal aspects of the distribution of Facebook Places in Brno. Firstly, we focused solely on the difference of the proportion of open Facebook Places between the historical centre, wider city centre and the outskirts on Wednesdays for different place categories (see ., ., .).
Next, we used a time series of Kernel Density maps to demonstrate the spatial-temporal dynamics of Facebook Places in Brno for different place categories. Each map was supplemented with the Nearest Neighbour Analysis and Standard Deviational Ellipse. The summary of the index values and corresponding p-values is attached in the table in Supplementary materials. A dynamic animation of these time series is available on YouTube for each of the analysed categories, in the paper further referenced as supplementary materials: https://youtu.be/kLK9epKJwZY (Video S1 – ‘F&B’), https://youtu.be/7gtCbbVnHXk (Video S2 – ‘S&R’), https://youtu.be/EXmf8I6axHo (Video S3 – ‘M&H’). For specific hours, the resulting maps are also presented as figures in this paper.
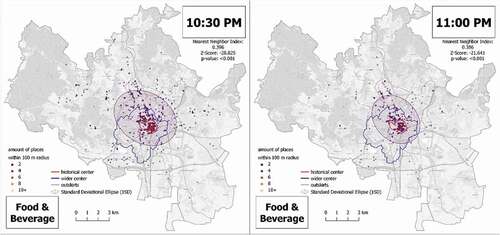
and show that more ‘F&B’ places are open in central parts of the city in the morning. Since 11 AM, the SDE stretches slightly more towards the north-west, the mean centre is located in the northern part of the wider centre. The eccentricity and radius stay relatively stable until 9:30 PM. In the course of the late evening, the SDE is shrinking, and the open ‘F&B’ places are becoming more concentrated in the historical centre, see Video S1 in supplementary materials. The biggest change was registered between 10:30 PM and 11 PM, see . The nearest neighbour analysis revealed a significantly clustered distribution of open places throughout the whole day, with exception in the early morning between 2 AM to 6:30 AM, see Table S1 in supplementary materials.
Figure 6. A comparison of the proportion of ‘Food & Beverage’ places open on Wednesdays for the historical centre, wider centre and the outskirts.
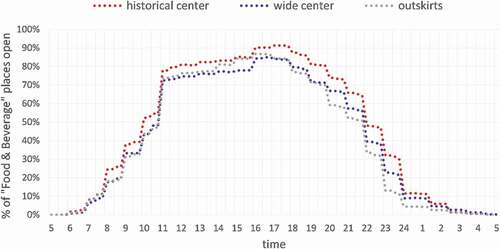
Figure 7. Spatial-temporal distribution of open ‘Food & Beverage’ places in Brno on Wednesdays, comparison between 10:30 and 11:00 AM.
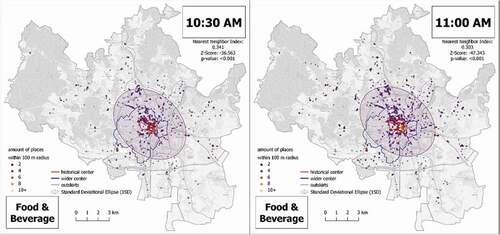
Figure 8. Spatial-temporal distribution of open ‘Food & Beverage’ places in Brno on Wednesdays, comparison between 10:30 and 11:00 PM.
In comparison to ‘F&B’, the opening and closing curve of ‘S&R’ is steeper with around 50% of places opening at 9 AM, see and . On average, places in the historical centre tend to open and close later than those on the outskirts of the city, see Video S2 in supplementary materials. Nevertheless, a large percentage of places in the historical centre close at 6 PM; the SDE then stretches in the southern direction towards the shopping malls outside of the wider centre, see . The nearest neighbour analysis revealed a significantly clustered distribution of open places throughout the day, with only small exceptions in the morning (6:30 AM) and evening (9 PM, 9.30 PM), see Table S1 in supplementary materials.
Figure 9. A comparison of the proportion of open ‘Shopping & Retail’ places on Wednesdays for the historical centre, wider centre and the outskirts.
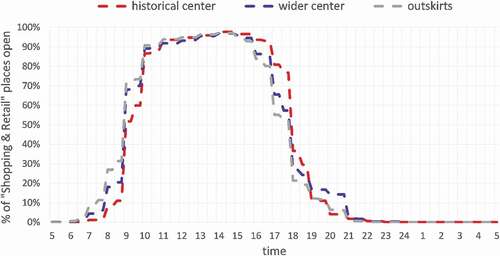
Figure 10. Spatial-temporal distribution of open ‘Shopping & Retail’ places in Brno on Wednesdays, comparison between 8:30 and 9:00 AM.
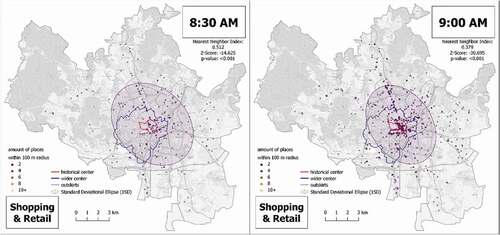
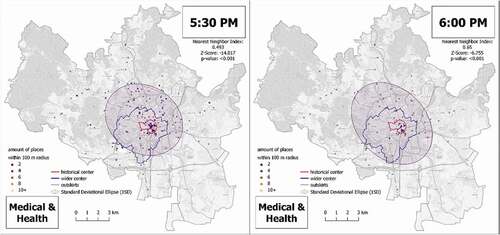
Figure 11. Spatial-temporal distribution of open ‘Shopping & Retail’ places in Brno on Wednesdays, comparison between 5:30 and 6:00 PM.
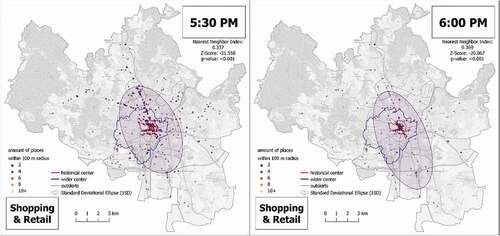
Figure 12. A comparison of the proportion of open ‘Medical & Health’ places on Wednesdays for the historical centre, wider centre and outskirts.
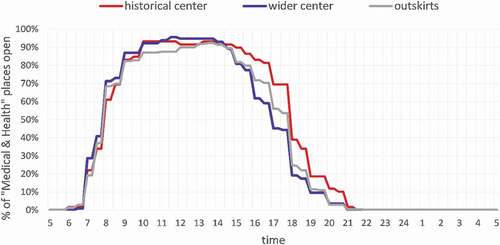
The proportion of open ‘M&H’ places rises steeply at 8 AM and declines at 6 PM, see . Places in the historical centre and outskirts tend to close later than those in the wider centre of the city. In comparison with the previously analysed categories, the SDE changes its size and orientation more rapidly throughout the day, see Video S3 in supplementary materials. In the morning, the SDE tends to stretch in the east-to-west direction, see , however in the afternoon it becomes almost circular and from 6 PM it stretches in the north-south direction, see . Also, there is no evidence of shrinkage of the SDE at the end of the day as observed with respect to ‘H&B’ and ‘S&R’ place categories, see . The nearest neighbour analysis revealed a significantly clustered distribution of open places throughout the whole day, only with small exceptions in the morning (6:30 AM) and evening (8 PM and 8:30 PM), see Table S1 in supplementary materials.
Figure 13. Spatial-temporal distribution of open ‘Medical & Health’ places in Brno on Wednesdays, comparison between 6:30 and 7:00 AM.
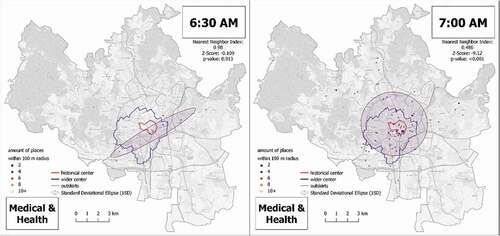
Figure 14. Spatial-temporal distribution of open ‘Medical & Health’ places in Brno on Wednesdays, comparison between 5:30 and 6:00 PM.
3.3 Evaluation of data quality
To evaluate the quality of the harvested data, we compared Facebook Places to the public dataset obtained from a 2017 municipal retail survey, which is available for the city of Brno. Our entire dataset (including all categories) consisted of 6,887 places, with 55% having filled in their opening hours (for a more detailed comparison see ). In contrast, the three years older municipal retail survey dataset consisted of 7,299 objects (after removing objects from ‘banks and ATMs category’, which are not covered in the Facebook Places). The opening hours fill rate reaches around 92% (KAM Citation2020). All the original categories of the municipal retail survey dataset were mapped to Facebook Places dataset categories. No large differences were found in the representation of individual categories within the datasets. The most considerable difference was recorded in the ‘S&R’ category, see . The spatial distribution of places is very similar in both datasets, see and . illustrates normalized differences between these two datasets in a 500 × 500 m grid (Data.Brno. Brno Urban Grid). In the city’s central parts, there is no noticeable difference between the numbers of establishments, while in the outskirts, one of the datasets usually predominates. However, it can be stated that these differences are rather due to the generally lower number of facilities in these areas.
Figure 15. A comparison of the spatial distribution of collected Facebook Places and objects from the 2017 Brno municipal retail survey.
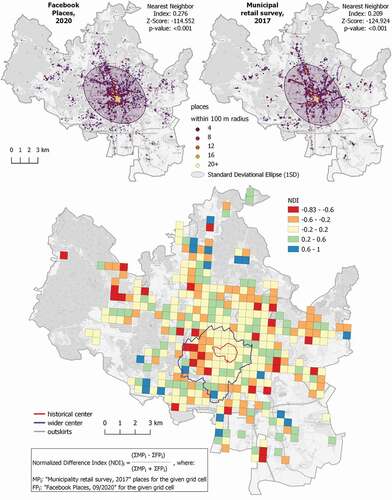
Table 2. Comparison of objects from the 2017 Brno municipal retail survey and collected Facebook Places
In our pilot study, the resulting analysis of opening hours also brought equivalent results to the study conducted by Mulíček and Osman (Mulíček and Osman Citation2018). They worked with the Municipal retail survey dataset from 2013. When these authors interpret the dynamics of the city through earlier field research of the retail network, they point out, for example, the sharp increase in open pharmacies in the morning. As they write (p. 8): ‘In the period between 7 and 8 AM […] a good example is the opening hours of pharmacies, which closely resonate with the typical morning-oriented working time of most of healthcare facilities … ’ Our collected Facebook Places dataset confirms this statement, see . Likewise, our data (see ) also confirm the finding of Mulíček and Osman (Mulíček and Osman Citation2018) when they identify the main wave of shop closure between 5 PM and 6 PM.
The main factor that needs to be considered while utilizing these datasets is the process in which the data are created. In the case of Facebook, we are talking about voluntary information characterized by lower accuracy and subjective nature, but also the recency of the information and the elimination of data collection costs. On the contrary, in case of the 2017 and 2013 municipal retail surveys, field workers collected the data manually, followed strict methodology (Altimapo Citation2017) and proceeded systematically. However, since the differences found in comparison of these two datasets were only marginal and at the same time we were able to reproduce the findings from the study by Mulíček and Osman (Mulíček and Osman Citation2018), we argue that in this case, the benefits of using VGI from Facebook outweighed the drawbacks.
4. Discussion
Although the first implementation of the data gathering and processing described in this paper is slightly time-consuming, it brings benefits for the future. The whole process runs automatically and requires little attention and oversight. It is possible to collect data for any place in the world (presuming a sufficient number of Facebook users) since the data structure is unitary throughout the world. The data collection process can be launched at any time, in a short time interval (depending on the size of the area of interest) and with little additional costs, which leads to better temporal resolution and lower overall expenses compared to the official census and survey data.
In our pilot study, we focused on the possibilities of spatial-temporal analysis of retail and services in the city of Brno. We provided several examples of analytical methods and visualizations which can be used for this purpose. Even though the low fill rate of opening hours significantly reduced the amount of data we analysed, we were still able to capture the expected temporal patterns very similar to Mulíček and Osman (Mulíček and Osman Citation2018).
The distribution in the category ‘S&R’ showed a gradual flattening of the ellipse in a north-south direction. ‘S&R’ dominance in mornings and evenings is not accidental and shows ‘ribbon development’ as an outcome of the industrial period of the city’s history. Shops are spreading to the outskirts mainly alongside the main city streets, which are well accessible (through different modes of transport). In the case of the ‘F&B’ category, the spatial pattern is similar but not identical. Clustering dominates in the historical centre of the city. This is mainly due to the role of the historical core, which has long been used as a place for public meetings and nowadays also for evening parties, drinking in bars, pubs etc. Therefore, although there may be similar spatial patterns for these two categories, the time curves are different. In the case of ‘S&R’ category there is a significant shop opening and closing at a relatively similar time, the ‘day-time retail’ (Mulíček and Osman Citation2018), but in the case of ‘F&B’ category, especially in the historical centre, there is a visible flat course (relatively throughout the day) and aspects of nightlife. From another point of view, the time curves between the different parts of the city are in fact not sharply divergent. Distinctive situations can arise in the ‘M&H’ category. Places that are open in the morning can be, based on further exploratory analysis and general knowledge of the area, assigned to basic medical facilities (hospitals). In the later hours we can observe the opening of other places that are no longer vital, and by their nature closer to retail (e. g., pharmacies). For this category, it is thus crucial to choose specific points for interpretation, not the category as a whole. Using spatial-temporal analysis of open places, we identified differences between the selected categories in terms of their inter-urban distribution and service availability during the day. We assume that these differences would be even more pronounced if we dealt with the places on the subcategories level.
The subsequent nearest neighbour analysis revealed a significant clustered distribution of open Facebook Places for all analysed categories throughout the day. Overall, the data shows central tendencies which correspond to the clustering of everyday activities and business in the centres of industrial cities. Brno, as a former industrial city, has still not reached its full post-industrial stage of development and is still showing signs of central tendencies, for example in public transport (Mulíček Citation2010). However, graphs illustrating the proportion of open places during the day show similar tendencies for all defined city areas which, on the contrary, speaks more in the favour of the post-industrial stage. We suggest that further research must be conducted in order to resolve this contradiction. This implies that data are in their nature suitable to support different theories of delimitation of spatial city structures.
Despite the fact that we chose Wednesday (as a typical working week) as the reference day for analysis in our study, the data can be processed, for example, within the whole week. Opening hours are filled in for each day of the week in separate attributes, so that weekly variations can be identified. For the analysis of seasonal differences, it is necessary to conduct the process of data collection in different parts of the year. This offers a great opportunity for further study of urban space-time rhythms.
During our study, we found several inaccuracies in our data. For example, since businesses fill their page information on their own and do not follow a strict methodology (as in organized surveys), the attributes might not be consistent among the whole dataset – even the categorization of a specific place may prove difficult for places providing multiple types of services (e.g. a hotel with a restaurant).
Some incomplete attributes (such as the aforementioned low fill rate of opening hours) are also downgrading the usability of this dataset. Regarding opening hours, some businesses (usually bars or restaurants) do not have strict opening hours as they might close depending on current demand on a specific day. On the contrary, several businesses that serve their customers depending on current demand state that they are ‘always open’ although this is not entirely true. This is the case of private business establishments with no specific opening hours and people working from home (masseurs, catering services, nutritionists, online sellers etc.). We found that few businesses state obviously incorrect opening hours (such as closing hours preceding opening).
Facebook has also been running a deduplicating tool for Facebook Places since 2014 (Dalvi et al. Citation2014). However, we still found a small number of duplicate values. Regarding location, 31 businesses filled ‘Brno’ (with no further specification) as their location; in these cases, their place was listed in the centre of the central square of the city and this fact also slightly distorts our results. Furthermore, the location of some places might not be entirely correct, as we found a grocery store located in China in our dataset. This was, however, only an isolated case.
A weak point of this dataset might be that some Facebook Pages are present even though they are no longer active (for example businesses which reported going out of business via their Facebook posts only). It is possible to set a business as ‘permanently closed’, but not all closed businesses use this attribute. This outdatedness could be further assessed by monitoring recent activity of a particular page. Even so, the Facebook Places dataset should still be more up to date than the organized retail and services surveys. The accuracy of information provided on their pages should be in business owners’ interest as they use them to communicate with potential customers.
Facebook itself may not be an appropriate medium for the analysis of user data, mainly because of its privacy policy. However, there is a relatively vast potential to trace local preferences for all kinds of services and for exploration of lesser-known user sites. It is also important that Facebook provides the largest sample of social network users, especially in the age group of the economically active population (Kemp Citation2020; Clement Citation2020b).
5. Conclusions
In this paper, we analysed and discussed the potential uses of Facebook geospatial data in social geography. The complete process of data collection and postprocessing was described in detail with respect to the current Facebook Data Policy (Facebook: Data Policy Citation2020) and Graph API options (Graph Citation2020). We also presented a sample of possible analytical methods and visualizations of the data on the example of a pilot study. This pilot study was conducted in the city of Brno, where we analysed the spatial distribution and opening hours of Facebook Places in categories ‘Food & Beverage’, ‘Shopping & Retail’ and ‘Medical & Health’ in order to assess the urban rhythms and the concept of city centrality.
Based on our analysis presented herein, we argue that Facebook Places can serve as an alternative source of data for studying spatial-temporal changes in cities, including chronotopes (defined by Bakhtin (Bakhtin Citation1981) and applied by Crang (Crang Citation2005), in human geography), daily urban dynamics, concentrations and dispersion in a city centrality context. In fact, this is only a subset of all the possible phenomena which can be studied using this data. There is also a wide range of uses of this data and the presented methods of analysis are just examples of some of the possibilities.
The advantages of these data can be summarized as follows:
low cost (after the initial investment in the preparation of the data collection process);
the possibility of repeated collection at shorter time intervals; and
identical data structure across the world, which enables transferability of the presented analyses.
However, we also identified several shortcomings, such as the low opening hours fill rate, some errors in the location and the presence of places which have already gone out of business. We have also verified that our dataset’s spatial distribution correlates with the distribution according to the 2017 official municipality retail survey (Mulíček Citation2010). However, the opening hours fill rate was significantly lower.
There are many opportunities for follow-up research. The presented analyses could be refined if the Manhattan distance was considered instead of the Euclidean distance, or if we directly integrated information about the course and distribution of the street network. It would be beneficial to extend the analytical methods and visualizations provided in this paper using a visual analytics approach. A web application providing up to date data with a possibility to search, analyse, and interpret them using interactive maps linked with graphs may prove useful not only in social geography but also in other fields, for example in crisis management (to refine the estimation of human presence in a given area) or in assessing local preferences of services and places in general. Collecting and maintaining data for more extended periods of time would bring up the opportunity of comparing various changes over time, which is especially important concerning the latest global health crisis precipitated by the outbreak of COVID-19.
Any future research in this area is highly dependent on Facebook Data Policy updates and potential changes in its APIs; however, this limitation is typical for all social networks. The potential offered by the collected data also changes rapidly with the number of social network users. They are the main contributors and the main driving factor for extending the content of Facebook pages and keeping them up to date.
Disclosure statement
No potential conflict of interest was reported by the author(s).
Additional information
Funding
References
- Ali Haidery, S., H. Ullah, N. U. Khan, K. Fatima, S. S. Rizvi, and S. J. Kwon. 2020. “Role of Big Data in the Development of Smart City by Analyzing the Density of Residents in Shanghai.” Electronics 9 (5): 837. doi:https://doi.org/10.3390/electronics9050837.
- Altimapo, S. R. O. “Průzkum Maloobchodní Sítě Města Brna 2017”. Survey of the Retail Network of the City of Brno 2017. Available online: https://www.brno.cz/fileadmin/user_upload/sprava_mesta/magistrat_mesta_brna/OUPR/Maloobchodni_sit/Maloobchod_2017/maloobchod2017.pdf (accessed on 28 January 2021).
- Bakhtin, M. M. 1981. “Forms of Time and of the Chronotope in the Novel: Notes Towards a Historical Poetic.” In The Dialogic Imagination: Four Essays by M. M. Bakhtin, edited by M. Holquist, 84–258. Austin: University of Texas Press.
- Bawa-Cavia, A. “Sensing the Urban: Using Location-based Social Network Data in Urban Analysis.” In Proceedings of the Workshop on Pervasive Urban Applications (PURBA), San Francisco, USA, June 12-15, 2011, 1–7.
- Boy, J. D., and J. Uitermark. 2017. “Reassembling the City through Instagram.” Transactions of the Institute of British Geographers 42 (4): 612–624. doi:https://doi.org/10.1111/tran.12185.
- Cladera, J. R., C. R. Marmolejo Duarte, and M. M. Urban Structure. 2009. “Polycentrism: Towards a Redefinition of the Sub-centre Concept.” Urban Studies 46 (13): 2841–2868. doi:https://doi.org/10.1177/0042098009346329.
- Clement, J. 2020a. “Worldwide Digital Population as of April.” Available online: https://www.statista.com/statistics/617136/digital-population-worldwide/(accessed 5 July 2020)
- Clement, J. 2020b. “Facebook: Distribution of Global Audiences, by Age and Gender.” Available online: https://www.statista.com/statistics/376128/facebook-global-user-age-distribution/(accessed on 24 January 2020
- Crang, M. 2005. “Time: Space.” In Spaces of Geographical Thought: Deconstructing Human Geography’s Binaries, edited by P. Cloke and R. Johnston, 199–220. Sage, London.
- Culnan, M. J., P. J. McHugh, and J. I. Zubillaga. 2010. “How Large U.S. Companies Can Use Twitter and Other Social Media to Gain Business Value.” MIS Quarterly Executive 9 (4): 243–259.
- CZSO. 2019. “Využívání Informačních a Komunikačních Technologií V Podnikatelském Sektoru – Rok” 2018, leden [Use of Information and Communication Technologies in the Business Sector - 2018, January 2019.] Available online: https://www.czso.cz/csu/czso/vyuzivani-informacnich-a-komunikacnich-technologii-v-podnikatelskem-sektoru-rok-2018-leden-2019 (accessed on 18 January 2021)
- CZSO. “Informační Společnost V Číslech”. 2020a [Information society in numbers - 2020] Available online: https://www.czso.cz/csu/czso/informacni-spolecnost-v-cislech-2020 (accessed on 24 January 2021).
- CZSO. 2020b. “Registr Sčítacích Obvodů a Budov [Registry of Census Districts and Buildings.]”. Available on: https://apl.czso.cz/irso4/home.jsp (accessed on 25 April)
- Dalvi, N., M. Olteanu, M. Raghavan, and P. Bohannon “Deduplicating a Places Database.” In WWW ‘14: Proceedings of the 23rd international conference on World wide web, Seoul, Korea, April, 2014, 409–418. doi: https://doi.org/10.1145/2566486.2568034.
- Data.Brno. Brno Urban Grid. Available online: https://datahub.brno.cz/pages/brno-urban-grid (accessed on 2 February 2021).
- Facebook Platform Policy. Available Online: https://developers.facebook.com/policy (accessed on 10 May 2020).
- Facebook: Data Policy. Available online: https://www.facebook.com/policy.php (accessed on 10 May 2020).
- Fukanová, M. “Využití Prostorových Dat Sítě Instagram [Utilization of Instagram Spatial Data].” Bachelor Thesis. Masaryk University, Brno, Czech Republic, 2016.
- Functional Polycentricity:, V. A. 2012. “Examining Metropolitan Spatial Structure through the Connectivity of Urban Sub-centres.” Urban Studies 49 (16): 3627–3644. doi:https://doi.org/10.1177/0042098012447000.
- Goodchild, M. F. 2007. “Citizens as Sensors: The World of Volunteered Geography.” GeoJournal 69 (4): 211–221. doi:https://doi.org/10.1007/s10708-007-9111-y.
- Graph, A. P. I.: “Overview.” Available online: https://developers.facebook.com/docs/graph-api/overview/(accessed on 12 May 2020).
- Graph API: Place Information. Available online: https://developers.facebook.com/docs/graph-api/reference/place-information/(accessed on 12 May 2020).
- Hawelka, B., I. Sitko, E. Beinat, S. Sobolevsky, P. Kazakopoulos, and R. C. Geo-located. 2014. “Twitter as Proxy for Global Mobility Patterns.” Cartography And Geographic Information Systems 41 (3): 260–271. doi:https://doi.org/10.1080/15230406.2014.890072.
- Jenks, G. F. 1967. “The Data Model Concept in Statistical Mapping.” In International Yearbook of Cartography 7, 186–190. George Philip and Son.
- KAM. “Maloobchodní Síť Města Brna [Retail Network of the Brno City.]”. Available online: https://webmaps.kambrno.cz/maloobchod/(accessed on 20 May 2020).
- Kemp, S. “DIGITAL 2020: April Global Statshot.” Available online: https://datareportal.com/reports/digital-2020-april-global-statshot (accessed on 24 January 2020).
- Khan, N. U., W. Wan, and S. Yu. 2020. “Spatiotemporal Analysis of Tourists and Residents in Shanghai Based on Location-Based Social Network’s Data from Weibo.” ISPRS International Journal of Geo-Information 9 (2): 70. doi:https://doi.org/10.3390/ijgi9020070.
- Knox, P. L., and S. Pinch. 2010. Urban Social Geography: An Introduction. 6th ed. Essex, England: Pearson Education Limited. ISBN: 978-0-273-71763-8.
- Kubíček, P., M. Konečný, Z. Stachoň, J. Shen, L. Herman, T. Řezník, K. Staněk, R. Štampach, and L. Š. Population Distribution. 2019. “Modelling at Fine Spatio-temporal Scale Based on Mobile Phone Data.” International Journal of Digital Earth 12 (11): 1319–1340. doi:https://doi.org/10.1080/17538947.2018.1548654.
- Kysela, J., J. Horálek, and F. Holík “Measuring Information Quality of Geosocial Networks.” In 7th Asian Conference in Intelligent Information and Database Systems (ACIIDS 2015), Bali, Indonesia, March 23-25; 2015. doi: https://doi.org/10.1007/978-3-319-15702-3.
- Lefebvre, H. 2004. Rhythmanalysis: Space, Time and Everyday Life. ISBN: 0-8264-6993-0. London, New York: Continuum publishers.
- Mareggi, M. 2013. “Urban Rhythms in the Contemporary City.” In Space-time Design of the Public City, edited by D. Henckel, S. Thomaier, B. Könecke, R. Zedda, and S. Stabilini, 3–20, Springer, Dordrecht.
- Martí, P., L. Serrano-Estrada, and N.-C. A. Social. 2019. “Media Data: Challenges, Opportunities and Limitations in Urban Studies.” Computers, Environment and Urban Systems 74: 161–174. doi:https://doi.org/10.1016/j.compenvurbsys.2018.11.001.
- Mellon, J., and P. C. Twitter. 2017. “Facebook are Not Representative of the General Population: Political Attitudes and Demographics of British Social Media Users.” Res Politics 4 (3): 1–9. doi:https://doi.org/10.1177/2053168017720008.
- Mulíček, O. “Prostorově Diferencovaná Dynamika Maloobchodu V Kontextu Transformace Města [Spatially Differentiated Dynamics of Retail in the Context of City Transformation].” In Geografie pro život ve 21. století: Sborník příspěvků z XXII. sjezdu České geografické společnosti. Ostrava, 2010, 513–516.
- Mulíček, O., and R. Osman. 2018. “Rhythm of Urban Retail Landscapes: Shopping Hours and the Urban Chronotopes.” Moravian Geographical Reports 26 (1): 2–13. doi:https://doi.org/10.2478/mgr-2018-0001.
- Mulíček, O., R. Osman, and D. Seidenglanz. 2015. “Time–space Rhythms of the city—The Industrial and Postindustrial Brno.” Environment and Planning A 48 (1): 115–131. doi:https://doi.org/10.1177/0308518X15594809.
- Mulíček, O., and Z. Stachoň. 2019. “Technologies and the Representations of Activity Spaces of Older Adult.” Geografiska Annaler. Series B, Human Geography 101 (4): 307–321. doi:https://doi.org/10.1080/04353684.2019.1667259.
- Nemeškal, J., M. Ouředníček, and L. Pospíšilová. 2020. “Temporality of Urban Space: Daily Rhythms of a Typical Week Day in the Prague Metropolitan Area.” Journal Maps 16 (1): 30–39. doi:https://doi.org/10.1080/17445647.2019.1709577.
- Owuor, I., and H. H. Hochmair. 2020. “An Overview of Social Media Apps and Their Potential Role in Geospatial Research.” ISPRS Int. J. Geo-Inf 9 (9): 526. doi:https://doi.org/10.3390/ijgi9090526.
- Palumbo, R., L. Thompson, and G. Thakur “SONET: A Semantic Ontological Network Graph for Managing Points of Interest Data Heterogeneity.” In Proceedings of the 3rd ACM SIGSPATIAL International Workshop on Geospatial Humanities, November; 2019, pp. 1–6.
- Places Search API for Web. Available online: https://developers.facebook.com/docs/places/web/search/(accessed on 24 January 2021).
- QGis Documentation v: 3.10: 7.4.4. “Follow Along: Nearest Neighbor Analysis (Within Layer).” Available online: https://docs.qgis.org/3.10/en/docs/training_manual/vector_analysis/spatial_statistics.html#basic-fa-nearest-neighbor-analysis-within-layer (accessed on 28 June 2020).
- Rizwan, M., and W. Wan. 2018. “Big Data Analysis to Observe Check-in Behavior Using Location-based Social Media Data.” Information 9 (10): 257. doi:https://doi.org/10.3390/info9100257.
- Sloan, L. 2017. “Social Science ‘Lite’? Deriving Demographic Proxies from Twitter.” In The SAGE Handbook of Social Media Research Methods, edited by L. Sloan and A. Quan-Haase, 90–104. London: SAGE Publications . doi:https://doi.org/10.4135/9781473983847.
- Stefanidis, A., A. Crooks, and J. Radzikowski. 2013. “Harvesting Ambient Geospatial Information from Social Media Feeds.” GeoJournal 78 (2): 319–338. doi:https://doi.org/10.1007/s10708-011-9438-2.
- Su, X.; Spierings, B.; Dijst, M.; Tong, Z. 2020. Analysing trends in the spatio-temporal behaviour patterns of mainland Chinese tourists and residents in Hong Kong based on Weibo data. Curr. Issues Tour, 23, 1542–1558. https://doi.org/https://dx.doi.org/10.1080/13683500.2019
- The Places Graph FAQ. Available online: https://developers.facebook.com/docs/places/faq (accessed on 12 May 2020).
- Tveite, H. “The QGIS Standard Deviational Ellipse Plugin.” Available online: http://plugins.qgis.org/plugins/SDEllipse/(accessed on 28 June 2020).
- University Consortium for Geographic Information Science: Geographic Information Science & Technology, Body of Knowledge. “CV-05 - Statistical Mapping (Enumeration, Normalization, Classification).” Available online: https://gistbok.ucgis.org/bok-topics/statistical-mapping-enumeration-normalization-classification (accessed on 2 February 2021). 2577–2848
- Uşaklı, A., B. Koç, and S. Sönmez. 2019. “Social Media Usage among Top European DMOs.” In Tourist Destination Management, edited by N. Kozak and M. Kozak, 1–14. Cham: Springer. doi:https://doi.org/10.1007/978-3-030-16981-7_1.
- Virtanen, P., R. Gommers, T. E. Oliphant, M. Haberland, T. Reddy, D. Cournapeau, E. Burovski, et al. 2020. “SciPy 1.0: Fundamental Algorithms for Scientific Computing in Python.” Nature Methods 17 (352). doi:https://doi.org/10.1038/s41592-019-0686-2.
- Wilken, R. 2014. “Places Nearby: Facebook as a Location-based Social Media Platform.” New Media & Society 16 (7): 1087–1103. doi:https://doi.org/10.1177/1461444814543997.
- Zerubavel, E. 1981. Hidden Rhythms: Schedules and Calendars in Social Life. ISBN: 0-5206609-4. Chicago, London: University of Chicago Press.