
ABSTRACT
Habitat spatial distribution is essential to know where to focus the protection of the seafloor resources. In this work, the bathymetry and backscatter seabed data show the importance of remote sensing applications and geospatial tools to have detailed information of the areas studied. The highresolution data enable to explore the environmental characteristics of selected Mediterranean habitats. These data were combined with available samples for ground truthing the habitat distribution model in the southeast of Cabrera National Park. The habitat modelling results show the high value of the studied area for ecological research. Unique communities of large filterers, including sponges, ascidians and bryozoans, were detected in this area. This study presents a potential habitat distribution map of the vulnerable reef habitat 1170, protected under the UE-Directive on the conservation of Habitats, Flora and Fauna, on the southeast margin of Cabrera Island.
1. Introduction
World War II propelled the mapping of ocean beds for the development of submarine navigation charts. It also promoted the beginning of seabed geography by interpreting the geomorphological units of different scales that can be identified in the Digital Bathymetric Models (DBM). Additionally, DBMs are very important in geosciences, physical sciences and life sciences (Bohoyo et al. Citation2019). Nowadays, 15% of the oceans have been mapped in high quality. This is a major success, considering that in 2017 only 6% of the oceans were mapped following the modern standards agreed by the International Hydrographic Organization.
The higher resolution bathymetry supports further qualitative and quantitative interpretation of marine geomorphology (Novaczek, Devillers, and Edinger Citation2019). It also provides more information of environmental characteristics and explores different variables in local scales. In fact, the suitability of these areas for the presence of determinate species and habitats, depends on different seabed parameters, such as slope, orientation, depth, roughness, or substrate, among others. There are many studies in which terrain analysis has been used to obtain terrain attributes in terrestrial areas, among them the study of Zhu et al. (Citation2020), but the use of this scheme is also useful for marine areas. Following this approach, we used geographic modelling to analyse the evolving processes and interactions as factors that constitute the marine environment (Chen et al. Citation2020; Lv et al. Citation2017).
The present work focuses on the Western Mediterranean Basin, southward of Mallorca island (). This sector of the continental shelf is a transit site for migration of a wide variety of cetaceans, seabirds and sea turtles, as well as a suitable space for different types of benthic habitats of vital importance for the survival of marine ecosystems.
Figure 1. Digital bathymetric model of the Western Mediterranean Sea. The red rectangle delimits the area under study. Source: Imagery reproduced from GEBCO_2019 Grid
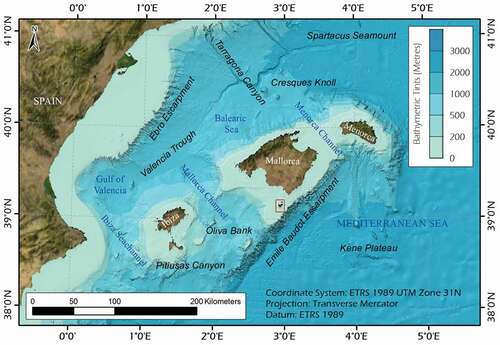
The objective of this work is to achieve higher resolution mapping of seabed areas in the Cabrera Archipelago, which has not been explored in such detail in the past. Thus, this study will constitute a baseline for continuous monitoring of this site for cooperation with the Natura 2000 Marine Network. shows the gridded data from the GEBCO_2019 Grid of the western Mediterranean Sea, where the study area is located. The General Bathymetric Chart of the Oceans (GEBCO) is an international group of experts that work on the development of a range of bathymetric data sets and products. GEBCO operates under the sponsorship of the International Hydrographic Organization (IHO) and the Intergovernmental Oceanographic Commission (IOC) of UNESCO. The GEBCO_2019 grid (Gebco Citation2019) is the product of ongoing efforts by the GEBCO community to compile all available bathymetric data into a global gridded model (Weatherall et al. Citation2015). The grid resolution of the bathymetric model is 15 arc-seconds and has been homogenized with land topography to obtain a continuous gridded model that is available for scientific and educational use. It can be seen in some underwater landforms and in the Balearic continental shelf and surrounding areas.
According to the European Environment Agency (Citation2018), global oceans are warming, and this is expected to have (and already has) several consequences on marine ecosystems. Among them is that temperature of the sea surface has increased in all major marine ecosystems since 1957. As the effects of climate change on large marine ecosystems are uncertain, preventive management measures must be taken. It will be easier to solve these problems with more studies and detailed information of sensitive areas. In fact, climate change is rapidly taking its toll on valuable species and ecosystems. Global warming can significantly affect habitats that are sensitive to changes in temperature and salinity such as reefs, which is the case at hand. In addition, this ecosystem is very vulnerable due to its slow growth and specific development conditions. The results in the last report of the RADMED project show a clear increase in the warmth and salinity of the Spanish Mediterranean waters. It can be established that intermediate and deep waters have increased their temperature at a rate between 0.2 and 0.3°C/100 years (Vargas Yánez et al. Citation2020). These trends have been estimated for the 1945–2016 period for intermediate and deep waters. Intermediate waters have a depth of 150 to 600 m and deep waters are considered as those extending from 600 m to the sea bottom. The time series of satellite sea surface temperatures from 1982 to 2017 show a very clear rise in temperature trends – they are close to 2°C/100 years.
In recent years, the sustained increase in partial CO2 pressure is causing the acidification of seawater, reflected in a decrease in pH (DeVries, Holzer, and Primeau Citation2017). Moreover, the changes in ocean circulation patterns affect the amount of carbon dioxide they absorb, intensifying climate change. This decrease in pH could significantly reduce (or even stop) the deposition of carbonates in organisms with calcified skeletons or shells, such as bivalve molluscs and reef-forming corals. In the long-term, the decrease in pH will be intense enough to initiate the dissolution of carbonates in coastal waters, which would affect the absorption of CO2 by the ocean and could lead to coral reef degradation.
2. Study area: Cabrera National Park
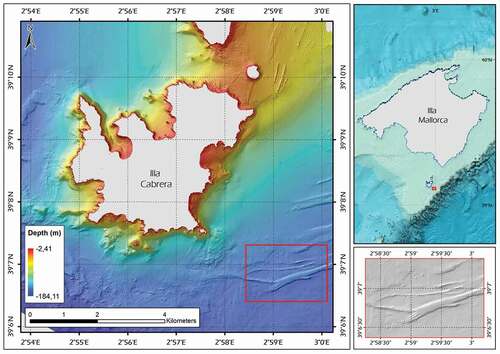
The focus of this study is a selected area of the National maritime-terrestrial Park of the Cabrera Archipelago, which is a set of islets that belong to the Balearic Islands, located at the south of Mallorca (). The Mediterranean is an excellent natural laboratory for research due to its small size and the fact that the processes that take place in this sea are the same as the physical phenomena in the great oceans. In addition, its seafloor geomorphology is an ideal area for habitat mapping (Prampolini et al. Citation2018). Therefore, the Cabrera archipelago was chosen for this study because of the large amount of seafloor bedforms, including rocky outcrops, sand ridges, coralligenous substrate and other vulnerable benthic habitats like maërl beds or meadows of the Mediterranean endemic phanerogam Posidonia oceanica.
Figure 2. (Left) Cabrera Bathymetric Terrain Model. In red, location of the study area, showing linear rocky outcrops in ENE-WSW direction. (Bottom top) DBM of the continental shelf of Mallorca island. (Bottom right) Zoomed shaded relief image of the SE corner of the Cabrera continental shelf, illustrating the extent of the seabed ridges
Cabrera Archipelago is protected by several legal figures, the major being the National Park of Spanish Waters. It has a marine protected area with previous ecological studies because it is an area with an excellent area for submarine research. Other protection categories exist at an international level, complementing the national level figures. They include the classification of Cabrera Archipelago as a Community Interest Site (CIS) and Special Protection Area for Birds (SPAB) in the Natura 2000 Network Program and SPAMIs (Specially Protected Areas of Mediterranean Importance).
This study () covers the area ranging from 39°8´N; 2°58´E to 39°6´N; 3°0´E, on the southeast of the Cabrera Island, the major island of the archipelago. This part of the Mallorca shelf is wide and the topographic gradient is very gentle. It is located very close to the edge of the continental shelf, where an abrupt change of slope begins along the Emile Baudot Escarpment (), developed during the Late Oligocene and Early Miocene. The beginning of the southern continental slope of Mallorca is marked by this steep escarpment at 183 meters deep and with a NE-SW direction. This slope is the contact between the continental and oceanic crusts, the boundary flanked by two megastructures, the Betic System and the oceanic basin Algero-Balear (Maestro et al. Citation2015) along the Emile Baudot fault.
2.1. Geological setting
Ancient counterparts of the Balearic ramp are present in the Neogene of the Mediterranean Tethys and the Paratethys, although the constituents of fossil assemblages vary with time (Fornos and Ahr Citation1997). The glacio-eustatic variations of the sea-level in the Mediterranean Sea during the Quaternary have played an important role in the fragmentation of the shelf into different sub-basins and in forming different platforms where carbonate complex bars could be developed. These barriers, as well as those of other marine carbonate environments, generate a complex series of associated flood ramps and pseudoreefal constructions (Acosta Citation2005). In this context, the reef accumulations that are present in the study area constitute one of the most vulnerable ecosystems in the Cabrera National Park.
The sediments of the Balearic shelf are mainly biogenic sands and gravels with a high percentage of carbonates varying between 77% and 84% (Acosta Citation2005). Most of these sediments consist of Mesozoic and Paleogene materials. They created the relict sand ridges and seagrass sand banks observed on the Balearic continental shelf.
The Betic Cordillera and the Balearic Promontory form the westernmost Alpine mountain belt in Europe. The bedrock and tectonic structures of the continental margins are directly related to the distribution and evolution of the main terrestrial domains in the Iberian Peninsula (Maestro etal. Citation2013). There are singular features on the elongated rocky outcrops ENE-WSW direction () that follow the prevalent trend of the Balearic Promontory. These seafloor bedforms correspond to the NE prolongation of the Betic Cordillera.
2.2. Environmental setting
The Mediterranean Sea of Mallorca and Cabrera is a low-energy, temperate, oligotrophic, clear water environment. Paleontologically, the biota of the Balearic ramp (including bryozoans, red algae, echinoderms and molluscs) ranges from the Paleozoic Era to the present (Fornos and Ahr Citation1997). The environmental characteristics give this space a certain uniqueness, as it is a carbonate ramp where the action of the currents is low energy and where the sedimentary contributions are scarce due to the absence of rivers on the islands. Around the Cabrera, more than 300 different species of algae, sea squirts, echinoderms, bryozoans, anthozoans, sponges, polychaetes and pelagic and benthic species have been found.
The characteristic bottom of this study area is mostly sandy-detrital, becoming rockier as it gets closer to the coast. The rocky substrate has a patchy distribution and is characterized by encrusting organism and branching and foliose red algae that are present as encrustations on stout rhizomes.
3. Methodology
The main objectives of the Cabrera National Park survey primarily focused on the acquisition of high-resolution bathymetry and acoustic backscatter, sediment samples and seismic-reflection profiles. The area was surveyed by the Secretaria General del Mar (SGM) of the Spanish government and led by the cartographic team, which began surveying the Cabrera National Park in July 2012. These surveys are part of the Spanish Continental Shelf Research Project (ESPACE), which work with different techniques to obtain and harmonize information from the seafloor.
In some surveys, a variety of ground validation methods were used to verify the seafloor characterization over the study area (Brown et al., Citation2019). The geologic and bathymetric interpreted characteristics were completed with sediment samples to study and classify the marine habitats in this area. Representative samples allow to recognize existing marine habitats around the study. In the present study, the rocky outcrops are used to apply the semi-automated classification of the seafloor to detect suitable areas for reef concretions.
The Digital Bathymetric Model was used to obtain the main terrain attributes and to identify the depth ranges in which vulnerable reef habitat 1170 could be located. Reef habitats are protected under the European Union (EU) Directive on the conservation of Habitats, Flora and Fauna (92/43/EEC; Community Citation2010). Therefore, the main objective of this research is to apply a validated methodology that allows to map (Diesing and Thorsnes Citation2018) the reef habitat in high spatial detail, highlighting the importance of high-resolution bathymetry data in resolving small topographic features likely to support threatened species (Rengstorf et al. Citation2013).
In addition, georeferenced seafloor samples were collected within the survey area in April 2016 using a ROV (Remotely Operated Vehicle). This is a system of live viewing and remote video capture from a PC located on the vessel. The samples used in this study were obtained from another survey, carried out by the Autonomous Organization of National Parks (OAPN, Spain). This includes more than a hundred samples of soft bottom sediment and infauna.
3.1. Acoustic survey
The geophysical survey was carried out under the ESPACE project on board of the vessel B/O Emma Bardán. The work was conducted from the coast to 185 meters depth around the Cabrera Archipelago. This area – covered by the mosaic of the acoustic survey in the Balearic region – is of approximately 138.28 km2. Multibeam echosounder (MBES) systems are today recognized as one of the most effective tools to map the seafloor (Micallef et al. Citation2012). MBES are sonar systems that allow to obtain images of large areas of the seafloor (Maestro et al. Citation2013). These systems map the seafloor using a fan of narrow acoustic beams with a 100% coverage of the bottom. The multi-beam technique uses multiple narrow beam transmission/reception for a single transmission, providing better seafloor coverage (Blondel Citation2011). Hence, MBES data provide excellent data on bathymetry and can be used to generate quantitative variables that describe the seabed surface (Buhl-Mortensen, Dolan, and Buhl-Mortensen Citation2009). The terrain attributes obtained from the acoustic techniques, such as slope, roughness, aspect, and Bathymetric Position Index (BPI), could improve the possibilities for habitat mapping studies at different scales. These data have become essential in studying marine habitats due to their remoteness and to difficulties in sampling (Lecours et al. Citation2015).
3.2. Technical equipment
During the geophysical survey, the team was working simultaneously with a multibeam echosounder (MBE) model EM3002D, a high resolution system at 300 kHz frequency (Kongsberg Citation2006) and a Topographic Parametric Sonar PS040. The navigation was in parallel lines, maintaining an equidistance of 150 meters and following IHO standards. This distance generated 25% overlapped areas between records.
The starting point to highly accurate mapping is to decide the data position. For positioning and orientating, a Global Position System/Global Navigation Satellite System Trimble Ag132 and a Seapath 200 system were used. They give real-time positioning with submetric accuracy, also providing real-time Heave, Pitch, Roll and Yaw values with an Inertial Measurement Unit (IMU). As a result, the Signal Processing System gives the calculated position in WGS84 reference system.
The sound velocity was corrected with the data obtained from a Sound Velocity Profiler System SVPlus (Applied Microsystems LTD), a fundamental tool to know how sound will travel underwater depending on the depth, temperature and pressure. This is used to determine the direction of acoustic reception. SVP values were normally applied in real-time during surveys or in a later processing phase (Passaro et al. Citation2016). The monitoring of the sound variation and oceanographic conditions were taken daily in function of the different zones.
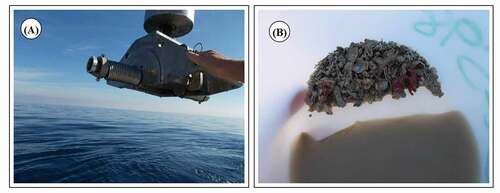
For sediment samples, a Shipeck dredge was used by direct methods to obtain a seafloor characterization composition and to do the ground truthing of the different areas to identify species and sediment types. After this, a series of photographs were taken to have detailed information of benthic communities. A 35×35 cm Shipeck dredge was used for surface sediment sampling to ensure penetration into non-cohesive sediment () that was greater than 5 centimeters. Furthermore, for all the camera surveys, the Deep Trekker DTG2 system was employed with a 700HD and 0.01 Lux camera.
Figure 3. (a) Shipeck dredge. (b) Sediment sample. Source: OAPN
3.3. Data processing
The bathymetry and backscatter data from the Cabrera acoustic survey were derived from the multibeam echosounder, taking advantage of the wide spectrum of information that it provides, including co-registered backscatter and bathymetry and angular backscatter intensity (Fakiris et al. Citation2019). All data were recorded in HD, following the survey transects planned to cover the entire seabed area with high accuracy. Afterwards, the multibeam echosounder raw data containing the original depth soundings and backscatter values (Plets et al. Citation2012) was processed with Caris HIPS and SHIPS software to obtain an ASCII GRID. Once the data had been cleaned and validated, it was incorporated to the ArcGIS and Fledermaus software, in order to analyse and extract a homogeneous high resolution ESRI GRID format for the bathymetry and Georeferenced TIFF format for the Backscatter intensity (), respectively.
Figure 4. Overview of ground-truthing stations superimposed on bathymetry hill shade with a contour interval of 1 m. Sediment samples (orange circles) and camera stations (green triangles)’ location at the study area
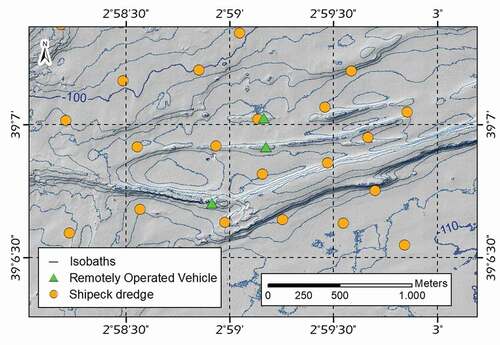
Figure 5. Flow diagram of the processing steps, starting from the multibeam echosounder acquisition (A), followed by the original depth soundings and backscatter values stage (B), showing representative examples of cleaned and validated data (C) per feature extraction method and resulting in the corresponding features for bathymetry (D) and backscatter (E).
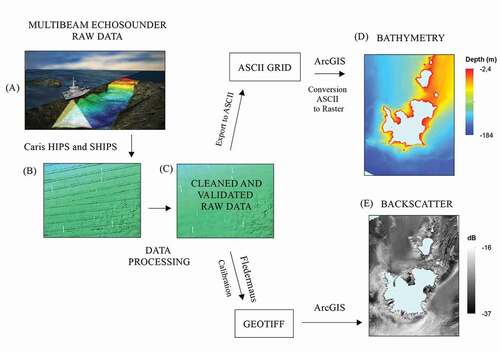
Figure 6. (a) Detailed 1-meter resolution multibeam shaded relief bathymetry (hillshade 6x vertical exaggeration) in the Cabrera southeast continental shelf. Colour scheme range for depth values is in meters, from red (lowest) to blue (highest). (b) Backscatter (300 KHz) intensity in the Cabrera southeast continental shelf. Yellow zones indicate a strong backscatter signal and green zones indicate weaker backscatter signals. Backscatter intensity is in decibels
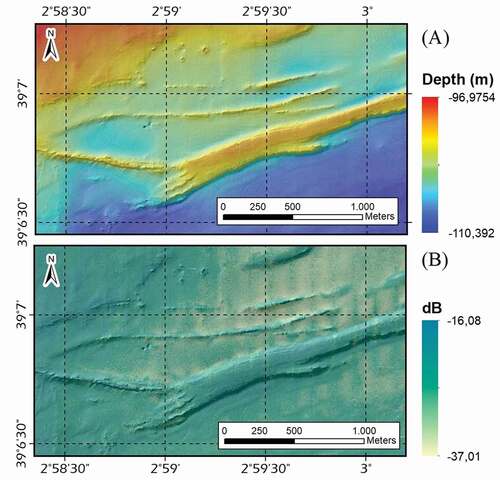
Figure 7. Predicted seafloor substrate distribution extracted from backscatter intensity. Granulometric analysis determined on sediment samples. Spatial variability in the percentages of mud, sand and gravel contents in surface sediment. The pies represent the quantification of textural composition. G: Gravel; GS: Gravelly Sand; MCS: Medium Coarse Sand; CS: Coarse Sand; S: Sand; SM: Sandy Mud; MS: Muddy Sand; M: Mud
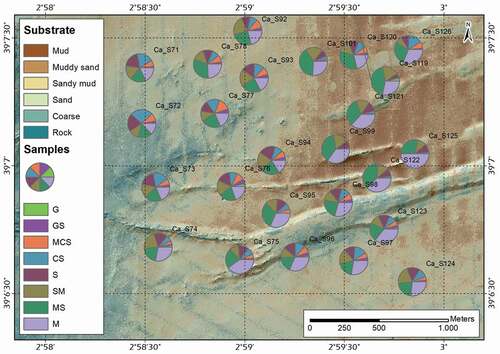
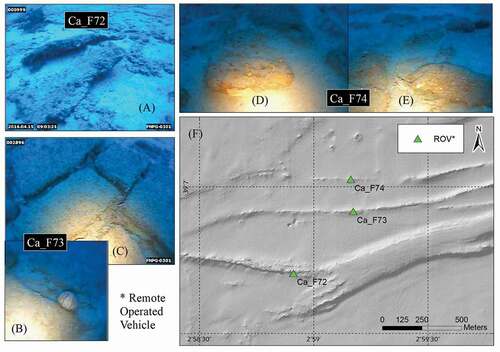
Figure 8. Detail of remotely operated vehicle images. (a) Ca_F72. Rocky outcrops (b) Ca_F73. Presence of equinodermus (Echinus Sp.) (c) Ca_F73. Linear rocky outcrops with presence of three-tailed fish bank (Anthias anthias) (d) Ca_F74. Axinella sp. (e) Ca_F74. (Palinurus elephas) (F) ROV locations
The mosaics obtained from the processing of the bathymetry and backscatter data were followed by the classification of the results. The bathymetric surface was classified using a set of geoprocessing tools to analyse the seafloor characteristics. The backscatter mosaic was classified into substrate classes based on the intensity of acoustic returns.
The multibeam bathymetry product was computed at maximum resolution and an homogeneous mosaic covering 100% of the surface was acquired. The hillshade product was obtained using the Spatial Analyst extension (Miller et al. Citation2013) and the ArcGIS software. A shaded relief was generated with a 6x vertical exaggeration. This product facilitates the visualization of the abiotic parameters. The hillshade is usually overlapped with the terrain variables to give some degree of transparency to the combined layers. This model provides the main characteristics of the seafloor in the study area.
A set of more than four topographical terrain variables was obtained from bathymetric data, collected by the MBES survey, using Benthic Terrain Modeler in ArcGIS 10.4.1. The continuous variables were depth, topographic slope (steepest gradient to any neighbouring cell), roughness and Bathymetric Position Index.
Derived terrain attributes from the bathymetric data have been used as a proxy for habitat identification. The calculation of the derivatives of the bathymetry (slope, aspect, roughness, etc.) defines the parameters of coastal landforms. The geomorphological features describe the surficial characteristics of the seafloor, providing the baseline for subsequent habitat-mapping studies, and can therefore be considered a potential habitat map (Lucatelli et al. Citation2019).
These seabed attributes were combined with textural seafloor characteristics obtained from the backscatter mosaic. Backscatter strength, a continuous variable that measures the acoustic reflectivity of the seafloor, has been found to be a useful surrogate for substratum type (Lamarche et al. Citation2011; Rowden et al. Citation2017). Hence, given the textured nature of backscatter imagery, it is helpful to characterize image objects with a texture measure in addition to its backscatter and bathymetry values (Lucieer and Lamarche Citation2011). In this specific case, backscatter intensity Geotiff mosaic was translated into textural bedforms assigned to different grain sizes (). High intensity (−16 dB to −24 dB) for hard substratum data and low intensity (−24 dB to −37 dB) to the seafloor response of the soft bottom sediment.
The topographic slope can also be useful in identifying areas of rock outcrop and seafloor structures, such as sandbanks and other bedforms. Spatial analysis also serves to quantify terrain ruggedness by measuring the dispersion of vectors that are orthogonal to the terrain surface. This model combines the variability of slope and aspect into a single measure, without being over-correlated with the slope values (Bargain et al. Citation2017). This tool measures terrain ruggedness as the variation in three-dimensional orientation of grid cells within a neighbourhood.
The BPI index was generated with the Benthic Terrain Model tool using the ArcGIS software. The BPI is the marine version of the topographic position index (TPI) introduced by Weiss in 2001 (Wilson et al. Citation2007). It classifies landscape structure (e.g. valleys, plains, hill tops) based on the change in slope position over two scales (Walbridge et al. Citation2018), at ‘broad’ and ‘fine’ scales. Moreover, the BPI index quantifies where a location on a bathymetric surface is relative to the overall seascape (Lundblad et al. Citation2006). Different scale factors were tested and compared. In fact, different BPI datasets with different scale factors are created during the benthic terrain classification process. These data sets are useful in identifying larger benthic terrain regions or areas (Wright et al. Citation2012). Finally, the scales used here were from a 25-cell area for the Broad-BPI and 3 cells for the Fine-BPI (De Oliveira et al. Citation2020).
Regarding the biological data, a database collating all the information extracted from the surveys was designed to analyse it -the samples obtained to provide a base for biological mapping. A total of 5.8 km2 were covered by the OAPN survey using the underwater visual census, and 8986 m2 were caught using the beam trawl technique to characterize the benthic communities. The distribution of seafloor samples () generates a punctual database to verify some local points where the substrate must be confirmed.
4. Results
4.1. Bathymetry
The bathymetry final was gridded to 1 metre (), obtaining a continuous high resolution bathymetric GRID for the finer visualization, interpretation, and analysis of the spatial data. Seafloor topography is a good approximation to define habitat structural complexity (Prado et al. Citation2020). Furthermore, the homogeneous mosaic covers 100% of the surface, representing the depth values on a continuous raster across the whole study site.
4.2. Backscatter
The backscatter intensity data, generated by the multibeam echosounder gives us an output of one Geotiff mosaic of 300 kHz () at a spatial resolution of 2×2 m. It also covers the full study area. The seabed backscatter intensity can be used to segment and classify the seafloor (Brown et al., Citation2019). The surface backscatter intensities processed in this study range from close to −16 dB down to −37 dB. According to the literature (Carreño et al. Citation2011), in the classification applied in this study, the highest values correspond to the rocky outcrops and gravels (between −16 dB and −24 dB), the forms are perfectly identifiable in the shading model. The sandy fractions have typical values in a broader backscatter interval (−24 dB and −30 dB), including coarse sand sediments (between −24 dB and −26 dB), medium sands (between −26 dB and −28 dB) and fine sand (between −28 dB and −30 dB). Finally, the muddy terms have the lowest energy values (between −30 dB and −37 dB). Six classes of substrate were obtained from the backscatter imagery: (1) rock, (2) gravel, (3) sand, (4) sandy mud, (5) muddy sand and (6) mud. Most of them matched with the sediment samples, corresponding to the fine granulometric fractions. On the other hand, video transects were used to verify the existence of hard substrates in the area. Video transects surveys filmed at targeted sites () on the higher backscatter features visible in the mosaics revealed the presence of rock and detritic bottoms.
4.3. Sediment samples
The sediment grab samples from the survey site indicated that mud was the predominant sediment type at the surface of the seafloor over the vast majority of the survey area (). At the sampling stations around the rocky outcrops, the percentage of sand was higher – gravel fraction was detected in some stations. All the sampling stations coincided with low backscatter features on the backscatter mosaic. It should also be noted that stations sampled on hard substrates coincided with the high backscatter features on the intensity values of the mosaic. As a result, a model of the relationship between the acoustic backscatter and substrate properties (Lamarche et al. Citation2011) was obtained. The substrate map model () was ground troughed validate with the application of the mentioned direct methods. For instance, the sediment samples and underwater video and photographs serve to show the presence of reefs and associated organisms.
4.4. Substrate
The classified seafloor substrate represents the following textural composition: G–Gravel; GS–Gravelly Sand; MCS–Medium Coarse Sand; CS–Coarse Sand; S–Sand; SM–Sandy Mud; MS–Muddy Sand; M–Mud. illustrates the results obtained by the percentage of each fraction by sample. The criteria for this classification was based on the grain size of the sediment samples. In particular, rock and gravel classes are the focus of the study due to their bottom characteristics.
4.5. Slope
Surface complexity can influence the available surface areas for settlement, the availability of food, protection from predation and exposure to currents and wave action. Thus, the roughness shows ()) small areas that combine slope index and roughness in greater detail. The slope is quite regular and very flat, except for the mounds under study; it generates an index that is quite similar to the real one. It was possible to appreciate some outcrops nearest to the coast, but the continental shelf is covered with sediments. We can only find an arcuate rock outcrop parallel to slope ()) in the deepest area, that from −100 m to more than 110 m of depth.
Figure 9. (Left) Spatial distribution of values of the four environmental variables used to build habitat suitability models through the bathymetric analysis. (a) Slope gradient (b) Roughness Index (c) Fine Bathymetric Position Index (d) Broad Bathymetric Position Index (BPI). (Right) Two specific subareas, four in isolated outcrops (A1, B1, C1, D1) and four in elongated outcrops (A2, B2, C2, D2), are indicated by a black square in the main map
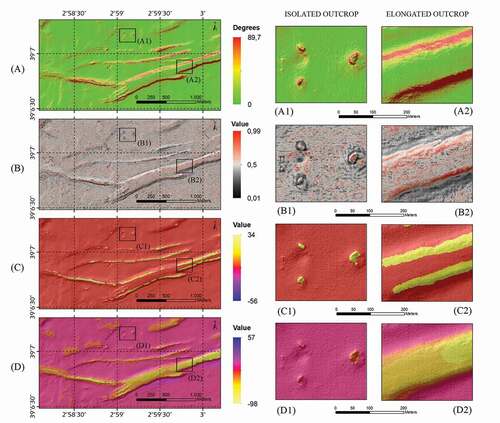
In large part of the study area, the gentle slope is the most prevalent. To the south of Cabrera island, the slope quickly increases between −30 and −50 m and some small escarps have been identified, which seem to define an area with marks in the bottom and with a high amount of shoals.
4.6. Terrain roughness
The terrain roughness values ()) range from low values, such as 0.01, coding for flat terrain or a steep area, to 0.99, a terrain that is both steep and rugged (Hobson Citation1972). The threshold established for this variable is a value that is over 0.60. In this case, the selected values of ruggedness show the areas with high steepness and ruggedness and it involves the zones with potential habitat for reefs. Furthermore, roughness is also a measure of terrain complexity. Benthic zones with a high roughness index help in the identification of areas with high biodiversity.
4.7. Bathymetric position index
The BPI analysis of the study area (,) provides information of some characteristic crests along the rocky outcrops. The areas with major positive values were extracted for the potential habitat map; these values represent the distribution of the crests and narrow crests () located on the longitudinal edges of the rocky outcrops. The semi-automated classification also detects small isolated areas (C1) with the same BPI value.
4.8. Underwater video transects
The video transects located southeast of Cabrera, at a depth of 102 metres, show a large rocky outcrop and soft sandy substrate with scattered rocks (). On the rocky blocks ()) we can see inlaid sponges (Axinella polypoides), starfish, equiuroids (Bonellia sp.) and hedgehogs (Echinus sp.). Between the cracks (,), there are two specimens of goat (Scorpaena sp.), three-tailed fish banks (Anthias anthias), goats (Serranus sp.) and a lobster (Palinurus elephas). We can also see the remainders of phanerogams in the area. On both rocks and detritic bottoms, this natural system consists of different species of sponges, bryozoans and ascidians and numerous associated species, which in turn create rich ecosystems.
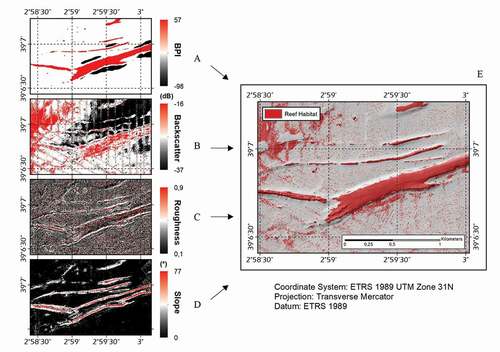
4.9. Potential habitat distribution map
When we combine the information of the biological samples, substrate type, backscatter intensity, roughness and BPI, we can do an approximation of the potential zones for the 1170 reef habitat on the southeast margin of Cabrera island. Finally, a reef habitat map refines the spatial distribution of this vulnerable ecosystem, where large reef areas extend over the survey area ().
Figure 10. Example of mapping results showing a potential habitat distribution map for reefs overlaid on a hillshade image of the bathymetry. The red zones represent terrain with certain environmental conditions for the location of 1170 reef habitat. (a) Bathymetric Position Index (b) Backscatter intensity (c) Roughness Index (d) Slope gradient (e) Final reef habitat model with the combination of all these variables. Only rocky outcrops that were occupied by potential habitat reef areas are shown
5. Discussion
The high accuracy of the modern bathymetric data from multibeam systems has been shown to be a valuable source of geophysical information for defining benthic habitats (Ierodiaconou et al. Citation2007) and derived products such as depth, slope or rugosity, which constrain the spatial distribution of benthic communities. Seabed features can be mapped from derivatives of MBES bathymetry in an efficient and validated way with high accuracy (Diesing and Thorsnes Citation2018). Therefore, in the study area, the results of the Cabrera National Park dataset provide enough bathymetric accuracy (1-metre resolution) to comply with the resolution requirements of the habitat model.
The present study also confirms the relationship between the higher values of backscatter intensity with the hard-bottom areas, proving the correlation of the acoustic response of the seabed with the type of substrate and the physical properties of the seafloor. High reflectivity (high backscatter intensity) is usually interpreted as an indication of hard bottom (Angeletti et al. Citation2019). For instance, the survey results confirm the correlation of the acoustic backscatter data, showing the correspondence of the hard substrate zone with the higher backscatter intensity, with values above −24 decibels. The method used to define the reef habitats has been used in other studies, such as the habitat mapping to advance coastal management of rock reef fisheries, giving improved mapping methods of fine-scale features of benthic marine habitats (Lucieer and Pederson Citation2008). The substratum type influences the distribution of benthic organisms, including the study taxa, which typically occupy hard substratum with high backscatter seafloor (Georgian, Shedd, and Cordes Citation2014). In addition, backscatter from multibeam data sources has recently been shown to be a valuable data source in defining seabed features (Gardner et al. Citation2003).
The classification of the seafloor inside a set of sediment classes was not used in this study, even though it is necessary for the selection of the reef ecosystem areas associated with hard bottoms. The other classes would be used in other studies given the accuracy of the data in this area. The classes muddy, sandy, and gravelly seafloors are used as reference to provide information on the seafloor composition (Lamarche et al. Citation2011). When reflectivity data is verified (with the sediment samples for soft substrate and also with the underwater video recordings), an approximation of the nature of the seabed was obtained.
The scale of acoustic data is often too large to accurately identify the seafloor type and morphology. Therefore, acquisition of small-scale data (direct observations of the seafloor) becomes fundamental to validate habitat maps resulting from acoustic data analyses (Angeletti et al. Citation2019). As for the video transects, the presence of high biodiversity richness indicates the importance of the studied area in terms of ecological interest.
The present research has applied a semi-automated classification method with GIS techniques in a marine context, providing a clear picture of the distribution and the extent of marine biodiversity, and thus facilitates marine environment management (Barberá et al. Citation2012). The common application of GIS to land and terrestrial areas is gaining momentum in the field of marine science, thus opening a range of possibilities for ocean research. Despite increasing awareness, advances in techniques that characterize habitat complexity in the marine environment are limited compared to terrestrial ecology (Lucieer and Pederson Citation2008). Habitat maps also help design environmental measures for specific vulnerable habitats in the establishment and management of marine reserves (Prado et al. Citation2020). If we want highlight the importance of marine benthic habitat mapping with GIS semi-automated classification, we could say that the results obtained in this survey have contributed in the creation of a homogeneous fine-scale habitat map, as part of a relevant marine habitat mapping model for the Western Mediterranean zones.
6. Conclusion
In the past two decades, the increase in the number of studies in marine habitat modelling has led to detailed work in seabed geography. This provides a basis for marine biodiversity information, enabling effective management of the resources. The combination of remote sensing techniques with direct observations helps in modelling the marine environment with relative accuracy. In addition, the Geographic Information System is a powerful tool to develop these models, as it allows for a representation of spatial variables that is very akin to the real natural environment. The present study can be considered as valuable enough to identify some potential zones for benthic communities.
Acknowledgements
We would like to thank the Spanish General Secretariat of the Sea for providing ship time and technical support. The Spanish Continental Shelf Research Project is funded by SGM in collaboration with the Spanish Oceanographic Institute. The authors would also like to thank the OAPN for providing free access to the Cabrera National Park databases and for their help and support throughout this study. The research has been made possible thanks to the NGO Guías de Espeleología y Montaña (Speleology and Mountain Guides) and Canal de Isabel II Gestión (public water supplying company, Madrid, Spain). Our sincere thanks to the anonymous reviewers, who provided insightful comments and suggestions that improved this manuscript.
Disclosure Statement
No potential conflict of interest was reported by the authors.
References
- Acosta, J. 2005. El Promontorio Balear: morfología submarina y recubrimiento sedimentario. Ph.D. Thesis. University of Barcelona and the Instituto Español de Oceanografía, Barcelona, 154 pp
- Angeletti, L., A. Bargain, E. Campiani, F. Foglini, V. Grande, E. Leidi, A. Mercorella, M. Prampolini, and M. Taviani. 2019. “16 Cold-Water Coral Habitat Mapping in the Mediterranean Sea: Methodologies and Perspectives BT.” In Mediterranean Cold-Water Corals: Past, Present and Future: Understanding the Deep-Sea Realms of Coral, edited by C. Orejas and C. Jiménez, 173–189. Springer International Publishing. doi:https://doi.org/10.1007/978-3-319-91608-8_16.
- Barberá, C., J. Moranta, F. Ordines, M. Ramón, A. De Mesa, M. Díaz-Valdés, A. M. Grau, and E. Massutí. 2012. “Biodiversity and Habitat Mapping of Menorca Channel (Western Mediterranean): Implications for Conservation.” Biodiversity and Conservation 21 (3): 701–728. doi:https://doi.org/10.1007/s10531-011-0210-1.
- Bargain, A., F. Marchese, A. Savini, M. Taviani, and M. C. Fabri. 2017. “Santa Maria Di Leuca Province (Mediterranean Sea): Identification of Suitable Mounds for Cold-water Coral Settlement Using Geomorphometric Proxies and Maxent Methods.” Frontiers in Marine Science 4 (OCT): 1–17. doi:https://doi.org/10.3389/fmars.2017.00338.
- Blondel, P. 2011. In Bathymetry and Its Applications. P. Blondel (ed).. InTech.
- Bohoyo, F., R. D. Larter, J. Galindo-Zaldívar, P. T. Leat, A. Maldonado, A. J. Tate, M. M. Flexas, et al. 2019. “Morphological and Geological Features of Drake Passage, Antarctica, from a New Digital Bathymetric Model.” Journal of Maps 15 (2): 49–59. doi:https://doi.org/10.1080/17445647.2018.1543618.
- Brown, C. J., J. Beaudoin, M. Brissette, and V. Gazzola. 2019. “Multispectral Multibeam Echo Sounder Backscatter as a Tool for Improved Seafloor Characterization.” Geosciences (Switzerland) 9: 3. doi:https://doi.org/10.3390/geosciences9030126.
- Buhl-Mortensen, P., M. Dolan, and L. Buhl-Mortensen. 2009. “Prediction of Benthic Biotopes on a Norwegian Offshore Bank Using a Combination of Multivariate Analysis and GIS Classification.” ICES Journal of Marine Science 66 (9): 2026–2032. doi:https://doi.org/10.1093/icesjms/fsp200.
- Carreño, F., I. López, J. Payán, C. Arranz, and E. Castellanos. 2011. “Aplicación del análisis textural a datos de retrodispersión de sonda multihaz para la clasificación de fondos marinos.” Revista De Teledetección: Revista De La Asociación Española De Teledetección 36: 5–19.
- Chen, M., A. Voinov, D. P. Ames, A. J. Kettner, J. L. Goodall, A. J. Jakeman, M. C. Barton, et al. 2020. “Position Paper: Open Web-distributed Integrated Geographic Modelling and Simulation to Enable Broader Participation and Applications.” Earth-Science Reviews 207 (June2019): 103223. doi:https://doi.org/10.1016/j.earscirev.2020.103223.
- Community, E. 2010. “Council Directive 92/43/EEC of 21 May 1992 on the Conservation of Natural Habitats and of Wild Fauna and Flora (OJ L 206 22. 07.1992p. 7).” Documents in European Community Environmental Law L: 568–583. doi: https://doi.org/10.1017/cbo9780511610851.039
- De Oliveira, N., A. C. Bastos, V. Da Silva Quaresma, and F. V. Vieira. 2020. “The Use of Benthic Terrain Modeler (BTM) in the Characterization of Continental Shelf Habitats.” Geo-Marine Letters 40 (6): 1087–1097. doi:https://doi.org/10.1007/s00367-020-00642-y.
- DeVries, T., M. Holzer, and F. Primeau. 2017. “Recent Increase in Oceanic Carbon Uptake Driven by Weaker Upper-ocean Overturning.” Nature 542 (7640): 215–218. doi:https://doi.org/10.1038/nature21068.
- Diesing, M., and T. Thorsnes. 2018. “Mapping of Cold-water Coral Carbonate Mounds Based on Geomorphometric Features: An Object-based Approach.” Geosciences (Switzerland) 8: 2. doi:https://doi.org/10.3390/geosciences8020034.
- European Environment Agency. 2018. “Climate Change and Water — Warmer Oceans, Flooding and Droughts.” Eea Signals (Issue 1). doi:https://doi.org/10.2800/52469.
- Fakiris, E., P. Blondel, G. Papatheodorou, D. Christodoulou, X. Dimas, N. Georgiou, S. Kordella, et al. 2019. “Multi-frequency, Multi-sonar Mapping of Shallow Habitats-efficacy and Management Implications in the National Marine Park of Zakynthos, Greece.” Remote Sensing 11 (4): 461. doi:https://doi.org/10.3390/rs11040461.
- Fornos, J. J., and W. M. Ahr. 1997. “Temperate Carbonates on a Modern Low-energy, Isolated Ramp: The Balearic Platform.” Journal of Sediment Researh 67 ((2)): 364–373. doi:https://doi.org/10.1306/D4268572-2B26-11D7-8648000102C1865D.
- Gardner, J. V., P. Dartnell, L. A. Mayer, and J. E. Hughes Clarke. 2003. “Geomorphology, Acoustic Backscatter, and Processes in Santa Monica Bay from Multibeam Mapping.” Marine Environmental Research 56 (1–2): 15–46. doi:https://doi.org/10.1016/S0141-1136(02)00323-9.
- Gebco, C. G. 2019. “General Bathymetric Chart of the Oceans (GEBCO).” doi:https://doi.org/10.5285/836f016a-33be-6ddc-e053-6c86abc0788e.
- Georgian, S. E., W. Shedd, and E. E. Cordes. 2014. “High-resolution Ecological Niche Modelling of the Cold-water Coral Lophelia Pertusa in the Gulf of Mexico.” Marine Ecology Progress Series 506: 145–161. doi:https://doi.org/10.3354/meps10816.
- Hobson, R. D. 1972. “Surface Roughness in Topography: Quantitative Approach.” In Spatial Analysis in Geomorphology, edited by R. J. Chorley, 221–245.
- Ierodiaconou, D., S. Burq, M. Reston, and L. Laurenson. 2007. “Marine Benthic Habitat Mapping Using Multibeam Data, Georeferenced video and Image Classification Techniques in Victoria, Australia.” Journal of Spatial Science 52 (1): 93–104. doi:https://doi.org/10.1080/14498596.2007.9635105.
- Kongsberg. 2006. “EM 3002 Multibeam Echo Sounder: The New Generation High Performance Shallow Water Multibeam. 3000–3003.” https://www.km.kongsberg.com/ks/web/nokbg0397.nsf/AllWeb/7C8510CFA3CD21ABC1256CF00052DD1C/$file/164771ae_EM3002_Product_spec_lr.pdf
- Lamarche, G., X. Lurton, A. L. Verdier, and J. M. Augustin. 2011. “Quantitative Characterisation of Seafloor Substrate and Bedforms Using Advanced Processing of Multibeam backscatter-Application to Cook Strait, New Zealand.” Continental Shelf Research 31 (2SUPPL): 93–109. doi:https://doi.org/10.1016/j.csr.2010.06.001.
- Lecours, V., V. L. Lucieer, M. F. J. Dolan, A. Micallef, V. L. Lucieer, A. Micallef, M. F. J. Dolan, and A. Micallef 2015, June. “An Ocean of Possibilities: Applications and Challenges of Marine Geomorphometry.” Geomorphometry 23–26.
- Lucatelli, D., E. R. Goes, C. J. Brown, J. F. Souza-Filho, E. Guedes-Silva, and T. C. M. Araújo. 2019. “Geodiversity as an Indicator to Benthic Habitat Distribution: An Integrative Approach in a Tropical Continental Shelf.” Geo-Marine Letters. doi:https://doi.org/10.1007/s00367-019-00614-x.
- Lucieer, V., and G. Lamarche. 2011. “Unsupervised Fuzzy Classification and Object-based Image Analysis of Multibeam Data to Map Deep Water Substrates, Cook Strait, New Zealand.” Continental Shelf Research 31 (11): 1236–1247. doi:https://doi.org/10.1016/j.csr.2011.04.016.
- Lucieer, V., and H. Pederson. 2008. “Linking Morphometric Characterisation of Rocky Reef with Fine Scale Lobster Movement.” ISPRS Journal of Photogrammetry and Remote Sensing 63 (5): 496–509. doi:https://doi.org/10.1016/j.isprsjprs.2008.01.003.
- Lundblad, E. R., D. J. Wright, J. Miller, E. M. Larkin, R. Rinehart, D. F. Naar, B. T. Donahue, S. M. Anderson, and T. Battista. 2006. “A Benthic Terrain Classification Scheme for American Samoa.” Marine Geodesy 29 (2): 89–111. doi:https://doi.org/10.1080/01490410600738021.
- Lv, G., L. Xiong, M. Chen, G. Tang, Y. Sheng, X. Liu, Z. Song, et al. 2017. “Chinese Progress in Geomorphometry.” Journal of Geographical Sciences 27 (11): 1389–1412. doi:https://doi.org/10.1007/s11442-017-1442-0.
- Maestro, A., F. Bohoyo, J. López-Martínez, J. Acosta, M. Gómez-Ballesteros, E. Llave, A. Muñoz, P. G. Terrinha, M. Dominguez, and F. Fernández-Sáez. 2015. “The influence of tectonic and volcanic processes on the morphology of the Iberian continental margins | Influencia de los procesos tectónicos y volcánicos en la morfología de los márgenes continentales ibéricos.” Boletin Geologico y Minero 126 (2–3): 427–482.
- Maestro, A., J. López-Martínez, E. Llave, F. Bohoyo, J. Acosta, F. J. Hernández-Molina, A. Muñoz, and G. Jané. 2013. “Geomorphology of the Iberian Continental Margin.” Geomorphology 196: 13–35. doi:https://doi.org/10.1016/j.geomorph.2012.08.022.
- Micallef, A., T. P. Le Bas, V. A. I. Huvenne, P. Blondel, V. Hühnerbach, and A. Deidun. 2012. “A Multi-method Approach for Benthic Habitat Mapping of Shallow Coastal Areas with High-resolution Multibeam Data.” Continental Shelf Research 39–40 (January): 14–26. doi:https://doi.org/10.1016/j.csr.2012.03.008.
- Miller, H., J. M. Bull, C. J. Cotterill, J. K. Dix, I. J. Winfield, A. E. S. Kemp, and R. B. Pearce. 2013. “Lake Bed Geomorphology and Sedimentary Processes in Glacial Lake Windermere, UK.” Journal of Maps 9 (2): 299–312. doi:https://doi.org/10.1080/17445647.2013.780986.
- Novaczek, E., R. Devillers, and E. Edinger. 2019. “Generating Higher Resolution Regional Seafloor Maps from Crowd-sourced Bathymetry.” PLoS ONE 14 (6): 6. doi:https://doi.org/10.1371/journal.pone.0216792.
- Passaro, S., S. Tamburrino, M. Vallefuoco, S. Gherardi, M. Sacchi, and G. Ventura. 2016. “High-resolution Morpho-bathymetry of the Gulf of Naples, Eastern Tyrrhenian Sea.” Journal of Maps 12 (sup1): 203–210. doi:https://doi.org/10.1080/17445647.2016.1191385.
- Plets, R., A. Clements, R. Quinn, J. Strong, J. Breen, and H. Edwards. 2012. “Marine Substratum Map of the Causeway Coast, Northern Ireland.” Journal of Maps 8 (1): 1–13. doi:https://doi.org/10.1080/17445647.2012.661957.
- Prado, E., A. Rodríguez-Basalo, A. Cobo, P. Ríos, and F. Sánchez. 2020. “3D Fine-scale Terrain Variables from Underwater Photogrammetry: A New Approach to Benthic Microhabitat Modeling in A Circalittoral Rocky Shelf.” Remote Sensing 12 (15): 2466. doi:https://doi.org/10.3390/RS12152466.
- Prampolini, M., P. Blondel, F. Foglini, and F. Madricardo. 2018. “Habitat Mapping of the Maltese Continental Shelf Using Acoustic Textures and Bathymetric Analyses.” Estuarine, Coastal and Shelf Science 207 (June): 483–498. doi:https://doi.org/10.1016/j.ecss.2017.06.002.
- Rengstorf, A. M., C. Yesson, C. Brown, and A. J. Grehan. 2013. “High-resolution Habitat Suitability Modelling Can Improve Conservation of Vulnerable Marine Ecosystems in the Deep Sea.” Journal of Biogeography 40 (9): 1702–1714. doi:https://doi.org/10.1111/jbi.12123.
- Rowden, A. A., O. F. Anderson, S. E. Georgian, D. A. Bowden, M. R. Clark, A. Pallentin, and A. Miller. 2017. “High-resolution Habitat Suitability Models for the Conservation and Management of Vulnerable Marine Ecosystems on the Louisville Seamount Chain, South Pacific Ocean.” Frontiers in Marine Science 4 (OCT). doi:https://doi.org/10.3389/fmars.2017.00335.
- Vargas Yánez, M., M. C. García Martínez, F. Moya Ruiz, J. L. López-Jurado Marqués, M. Serra Tur, R. Santiago Domenech, and R. Balbín Chamorro 2020, August. “The Present State of Marine Ecosystems in the Spanish Mediterranean in a Climate Change Context, 185.” https://www.adaptecca.es/sites/default/files/documentos/spanish_mediterranean_climate_change_2019.pdf
- Walbridge, S., N. Slocum, M. Pobuda, and D. J. Wright. 2018. “Unified Geomorphological Analysis Workflows with Benthic Terrain Modeler.” Geosciences (Switzerland) 8: 3. doi:https://doi.org/10.3390/geosciences8030094.
- Weatherall, P., K. M. Marks, M. Jakobsson, T. Schmitt, S. Tani, J. E. Arndt, M. Rovere, D. Chayes, V. Ferrini, and R. Wigley. 2015. “A New Digital Bathymetric Model of the World’s Oceans.” Geographical Research Letters. doi:https://doi.org/10.1002/2015EA000107.Received.
- Weiss, A. D. 2001. “Topographic Positions and Landforms Analysis.” Proceedings of the 21st Annual ESRI User Conference.
- Wilson, M. F. J., B. O’Connell, C. Brown, J. C. Guinan, and A. J. Grehan. 2007. “Multiscale Terrain Analysis of Multibeam Bathymetry Data for Habitat Mapping on the Continental Slope.” Marine Geodesy 30 (1–2): 1–2. doi:https://doi.org/10.1080/01490410701295962.
- Wright, D. J., M. Pendleton, J. Boulware, S. Walbridge, B. Gerlt, D. Eslinger, D. Sampson, and E. Huntley. 2012. ArcGIS Benthic Terrain Modeler (BTM). Oregon State University, Davey Jones Locker Seafloor Mapping/Marine GIS Laboratory and NOAA Coastal Services Center.
- Zhu, A. X., F. H. Zhao, P. Liang, and C. Z. Qin. 2020. “Next Generation of GIS: Must Be Easy.” Annals of GIS 1–16. doi:https://doi.org/10.1080/19475683.2020.1766563.