
 ?Mathematical formulae have been encoded as MathML and are displayed in this HTML version using MathJax in order to improve their display. Uncheck the box to turn MathJax off. This feature requires Javascript. Click on a formula to zoom.
ABSTRACT
Worldwide bike-sharing systems are growing in popularity as an alternative, environmentally friendly mode of transportation. As cities seek to further develop bike-sharing programmes, it is important to consider how systems should expand to simultaneously address existing inequalities in accessibility, and best serve demand. In this paper, we determine ideal locations for future bike-sharing stations in Glasgow, Scotland, by integrating demand modelling with accessibility considerations. We began by analysing the spatio-temporal trends of bike-sharing usage, and assessed the spatial equity of access to stations in Glasgow. To identify important determinants of bike-sharing demand, we ran an ordinary least squares regression model using bike sharing trip data from Nextbike Glasgow. We then quantifiably measured the level of spatial accessibility to stations by applying the two-step floating catchment area (2SFCA) methodology and ran a GIS weighted overlay analysis using the significant determinants of station demand. Lastly, we combined the demand and accessibility results to determine where new stations should be located using a maximum covering location problem (MCLP) that maximized the population served. Our results show that distance from transit stations, distance from downtown, employment rates, and nearby cycling lanes are significant factors affecting station-level demand. Furthermore, levels of spatial access were found to be highest primarily in the centre and eastern neighbourhood of Glasgow. These findings aided in determining areas to prioritize for future station locations, and our methodology can easily be applied to other bike-share programmes with adjustments according to varying aims for system expansion.
1. Introduction
Worldwide bike-sharing systems are growing in popularity as an alternative, environmentally friendly mode of transportation. Despite the widely-established benefits of bike-sharing systems, the usage and growth of bike-sharing has varied worldwide. Currently, China has by far the largest bike-sharing programmes in terms of the number of bikes, while the U.S. is the country with the most bike-sharing programmes (O’Brien Citation2020). Yet, daily bike usage rates have been found to be considerably lower on average in American and Australian cities, as compared to many European cities (National Association of City Transportation Officials 2019; Médard de Chardon, Caruso, and Thomas Citation2017).
The city of Glasgow introduced its bike-sharing system, operated by NextBike, in July of 2014. Over the first two years of operation, the programme had close to 200,000 trips (McPherson Citation2017), and since 2014, usage has steadily increased as more stations have been regularly added. However, as cities like Glasgow seek to further develop bike-sharing programmes, it is important to consider how best to expand, given the different ways the success of a system can be measured.
Evidently, it is possible to have a bike-sharing system that can be considered monetarily successful while not socially or spatially equitable. Vice versa, a system that is more equitable may not have long-term sustainability if demand is not met. As such, it makes sense that bike-sharing systems are first implemented in areas of high density (i.e. around the city centre). However, once this has been established, as is the case in Glasgow, considering both accessibility and demand factors when assessing expansion options is an important step towards simultaneously achieving a more equitable and profitable system. In the existing literature, most studies focusing on siting bike-sharing station locations do not jointly consider the factors of equity and demand. The obvious next step is to consider equity and demand jointly to site new bike-sharing station locations in Glasgow.
The overarching goal of this research is to determine optimal locations for future bike-sharing stations in Glasgow by integrating demand modelling with spatial accessibility considerations. We begin by outlining a review of existing literature related to bike-sharing determinants of demand and equity considerations. Exploratory data analysis has been used to understand the development of the Glasgow NextBike system spatially and temporally. Furthermore, the overall equity of spatial accessibility to bike-sharing stations has been analysed. Lastly, we use the regression analysis to determine important determinants of station demand, and utilize a spatial optimization technique to locate future stations. This combination of methodologies is the first of its kind within the literature of bike-share station siting, and its comprehensive approach provides useful application to bike-sharing companies and urban planners.
2. Background
2.1 Determinants of bike-sharing demand
Many factors affecting bike-sharing demand have been identified in previous research, including transportation infrastructure, built environment, socio-economic factors, and human behaviours. Studies show that the frequency of bike-sharing usage increases when more cycling infrastructure (i.e. bicycle lanes) and bike-sharing facilities (i.e. stations and their capacities) are available near a bike-sharing station (Bachand-Marleau, Lee, and El-Geneidy Citation2012; Wang et al. Citation2016; Faghih-Imani et al. Citation2014). In addition, convenience is one of the main motivations for using public bikes to solve the ‘last-mile’ transit problem (Bachand-Marleau, Lee, and El-Geneidy Citation2012; Fishman 2012). For example, in a survey conducted among bike-sharing users in Melbourne, ‘convenience’ was the top reason for using the programmes, accounting for 24% of responses, followed by being ‘close to public transport’ (14%) and ‘close to work’ (10%) – both of which could also be classified under convenience (Fishman 2012). In regard to multi-modal trips, a survey completed by bike-sharing users in Montreal, showed that users mostly use bike-sharing in combination with the metro (compared with other modes of transportation) (Bachand-Marleau, Lee, and El-Geneidy Citation2012). Researchers have also found that the farther the distance between a bike-sharing station and the central business district, the lower the bike-sharing usage (Faghih-Imani et al. Citation2014).
Considering natural environment variables, slope is an important factor affecting bicycle usage. When slopes are more than 4%, bike-sharing usage usually declines (Lu, Scott, and Dalumpines Citation2018). An investigation of bike-sharing route choices in Canada using GPS data showed that users will take longer trips on 2–4% gradients in order to avoid steeper slopes (Lu, Scott, and Dalumpines Citation2018). Bike-sharing stations at higher elevations also tend to have lower demand, and in particular, lower return rates (Faghih-Imani et al. 2017; Sun, Chen, and Jiao Citation2018).
Several studies have indicated that some socio-demographic factors, such as age, income and education have a strong correlation with bike-sharing usage. Specifically, Rixey(Rixey Citation2013) used regression analysis to study the impact of different factors on the average monthly bike-sharing usage in three different cities in the United States. (Rixey Citation2013) concluded that median income and education level, as well as population and employment density are all positively correlated with bike-sharing usage. A regression analysis conducted by Chen et al. (Citation2020) had similar conclusions, however, also highlighted the importance of age; younger age-groups are more likely to use bike-sharing – something also consistently shown in other studies (Fishman et al. Citation2015; Wang et al. Citation2016).
Lastly, there are conflicting findings surrounding the impact of car ownership on bike-sharing. Surprisingly, some studies have found a positive correlation with car ownership (Buck and Buehler Citation2012; Shaheen et al. Citation2011), while other research has shown no correlation (Chen et al. Citation2020), indicating that its impact needs to be further investigated.
2.2 Equity
Equity within the field of transportation at large can be defined in a number of different ways. A commonly cited way of evaluating equity is in terms of horizontal equity and vertical equity (Bhuyan et al. Citation2019; Chen et al. Citation2019; Litman Citation2002), where horizontal equity can be thought of as spatial equity, and vertical equity as social equity. Achieving horizontal equity in the context of bike-sharing would mean that stations (and available bikes) are equally distributed geographically to individuals/groups across a service area with a consideration of population density. Vertical equity implies that overall inequalities across social groups are compensated for, and disadvantaged groups are prioritized. Bike-sharing research surrounding vertical equity is concerned with identifying which groups are using the system, and identifying barriers to bike-sharing usage (e.g. cost, disabilities, education etc.) to determine disadvantaged groups (Hosford and Winters Citation2018; McNeil, Broach, and Dill Citation2018.; Nickkar et al. Citation2018). Due to the limited available data from NextBike in Glasgow (no socio-demography information collected), in this analysis, we will focus on assessing equity through analysis of spatial accessibility.
Horizontal equity in bike-sharing systems may not be easily achieved due to the development of city centres and peripheral areas, and the resulting differences created in spatial proximity between centres and peripheries (Martens, Golub, and Robinson Citation2012). In a majority of US cities, station density, as well as ridership, was found to decrease as distance from the city centre increases (National Association of City Transportation Officials 2015). This consequently leads to more deprived economic areas having low to no access to bike-sharing. For example, Smith et al.(Citation2015) examined bike-sharing spatial equity across 35 cities in the US by comparing social and economic characteristics of census blocks within and outside of bike-sharing service areas. Their findings show that a majority of stations are located in areas that are most advantaged, with only 5% of stations in the most disadvantaged areas (Smith, Oh, and Lei Citation2015). Hosford and Winters(Citation2018) found similar findings across five different bike-sharing programmes in Canada. However, there is also research suggesting that ridership from residents living in more deprived areas may increase if there is greater accessibility. In 2012, the London bike-sharing system extended its service area to more deprived neighbourhoods. Goodman and Chesire (Citation2014) found that in the wake of this expansion, the percentage of trips made by users from highly deprived areas increased from 6% to 12%, and that this change held despite the price for a single trip also doubling in 2013 from one pound to two pounds.
Although a number of researchers have examined the effects of spatial inequities, there is notably less research surrounding methodologies to apply equity considerations to site-suitability analysis for new stations. Employing solely a location coverage model to determine station placement, with the goal of maximizing coverage or minimizing impedance, does not consider equity across the population served. In order to address equity gaps, Bhuyan et al.(Citation2019) developed a bike equity index, combining factors (including age, race, income and access to a car) to categorize areas into high/low/medium need, and then assess coverage by category. Yet, this methodology only points to general areas and lacks any consideration of demand – an important step to becoming a politically and financially viable methodology. Conrow et al. (Citation2018) did incorporate demand by using a location coverage model to assess how stations can be configured in order to maximize the population served given certain equity constraints: no user has to walk more than 0.5 miles to a station, and stations are no more than 1 mile apart. However, Conrow et al. (Citation2018) only considered demand in terms of the existing cycling lane infrastructure and the residential population served. Therefore, other important demand factors are excluded, and the authors choose to site stations only where cycling infrastructure is present, which they acknowledged as a limiting factor if the infrastructure is not equitably distributed across the study area.
To date, most studies focusing on siting bike-sharing station locations do not jointly consider the factors of equity and demand. Our project aims to do so by identifying areas of lower bike-sharing accessibility, along with areas of potential for high demand, in order to determine new suitable locations for stations in Glasgow.
3. Study area and data
3.1 Study area
Our study area is Glasgow – the largest city in Scotland, with a population of around 626,000 (see ). Glasgow also has the second highest percentage of deprived areas in Scotland; within Glasgow, almost half of residents live in the 20% most deprived areas in Scotland (Scottish Government Citation2020).
Figure 1. Study area (shown in grey) in Glasgow, Scotland.
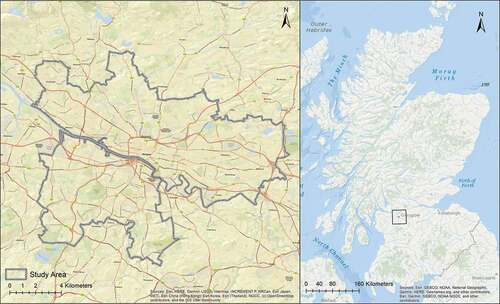
(. Study area (shown in grey) in Glasgow, Scotland.)
Cycling as a primary mode of transportation in Glasgow is relatively low – estimated at 1.9% in 2015 (Cycling Scotland Citation2017). However, the city is seeking to promote cycling and the Nextbike bike-sharing system. In 2017, the Glasgow City Council agreed to expand the Nextbike system, increasing the number of bikes to 900, and the number of stations to 100 over a seven-year period (McPherson Citation2017). Currently, the Nextbike system has 63 active stations, 16 of which also have E-bikes for rent. The pricing scheme for standard bikes offers a £1 per 30 minutes pay-as-you-go option, as well as monthly and annual memberships (£10 per month and £60 per year), where rentals of 30 minutes or less are free.
3.2 Data sources and data cleaning
We obtained one year of Nextbike trip data (30 August 2018 to 29 August 2019) from the Glasgow City Council. We also obtained a list of stations, their capacities and locations. Due to inconsistencies in the naming of stations between the two files, we only included trips from stations that were present in both the stations list and the trip data. Trips with missing start and end stations were also excluded. To focus on the current active stations, we removed trips from two stations that had very few total trips (<200) and no trips during the past several years. Lastly, we removed trips that had the same starting and end station and had a duration of three minutes or less. This was done in order to avoid double counting of instances where a user returns the bike (e.g. due to a bike malfunction), and uses another bike for their trip. After cleaning the data, the number of trips totalled 751,571 and the total number of stations was reduced to 63. The entirety of our data cleaning process is summarized in .
Figure 2. Data cleaning flowchart.
(. Data cleaning flowchart.)
For analysis of spatial equity, we used the 2020 Scottish Index of Multiple Deprivation (Scottish Index of Multiple Deprivation Citation2020). The SIMD overall ranking provides a measure of deprivation for each data zone; it is a combination of income, geographic accessibility, health, employment, education, housing and crime rankings. Data zones are groupings of Census output areas with populations between 500 and 1000 residents, and are the standard small area statistical geography unit in Scotland.
For the demand analysis, we used the trip data from 30 August 2018 to 29 August 2019 for a total of 62 stations. One station, Riverside Museum, was removed since it had no trips recorded until July 2019. For our analyses, we selected 11 independent variables – shown in – which were a mixture of socio-demographic factors and built environment factors based on previous studies. We used road network data, including cycling lanes, from Open Street Map (OpenStreetMap, Citation2020). For socio-demographic data, we used the 2020 SIMD data, and for factors not available in the SIMD dataset, we used the 2011 Census data (Scotland’s Census, Citation2011). The 2011 Census data used included the percentage of households without a car, and the percentage of the population aged 16–34 by output area. We again used the Open Street map data, and 2011 Census data for our final maximum covering location problem (MCLP) model.
Table 1. Summary statistics of independent variables
(. Summary statistics of independent variables.)
For each of the area-based variables, we used the Zonal Statistics tool in ArcGIS to calculate the mean value a defined station buffer. We selected a 300 m buffer for each of the sociodemographic variables, as it represents the expected distance people are typically willing to walk to use a bike-sharing service (National Association of City Transportation Officials 2015). However, the expected walking distance to transit stations is slightly higher at around 400 m (National Association of City Transportation Officials Citation2015); therefore, we considered the presence of a transit station within a 400 m buffer. A slightly larger buffer area of 500 m was also used for the slope and cycling lane variables in order to capture more of the area that users may bike on once they rent a bike.
4. Methodology
We used a multi-step approach in order to achieve our final goal of siting new station locations. The main steps of our approach are displayed in the flow-chart in . Following an exploratory data analysis of the trips datasets, our methodology is split into demand analysis and accessibility analysis.
Figure 3. Methodology framework.
(. Methodology framework.)
In terms of assessing spatial equity, we first quantified overall spatial equity by comparing the distribution of SIMD 2020 overall ranking levels within the Nextbike service area to the entire Glasgow City Council area. Secondly, to assess spatial equity in terms of the number of bikes available and the population served by stations across Glasgow, we used the two-step floating catchment area (2SFCA) methodology to calculate spatial accessibility scores by data zone. The 2SFCA methodology was originally developed by Luo and Wang, Citation2003 to assess access to health care services. In the case of health care services, the 2SFCA methodology assesses accessibility based on the ratio of healthcare providers to the population served. We adapted the 2SFCA methodology by considering the station capacity in place of the number of healthcare providers. Although there are many other types of accessibility indices, the 2SFCA methodology has the advantage of providing an easily interpretable measure of accessibility.
In order to determine the factors affecting ridership in Glasgow, we ran an ordinary-least squares regression model, focusing on trip generation. The dependent variable was the total number of departing trips per station for a one-year period: 30 August 2018 to 29 August 2019. Given the regression results, we generated bike-sharing demand scores for the Glasgow area. To do so, we used a weighted raster-based GIS suitability analysis. This is a commonly used method for determining potential bike-sharing ridership, previously employed in feasibility studies conducted by both local governmental authorities and academic researchers (Jehn, Atiquzzaman, and LaMondia Citation2018; Murphy et al. Citation2013). In a weighted-overlay method, raster layers for selected criteria are weighted and then overlaid to combine the criteria to a single layer/map. For our analysis, we selected criteria based on the factors found significant in the regression model to determine high/low demand areas.
Finally, in order to find exact new station locations given the weighted overlay and accessibility results, we employed a location analysis by using MCLP. MCLP is an effective spatial optimization methodology for selecting a specified number of facilities from possible candidate locations to serve the most demand points (population).
5. Analysis
5.1 Assessment of overall spatial equity
We used the SIMD 2020 overall rankings for Scotland to create a quintile ranking for the area of Glasgow, where 1 indicates areas that are most deprived and 5 indicates areas that are least deprived. We categorized the SIMD overall rankings into quintiles as follows: 1 = 0 to 424, 2 = 425 to 1209, 3 = 1210 to 2504, 4 = 2505 to 4624, 5 = 4625 to 6957).
We defined the bike-sharing service area by using a 500 m Euclidean distance buffer from each station. Therefore, if a SIMD data zone fell within the 500 m buffer, it was included as part of the area served. Commonly used buffer distances in previous bike-sharing research range from 200 to 1000 m (Eren and Uz Citation2019). However, we selected 500 m as a maximum realistically convenient walking distance. Following the service area analysis, we calculated the proportion of data zones that were within the buffer area for each quintile. This methodology is similar to studies conducted by Hosford and Winters(Citation2018) and Smith et al.(Citation2015).
5.2 Assessment of spatial access to bike-sharing across Glasgow
The methodology for calculating the 2SFCA accessibility indices can be separated into two main steps. Firstly, we generated 500 m service areas around each bike-sharing station and sum up the population points (demand) served around each station. We then calculated , the ratio of bikes to population served at station j (see Equationequation (1)
(1)
(1) ):
where is the capacity for station j (i.e. the maximum number of available bikes),
is the total population that falls within the catchment area, defined by the threshold distance
, and
is the distance between station j and population point k. It is worth nothing that the station capacity does not represent the number of bike available in real-time but the original station capacity.
Secondly, we generated 500 m services areas from the demand points in each data zone. The demand points were generated by converting data zones to centroid points based on the SIMD 2020 population by data zone. We then calculated the accessibility index for each data zone, by summing up the previously calculated ratios of bikes to population that fall within the catchment area. The final accessibility measure is defined as Equationequation (2)(2)
(2) :
where is the availability of bikes to demand ratios that fall within the catchment area of the data zone centroid i, and
is the distance between data zone centroid i and the station j.
5.3 Analysis of demand: linear regression model
The distribution of station ridership is skewed, such that a majority of stations have less than 6000 total trips, however, a few stations have higher ridership. We, therefore, used a log-transformation of the station ridership variable in our analysis.
Due to the fact that our sample size is relatively small, with only 62 stations, it was necessary to reduce the number of variables for the regression model to prevent overfitting of the model. To do so, we began with a lasso regression, which is useful for identifying less important features that can be dropped. By including all 11 variables in a lasso regression model, the coefficients for five variables – the job density, slope, no car percentage, income deprivation and presence of a nearby transit station – were all reduced to zero and dropped from the model. We confirmed that these features should be removed through a correlation analysis and by examining scatterplots. The age variable had a moderately high correlation with the distance from downtown (−0.68), and the employment deprivation rate (0.64). Therefore, we removed age from the lasso regression model thereby limiting overfitting of the model.
For comparison purposes, we built a second model using a stepwise regression method using AIC criterion. Lastly, to further verify the significance of the variables, we ran a stepwise regression model with the three ‘outlier stations’ removed – the three stations with the highest number of trips.
5.4 Demand-based site-suitability analysis
We selected the factors that were found to be significant in the regression model to perform the site-suitability analysis in ArcGIS. We first converted each of the layers to a raster layer and then reclassified the layers to transform the different factors to a common scale from 1 to 9, where 1 represents lowest demand and 9 represents highest demand. We then assigned percentage weights to each layer – signifying the importance of each factor – whereby the sum of the assigned weights totals 100%. Lastly, we used the weighted sum function to combine the layers; we produced the demand suitability map by reclassifying the weighted sum values on a scale from 1 to 5 using equal interval classification, where 1 represents the lowest demand and 5 represents the highest demand.
5.5 Location analysis for new station siting
We fixed the existing bike share stations and determined the exact sites for new stations by applying the MCLP. Given the existing locations, the MCLP determines the optimal locations for a specified number of new facilities, such that the total demand served (i.e. population) is maximized. Demand served is defined by a set impedance cut-off: a specified threshold of travel time or distance from each station. The mathematical representation for the MCLP in determining optimal station locations is as follows (Church and Murray Citation2009).
Considerthefollowingnotations:
= service demand in unit
The objective, (3), is to maximize the amount of covered demand for bike sharing. Constraints (4) define whether coverage has been provided to a given demand based upon the location decisions. Constraints (5) specify that
facilities (bike sharing stations) will be located. Integer restrictions on the siting and coverage variables are stipulated in constraints (6) and (7).
In the empirical analysis, we used ArcGIS’s Network Analyst extension to solve the MCLP. The ArcGIS Network Analyst uses a heuristic to generate near-optimal results (a vertex substitution heuristic (Teitz and Bart Citation1968)). We created a network dataset in ArcGIS using the road network from Open Street Map. Our incorporation of demand-based suitability alongside accessibility factors related to our selection of candidate locations. We selected candidate locations from network road junctions that met the following criteria:
Junctions are in high suitable demand areas (score > 3 from the demand suitability analysis results, which corresponds to selecting 5.8% of the total Glasgow City Council area as the area of greatest demand)
Junctions are in low accessibility areas (score < 0.002 from the 2SFCA results, which corresponds to removing 7.9% of total Glasgow City Council area with the highest accessibility)
To generate demand points, we used the centroids of Census output areas, weighted by the 2011 Census population values. Given that Nextbike has previously added no more than 10 new stations over one calendar year, we ran the analysis to select 10 new locations as well as 5 new locations, given the 63 existing stations as fixed locations. We also set the impedance distance to 500 m, meaning that users are assumed to walk no more than 500 m to use the bike-sharing service. Ideally, the impedance value would equal 300 m, i.e. the expected distance people will walk to use a bike-sharing station. However, given the geographical inaccuracy from using polygon centroids as demand points, we set a slightly larger impedance value.
6. Results
6.1 Exploratory data analysis
shows the number of trips per month from September 2018 to August 2019. There was a total of 263,014 trips, compared to 163,629 in the previous twelve months (an increase of 61%). There is clear seasonal variation in the number of trips, with trips highest in the summer months and lowest in the winter months.
Figure 4. Trips per month from September 2018 to August 2019.
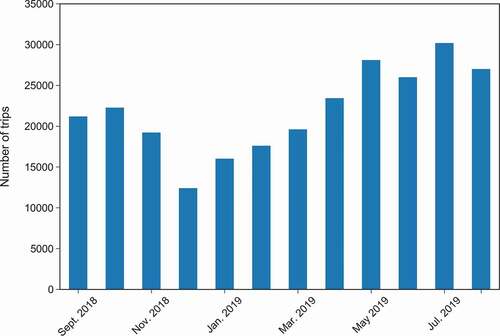
(. Trips per month from September 2018 to August 2019.)
shows the map of stations with the colour and size reflecting the total number of trips departing from each station for the most recent 12 months of trip data (30 August 2018 to 29 August 2019). The majority of the stations with the most trips are located near the downtown area, and conversely, the stations located on the periphery have the least number of trips. However, it is also notable that there are a number of stations in the West End area and Govan (areas that are more densely populated) that have between 6,000 and 10,000 trips. The two stations with the most departing trips are Broomielaw and St. Enoch Square – both located near the city centre and near the River Clyde.
Figure 5. Number of bike-sharing trips by station.
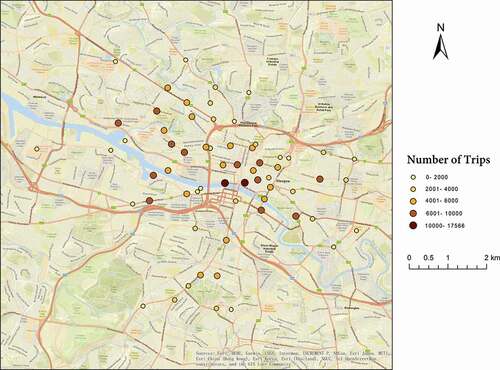
(. Number of bike-sharing trips by station.)
6.2 Assessment of overall spatial equity
shows the distribution of deprivation quintiles across the service area. If stations were equitably distributed spatially, we would expect the proportions across quintiles to be fairly equal, i.e. close to 20% for each quintile.
Figure 6. Quintile deprivation ranking by data zone in the Nextbike service area.
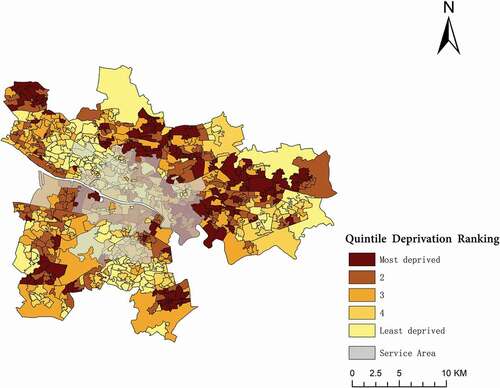
(. Quintile deprivation ranking by data zone in the Nextbike service area.)
shows that areas of lower deprivation do have better access to stations, with the 4th and 5th quintiles making up 51% of the data zones within the service area. The distribution could be considered relatively close to being balanced in comparison to the bike-sharing systems across Canada and the United States, where systems are significantly skewed towards serving advantaged neighbourhoods (Hosford and Winters Citation2018; Smith, Oh, and Lei Citation2015). Nevertheless, the results suggest that Nextbike could improve spatial equity of accessibility to stations by expanding to areas that are more deprived.
Table 2. The proportion of data zones inside the Nextbike service area by SIMD ranking
(. The proportion of data zones inside the Nextbike service area by SIMD ranking.)
6.3 Assessment of spatial access to bike-sharing across Glasgow
The results from the 2SFCA analysis are presented in . The areas of highest accessibility are present primarily in the city centre areas, however, there are also other areas of high accessibility present in neighbourhoods surrounding the city centre. The low population density and one station present in Drumoyne and Shieldhall makes the data zone have a high accessibility score. In this data zone, the 2SFCA method does not provide a completely accurate picture of accessibility. Areas of low accessibility that are nearby areas of high accessibility include Partick, Kelvingrove, Govan, Ibrox, Pollokshields and Woodside. These results suggest that the addition of stations in these neighbourhoods may be beneficial towards improving access, while still expanding outwards from the city centre.
Figure 7. Two-step floating catchment area accessibility scores by data zone.
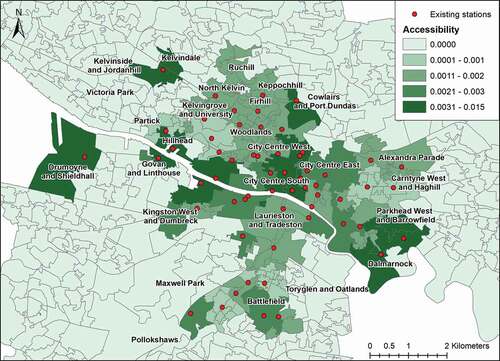
(. Two-step floating catchment area accessibility scores by data zone.)
6.4 Linear regression model
Based on the three regression models (the lasso-based regression, stepwise regression, and stepwise regression model with the three highest ridership stations removed), we selected the stepwise model as the best model given its slightly higher model fit and accuracy (Regression analysis code can be found at https://github.com/qszhao/BikeSharePaper2021). The linear regression results for the stepwise regression are presented in .
Table 3. Stepwise regression results
(. Stepwise regression results.)
The adjusted R2 value for the stepwise regression model is 0.415, meaning that 41.5% of the variation in ridership can be explained by the selected variables. All variables in the model are significant (the distance to the nearest transit station, the distance to downtown, the ratio of cycling lanes to streets, and the employment deprivation rate). These variables also match the variables found to be significant in the lasso regression. In the stepwise model with outlier stations removed, the same four variables remain significant, indicating that they remain important determinants of demand even when the outliers – all stations in Downtown – are removed. The signs for the coefficients are all as expected and consistent with results found in previous studies (see Section 2.1). Increases in the two distance-related variables are associated with decreases in ridership, while an increase in the percentage of cycling lanes is associated with an increase in ridership. The percentage of people employment-deprived is negatively correlated with ridership.
Overall, we can conclude from this regression analysis that in Glasgow, increased distances to public transit and the city centre are associated with lower bike-sharing demand. Additionally, bike-sharing ridership is significantly higher among populations that have fewer employment deprived residents, and in areas with a higher proportion of cycling lanes.
6.5 Site suitability analysis for new stations
Our GIS weighted overlay results are based on the four significant factors found in the regression model. In the overlay analysis, we assigned a weight of 30% to the percentage of cycling lanes, the employment deprivation rate, and the proximity to transit stations. The distance to downtown factor was assigned a lower weight of only 10% due to the fact the Downtown area already has many stations. We used the Euclidean distance tool for the distance to Downtown, creating buffer rings of 600 m, and the Network service area tool for the distance to transit stations with rings of 100 m. For the cycling lane factor, we calculated the ratio of the cycling lane distances to the total distance of all streets by data zone.
The bike-sharing demand map using the assigned weights is shown in . Many of the highest demand areas are located along the River Clyde. Other high-demand areas, with scores from 4 to 5, are scattered throughout other neighbourhoods, such as Maxwell Park, Battlefield and North Kelvin. However, there are several gaps in areas of high demand. For example, although the neighbourhoods of Ibrox, Govan and Linthouse are adjacent to the River Clyde, their demand scores are relatively low. Demand is also comparatively low to the north of the city centre (e.g. in Keppochhill, Cowlairs and Port Dundas).
Figure 8. Bike-sharing demand scores for the Glasgow City Council area.
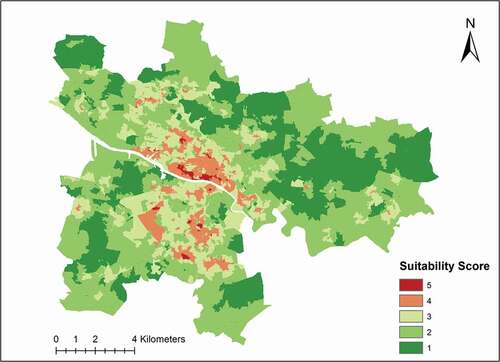
(. Bike-sharing demand scores for the Glasgow City Council area.)
6.6 Location analysis
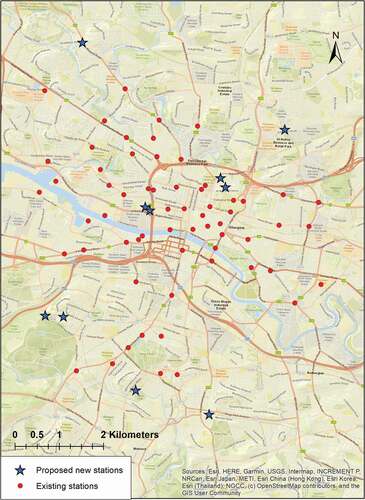
Our results for two MCLP models are shown in and . shows the results for candidate locations based on a consideration of 5 new stations and shows the results considering 10 new stations. In both results, the selected new station facilities expand the service area outwards slightly and also fill in some gaps in more central areas. When considering 10 new stations, in comparison with 5, the additional stations are primarily located west of the city centre.
Figure 9. Five proposed new station locations.
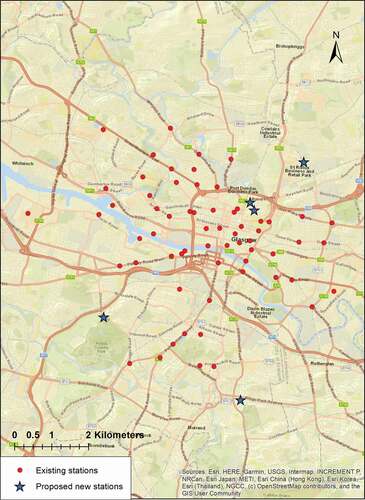
Figure 10. Ten proposed new station locations.
(. Five proposed new station locations)
(. Ten proposed new station locations.)
According to previous research, it is recommended that to increase ridership and system convenience, bike-sharing stations are located approximately 300 m apart across the service area (National Association of City Transportation Officials Citation2015). Therefore, for improved service, the outermost proposed locations could benefit from additional connecting stations.
7. Discussion
At the city scale, the proposed junction locations appear to provide useful and suitable options for Nextbike’s consideration. Further analysis may be done to determine if the exact locations are in fact feasible for construction, considering additional criteria such as slope and land usage. It is important to note that with the goal of maximizing coverage to serve the greatest population, areas of low-population density may remain excluded. The minimizing impedance function may be used to create a more spatially equitable uniform coverage of stations; however, it has previously been shown to lead to stations that are dispersed with unsuitable spacing in between stations (García-Palomares, Gutiérrez, and Latorre Citation2012). In our case, running the model with the goal of minimizing impedance also led to many isolated stations in peripheral areas. However, depending on priorities for expansion, further analysis may be done to focus more on serving lower-density areas, and on how these results would impact accessibility and coverage.
A main advantage of our methodology lies in the fact that the criteria and inputs of the model can be altered based on the company’s objectives for system expansion. For instance, for a greater emphasis on serving low accessibility areas, it is possible to consider only candidate junction locations that currently have zero accessibility to bike-sharing. On the other hand, the criteria for demand could be set to only the highest demand suitability scores for increased focus on ensuring high demand. For different expansion objectives, the weighting of demand factors in the overlay analysis can also be altered.
A primary limitation of this analysis is the use of data from the population of areas served. The impact of varying the set buffer distance has been acknowledged as a factor that has not yet been thoroughly investigated, but may significantly impact results (Eren and Uz Citation2019). Ideally, we would use NextBike user information or membership survey data, which would lead to more conclusive findings regarding the determinants of demand.
As mentioned previously, the regression analysis is also limited by the small sample size. With more stations, it would be possible to include more variables found significant in other studies, which would likely improve the explanatory power of the model. Certain variables not included in this analysis, but found significant in other studies, are job density, median income, and the proportion of commuters who take public transit, walk or bike to work (Rixey Citation2013). Road slope may also play an important role, but based on our buffer area analysis was found to be not significant. This can somewhat be attributed to the fact that existing stations have relatively flat surrounding areas; however, determining more conclusively the potential impact of slope would require further analysis of trips and route direction. The model could also be improved with more specific data (e.g. income, or percentage owning abicycle), as well as more recent data (i.e. the no car percentage, and percentage aged 16–34 from the 2011 Census).
Lastly, the weighted overlay results in Section 6 are determined by the four significant demand factors from the regression results. Similar to the regression model limitations, there are likely other potentially relevant factors excluded from this analysis (e.g. points of interest and employment centres). Nevertheless, the results can provide useful insight into potential areas of high and low demand.
8. Conclusion
Over the five years of bike-sharing service operation in Glasgow, usage has steadily increased; however, compared to other cities of similar size across the UK and Europe, the number of bike-sharing stations in Glasgow is relatively low (O’Brien Citation2020). In seeking to expand the system and increase its usage, it is vital that new stations are placed in areas of high demand to ensure financial success, while also ensuring expansion to areas with poorer access. In this project, we determined suitable locations for new bike-sharing station development in Glasgow with a multi-step approach. Our methods allowed for a way to incorporate spatial equity considerations and demand factors into spatial optimization modelling to site new stations. While our project focused on incorporating analysis of spatial accessibility, further research may be done to consider social equity and socio-demographic factors, allowing for an even more comprehensive assessment of bike-sharing services in Glasgow.
Conflicts of interest
No potential conflict of interest was reported by the author(s).
Acknowledgements
This research was made possible by the ESRC’s on-going support for the Urban Big Data Centre (UBDC) [ES/L011921/1 and ES/S007105/1]. The authors want to thank the Glasgow City Council and Nextbike for sharing their bike sharing dataset, as well as the anonymous reviewers for their insightful comments and suggestions on an earlier version of this manuscript.
Additional information
Funding
References
- Bachand-Marleau, J., Lee, B. H., & El-Geneidy, A. M. 2012. Better understanding of factors influencing likelihood of using shared bicycle systems and frequency of use. Transportation Research Record, 2314 (1): 66–71.
- Bhuyan, I. A., C. Chavis, A. Nickkar, and P. Barnes. 2019. “GIS-Based Equity Gap Analysis: Case Study of Baltimore Bike Share Program.” Urban Science 3 (2): 42. doi:https://doi.org/10.3390/urbansci3020042.
- Buck, D., and R. Buehler. 2012. Bike Lanes and Other Determinants of Capital Bikeshare Trips. In 91st Transportation research board annual meeting. In 91st transportation research board annual meeting.
- Chen, Z., Y. Guo, A. L. Stuart, Y. Zhang, and X. Li. 2019. “Exploring the Equity Performance of Bike-sharing Systems with Disaggregated Data: A Story of Southern Tampa.” Transportation Research Part A: Policy and Practice 130: 529–545. doi:https://doi.org/10.1016/j.tra.2019.09.048.
- Chen, Z., van Lierop, D., & Ettema, D. 2020. Dockless bike-sharing systems: what are the implications?. Transport Reviews, 40(3), 333-353.
- Church, R. L., and A. T. Murray. Business Site Selection, Location Analysis, and GIS. Hoboken, NJ: John Wiley & Sons 2009.
- Conrow, L., A. T. Murray, and H. A. Fischer. 2018. “An Optimization Approach for Equitable Bicycle Share Station Siting.” Journal of Transport Geography 69: 163–170. doi:https://doi.org/10.1016/j.jtrangeo.2018.04.023.
- Cycling Scotland. (2017). Annual Monitoring Report 2017.
- Eren, E., and V. E. Uz. 2019. “A Review on Bike-sharing: The Factors Affecting Bike-sharing Demand.” Sustainable Cities and Society 101882. doi:https://doi.org/10.1016/j.scs.2019.101882.
- Faghih-Imani, A., N. Eluru, A. M. El-Geneidy, M. Rabbat, and U. Haq. 2014. “How Land-use and Urban Form Impact Bicycle Flows: Evidence from the Bicycle-sharing System (BIXI) in Montreal.” Journal of Transport Geography 41: 306–314. doi:https://doi.org/10.1016/j.jtrangeo.2014.01.013.
- Fishman, E., S. Washington, and N. Haworth. 2012. “Barriers and Facilitators to Public Bicycle Scheme Use: A Qualitative Approach.” Transportation Research. Part F, Traffic Psychology and Behaviour 15 (6): 686–698. doi:https://doi.org/10.1016/j.trf.2012.08.002.
- García-Palomares, J. C., J. Gutiérrez, and M. Latorre. 2012. “Optimizing the Location of Stations in Bike-sharing Programs: A GIS Approach.” Applied Geography 35 (1): 235–246. doi:https://doi.org/10.1016/j.apgeog.2012.07.002.
- Goodman, A., and J. Cheshire. 2014. “Inequalities in the London Bicycle Sharing System Revisited: Impacts of Extending the Scheme to Poorer Areas but Then Doubling Prices.” Journal of Transport Geography 41: 272–279. doi:https://doi.org/10.1016/j.jtrangeo.2014.04.004.
- Hosford, K., and M. Winters. 2018. “Who are Public Bicycle Share Programs Serving? an Evaluation of the Equity of Spatial Access to Bicycle Share Service Areas in Canadian Cities.” Transportation Research Record 2672 (36): 42–50. doi:https://doi.org/10.1177/0361198118783107.
- Jehn, N., M. Atiquzzaman, and J. LaMondia. 2018. A GIS Performance Measure-based Methodology for Prioritizing Bike Share System Expansion. January 8.
- Litman, T. 2002. “Evaluating Transportation Equity.” World Transport Policy & Practice 8: 50–65.
- Lu, W., D. M. Scott, and R. Dalumpines. 2018. “Understanding Bike Share Cyclist Route Choice Using GPS Data: Comparing Dominant Routes and Shortest Paths.” Journal of Transport Geography 71: 172–181. doi:https://doi.org/10.1016/j.jtrangeo.2018.07.012.
- Luo, W., and F. Wang. 2003. “Measures of Spatial Accessibility to Health Care in a GIS Environment: Synthesis and a Case Study in the Chicago Region.” Environment and Planning. B, Planning & Design 30 (6): 865–884. doi:https://doi.org/10.1068/b29120.
- Martens, K., A. Golub, and G. Robinson. 2012. “A Justice-theoretic Approach to the Distribution of Transportation Benefits: Implications for Transportation Planning Practice in the United States.” Transportation Research Part A: Policy and Practice 46 (4): 684–695. doi:https://doi.org/10.1016/j.tra.2012.01.004.
- McNeil, N., J. Broach, and J. Dill. 2018. “Breaking Barriers to Bike Share: Lessons on Bike Share Equity.” ITE Journal (Institute of Transportation Engineers) 88: 31–35.
- McPherson, K. 2017. Glasgow’s Public Cycle Hire Scheme: Analysis of Usage between July 2014 and June 2016. Glasgow Centre for Population Health.
- Médard de Chardon, C., G. Caruso, and I. Thomas. 2017. “Bicycle Sharing System ‘Success’ Determinants.” Transportation Research Part A: Policy and Practice 100: 202–214. doi:https://doi.org/10.1016/j.tra.2017.04.020.
- Murphy, S., A. Buckley, A. Forsthoefel, M. Lindsay, G. Neeley, E. Wilk, and A. Williamson. 2013. Dayton Bikeshare Feasibility Study. Dayton: Bike Miami Valley.
- National Association of City Transportation Officials (NACTO). (2015) Walkable Station Spacing Is Key to Successful, Equitable Bike Share. NACTO Bike Share Equity Practitioners’ Paper #1.
- National Association of City Transportation Officials. (2019, April 17). 84 Million Trips Taken on Shared Bikes and Scooters Across the U.S. in 2018. National Association of City Transportation Officials.https://nacto.org/2019/04/17/84-million-trips-on-shared-bikes-and-scooters/ .
- Nickkar, A., C. Chavis, I. A. Bhutan, P. Barnes, and S. Grasso. 2018. Bicycle Justice or Just Bicycles? Analyzing Equity in Baltimore’s Bike Share Program. Department of Transportation and Urban Infrastructure at Morgan State University.
- O’Brien, O. (2020). Bike Share Map. Retrieved April 26, 2020, from 26 April 2020 https://oobrien.com/bikesharemap/
- OpenStreetMap. (2020). OpenStreetMap. Retrieved 12 September 2020, from https://www.openstreetmap.org/
- Rixey, R. A. 2013. “Station-Level Forecasting of Bikesharing Ridership: Station Network Effects in Three U.S. Systems.” Transportation Research Record 2387 (1): 46–55. doi:https://doi.org/10.3141/2387-06.
- Scotland’s Census. Scotlandscensus.gov.uk. (2011). Retrieved 12 September 2020, from https://www.scotlandscensus.gov.uk.
- Scottish Government. (2020, January 28). Scottish Index of Multiple Deprivation 2020. Retrieved April 26, 2020, from 26 April 2020 https://www.gov.scot/news/scottish-index-of-multiple-deprivation-2020/
- Scottish Index of Multiple Deprivation 2020. (2020). Retrieved 12 September 2020, from https://simd.scot/#/simd2020/BTTTFTT/9/-4.0000/55.9000/.
- Shaheen, S. A., H. Zhang, E. Martin, and S. Guzman. 2011. “China’s Hangzhou Public Bicycle: Understanding Early Adoption and Behavioral Response to Bikesharing.” Transportation Research Record 2247 (1): 33–41. doi:https://doi.org/10.3141/2247-05.
- Smith, C. S., J.-S. Oh, and C. Lei. 2015. Exploring the Equity Dimensions of US Bicycle Sharing Systems. Western Michigan University. Transportation Research Center for Livable Communities. doi:https://doi.org/10.13140/RG.2.2.30941.72163.
- Sun, F., P. Chen, and J. Jiao. 2018. “Promoting Public Bike-sharing: A Lesson from the Unsuccessful Pronto System.” Transportation Research Part D: Transport and Environment 63: 533–547. doi:https://doi.org/10.1016/j.trd.2018.06.021.
- Teitz, M. B., and P. Bart. 1968. “Heuristic Methods for Estimating the Generalized Vertex Median of a Weighted Graph.” Operations Research 16 (5): 955–961. doi:https://doi.org/10.1287/opre.16.5.955.
- Wang, X., Lindsey, G., Schoner, J. E., & Harrison ,A. 2016. Modeling bike share station activity: Effects of nearby businesses and jobs on trips to and from stations. Journal of Urban Planning and Development, 142 (1), 04015001.