
 ?Mathematical formulae have been encoded as MathML and are displayed in this HTML version using MathJax in order to improve their display. Uncheck the box to turn MathJax off. This feature requires Javascript. Click on a formula to zoom.
ABSTRACT
Since the Dartmouth Hospital Service Areas (HSAs) were proposed three decades ago, there has been a large body of work using the unit in examining the geographic variation in health care in the U.S. for evaluating health care system performance and informing health policy. However, many studies question the replicability and reliability of the Dartmouth HSAs in meeting the challenges of an ever-changing and a diverse set of health care services. This research develops a reproducible, automated, and efficient GIS tool to implement Dartmouth method for defining HSAs. Moreover, the research adapts two popular network community detection methods to account for spatial constraints for defining HSAs that are scale flexible and optimize an important property such as maximum service flows within HSAs. A case study based on the state inpatient database in Florida from the Healthcare Cost and Utilization Project is used to evaluate the efficiency and effectiveness of the methods. The study represents a major step towards developing HSA delineation methods that are computationally efficient, adaptable for various scales (from a local region to as large as a national market) and automated without a steep learning curve for public health professionals.
Introduction
Hospital Service Area (HSA) is a functional region within which patients receive most of their hospital care. The earliest undertaking of HSA delineation was the Dartmouth Atlas of Health Care Project in the early 1990s (Wennberg and Cooper Citation1998), commonly referred to as Dartmouth method. Delineation of HSAs is to define a reliable unit of analysis for examining the geographic variation of a health care system and needs to capture the actual health care market structure (Kilaru et al. Citation2015). Inadequate definition of an analysis unit affects the validity of findings based on data aggregated in such a unit, an issue related to the Modifiable Areal Unit Problem (MAUP) (Fotheringham and Wong Citation1991), or even worse, may lead to ill-conceived policy and planning strategy. The Dartmouth method has defined HSAs for local health care markets anchored by general hospitals, and Hospital Referral Regions (HRRs) for regional or tertiary health care markets anchored by specialized hospitals providing major cardiovascular procedures and neurosurgery. The two units are defined by similar processes. The task is identified as one of the major methodological challenges in public health naturally suited for GIS to tackle (Wang Citation2020, 7–8). This paper focuses on GIS-automated methods and only examines the HSA delineation.
The past 30 years have witnessed fruitful research of using the Dartmouth HSAs and HRRs to examine the magnitude and underlying causes of geographic variations in health care. Among recent studies, Schroeck et al. (Citation2014) evaluated regional variations in adherence to the quality measures for prostate cancer across HSAs to identify possible targets for future quality improvement. Ward et al. (Citation2014) examined how access to oncologists affected chemotherapies received by cancer patients across the HSAs in Iowa. Herrin et al. (Citation2016) applied HSAs to identify communities with high quality care in three settings of hospitals, nursing homes, and home health agencies. Rosenberg et al. (Citation2016) used the inpatient data from the Healthcare Cost and Utilization Project (HCUP) to analyse the variabilities of inpatient mortality, inpatient safety, and prevention outcomes at different levels and found substantial variations across HSAs. Most recently, HSAs are used to identify the shortage areas of bed supply of intensive care unit (ICU) and facilitate hospital coordination to mitigating the effects of Covid-19 pandemic on mortality rates (Kanter, Segal, and Groeneveld Citation2020). These findings across HSAs have greatly assisted the evaluation of health care system performance and informing efficient health policy (Institute of Medicine Citation2013) to target underserved areas and disadvantaged socioeconomic groups for improving the total population health in the U.S.
The core of the Dartmouth method is the plurality rule that ‘each ZIP Code was assigned on a provisional basis to the town containing the hospitals most often used by local residents’ (Wennberg and Cooper Citation1998, 252). The ZIP codes being assigned to the hospitals in the same town would form an HSA. Based on the 1992–1993 Medicare data, the Dartmouth method yielded 3,436 HSAs in the U.S. Despite its popularity, many studies question the replicability and reliability of the Dartmouth HSAs in meeting the challenges of an ever-changing and a diverse set of health care services. The Medicare data used to define HSAs only cover population over 65, which may not represent other age groups because of different utilization patterns (Guagliardo et al. Citation2004) and access to care (Kilaru et al. Citation2015). Also, it may obfuscate the definition of HSAs as some ill beneficiaries may use more inpatient care (Goodman et al. Citation2003). Moreover, the U.S. health care market has experienced significant changes since the early 1990s such as hospital closures, expansion, and new openings. Some HSAs are found to have no hospitals and some others are observed to lose a large proportion of patients who travel outside for health care (Mossanen et al. Citation2014). In addition, the definition of HSAs involves uncertainties, such as those decisions made by visual examination. This may limit automation and hinders a timely update of Dartmouth HSAs.
An earlier adjustment to the Dartmouth method was to assign minimal population, such as 1,000 to each service area when defining the Primary Care Service Areas (PCSAs) (Goodman et al. Citation2003). Another adjustment was made manually to define population-based HSAs for guiding Swiss health care planning (Klauss et al. Citation2005). However, these improvements still have uncertainties, are not automated and cannot easily be reproduced in other studies. Haynes, Wertli, and Aujesky (Citation2020) modified the Dartmouth method to delineate HSAs in Swiss by accounting for the orphan ZIP codes without any flows to any providers and the enclaved ZIP codes with distant flow to nonadjacent HSAs. It also implemented the rules that each HSA had 50% hospitalizations occurred locally and at least 10 hospitalizations occurred, but neither rule was specified in the original Dartmouth method.
A major recent methodological advancement in HSA delineation is informed by network science. While the Dartmouth method and its variants define HSAs by emphasizing the greatest proportion of hospitalization or the plurality rule, the network community detection algorithms consider almost all hospitalization flows from residential locations to facilities. They group small areas with dense connections in hospitalization volumes into initial HSAs and continue to group dense connections between initial HSAs into higher-level HSAs until a single HSA is attained. As a result, the service volumes are maximal within HSAs and minimal between HSAs. The work by Hu, Wang, and Xierali (Citation2018) was among the first in adopting the popular and high-performing Louvain algorithm (Blondel et al. Citation2008) to delineate HSAs. Their study was based on the state inpatient database (SID) in Florida (AHRQ Citation2011), which is the same data to be used in this study. Later, Pinheiro et al. (Citation2020) used four community detection algorithms to produce HSAs and compared their performances, but did not enforce the requirement of spatial contiguity in derived HSAs, a major property in HSA delineation. They used the 2012–2018 claims-based hospital discharge data, or Hospital-Patient Discharge Networks (HPDNs) data, from the California Health and Human Services Agency (CHHS Citation2019). Wang et al. (Citation2020) developed an automated and spatially constrained Louvain method to delineate spatially contiguous Cancer Service Areas (CSAs) based on the 2014–2015 Medicare data on cancer services in the northeast region of the U.S. The Louvain algorithm, as the core, however, is found to have a tendency to generate arbitrarily poorly connected or even internally disconnected communities, as noted by Traag, Waltman, and Van Eck (Citation2019). They went on to propose the Leiden algorithm to remedy it. To further verify the advantage of the Leiden algorithm over the Louvain algorithm in a spatial network, Wang, Wang, and Onega (Citation2021a) developed their spatially constrained versions, termed ‘spatially constrained Louvain (ScLouvain)’ and ‘spatially constrained Leiden (ScLeiden)’ methods for delineating the CSAs, based on the same dataset as in Wang et al. (Citation2020). These pilot studies seemed to suggest the advantages of network community detection algorithms over the Dartmouth method but used different data sets in different years from those by the Dartmouth Atlas of Health Care Project. Therefore, it was hard to the dissect how much difference was attributable to data sources versus methods.
At least three important issues remain unresolved for delineation of HSAs and motivate our work reported in this paper:
Several uncertainties in the Dartmouth method lead to inconsistent and even misinterpreted implementations in practice and need to be clarified so that consistent, reliable, and replicable units such as HSAs (and HRRs) can be derived.
The Dartmouth method needs to be automated in a GIS environment so that its units can be timely updated, and the method can also be widely adapted for delineation of other specific health service areas (e.g. the aforementioned CSAs and PCSAs).
Although the spatialized network community detection methods have been proposed to define HSAs, HRRs and CSAs in previous studies, the two popular and representative algorithms, ScLouvain and ScLeiden, need to be tested on the same data set in the same year as the Dartmouth method so that fair comparisons can be made to prevent false justification of advantages of one method over another.
This research proposes the ‘refined Dartmouth method’ to resolve the uncertainties in the original Dartmouth method and standardizes its delineation process. The refinements enable the development of an automated and efficient GIS tool to implement the procedures. We also adapt the two recent spatial network community detection methods, ScLouvain and ScLeiden, to define the HSAs that are comparable to the Dartmouth HSAs. All three methods are tested in the same data set, i.e. the SID from the HCUP data in Florida in 2011, so that meaningful comparisons can be made.
Study area, data sources and data preparation
The study area is the state of Florida. Florida is only contiguously connected with Alabama and Georgia to the north, and bordered by Gulf of Mexico, Atlantic Ocean and Straits of Florida in three facets. Such a unique geography makes it an ideal study area as the cross-border interactions with other states are very limited and thus the edge effect (Chen Citation2017) is minimal.
The primary data source is the 2011 State Inpatient Databases (SID) of Florida from the HCUP sponsored by the Agency for Healthcare Research and Quality (AHRQ Citation2011). The inpatient discharge record contains variables such as principal and secondary diagnoses and procedures, payment source, patient ZIP codes and hospital identifier, which is then used to extract hospital information such as hospital ZIP code, bed size, and hospital type from the 2013 American Hospital Association (AHA) survey. Each hospital transfer is treated as one record and multiple admissions by one patient are multiple records. Records with missing ZIP codes of patients or hospitals and those visiting psychiatric, children’s, women’s and other speciality hospitals are excluded. The resulting data set includes 2,392,066 records (over 90% of the original records).
Other data source includes the ZIP Code Tabulation Areas (ZCTAs) from the U.S. Census Bureau, and a corresponding point layer of their population-weighted centroids. Those ZIP codes with no associated area such as post office box ZIP codes and single-site ZIP codes (government, building or large volume customer) are aggregated to the ZIP code areas containing them. The ZIP code area is selected as the basic unit for several reasons. Firstly, it is the finest spatial resolution for patients in the HCUP data. Secondly, the aggregation at the ZIP code area level can help protect privacy of individuals. Thirdly, ZIP code areas have long been used to define HSAs since most medical records are geocoded to ZIP code areas. A total of 117 HSAs in the study area from the Dartmouth Atlas of Health Care Project (Citation1993), simply referred to as ‘original HSAs’, are also extracted as a baseline for comparison.
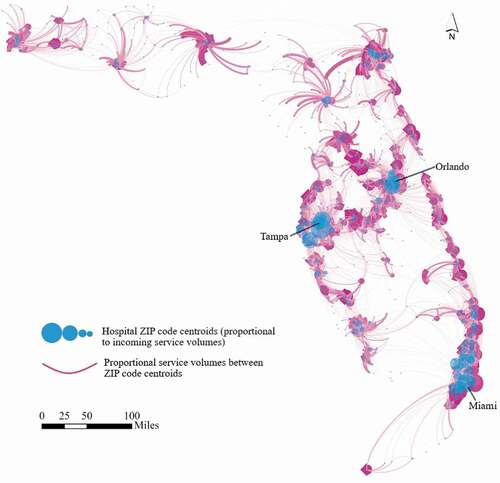
The Florida 2011 SID records are further consolidated to a spatial network from the ZIP code areas of patients to the ZIP code areas of hospitals. There are 983 ZIP code areas with a total population of 18,803,233 and 268 hospitals in the study area. After processing, we build a spatial network from 983 ZIP code areas of patients (origins) to 213 ZIP code areas of hospitals (destinations) with 37,180 origin-destination (OD) pairs representing a total service volume of 2,392,066 hospitalizations. shows the spatial network of major hospitalization flows. The blue circle size represents the total service volume ending at a hospital ZIP code centroid, and the width of each curved line reflects the service volumes between two ZIP code centroids for both directions. Cities such as Tampa, Orlando, and Miami anchor major destinations for hospitalization with interwoven complex service flows, and other areas are served by smaller hospitals drawing patients from their surrounding areas.
Figure 1. Spatial network of major hospitalization flows (volume ≥15) between ZIP code centroids.
A major data preparation task for defining contiguous HSAs is to derive a spatial adjacency matrix. We define the spatial adjacency matrix by the queen contiguity rule that defines adjacent polygons as those sharing edges or nodes (Cliff and Ord Citation1973). The matrix also needs to account for two scenarios. One involves the ZIP code areas off the coast. They are geographic islands but are connected to the mainland by bridges, ferry boats, or other means. A virtual bridge is built to connect a ZIP code area in the island and a ZIP code area in the mainland that has the shortest distance between them. Another scenario is that some ZIP code areas are separated by natural barriers, such as rivers, wildlife management areas, or parks, but they are connected via physical roads, bridges, or ferryboats. One may need to examine local geography (e.g. via Google Maps) and adjust the spatial adjacency matrix.
Methods
Refined Dartmouth method for defining HSAs
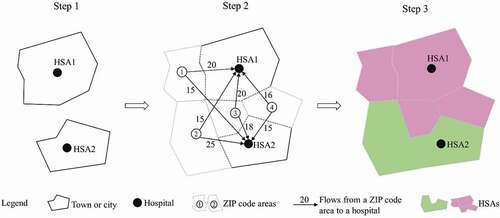
The Dartmouth method defines HSAs in three steps as illustrated in a simple example in . The first step assigns all acute care hospitals to the town or city in which they are located to form initial HSAs, such as HSA1 and HSA2 each containing one hospital. The second step applies a plurality rule to assign each ZIP code to the HSA where most patients from that ZIP code are hospitalized. For example, the middle graph shows that ZIP code 1 has a greater number of patients hospitalized in HSA1 compared to those visiting HSA2; therefore, it is assigned to HSA1. The third step further groups the formed HSAs to larger ones and ensures that all HSAs are geographically contiguous via visual examination. As a result, ZIP codes 1, 3 and 4 are grouped to HSA1 and ZIP code 2 is grouped to HSA2, and both are spatially contiguous.
Figure 2. Schematic illustration of the original Dartmouth method for delineating HSAs.
The three-step Dartmouth method seems straightforward, but each step involves some uncertainties to be resolved
In step 1, some cities (e.g. New York, Los Angeles, Chicago and Houston) are too large to form one candidate HSA, but multiple Dartmouth HSAs are observed in each of those cities in the document (Wennberg and Cooper Citation1998) without clarifying how a large city is divided. It is termed ‘the large city problem.’
In step 2, after applying the plurality rule, a significant number of candidate HSAs receiving the largest hospitalization patients from other candidate HSAs send its largest volume of patients elsewhere. The Dartmouth Atlas considers these candidate HSAs not independent, termed ‘the non-independent HSA problem’ here.
Also, in step 2, how to define the greatest number of hospitalized patients from a ZIP code to an HSA that is composed of at least one ZIP code is not clarified. The greatest hospitalization may refer to the sum of all hospitalization from a ZIP code to all ZIP codes in one HSA or only the hospitalization from a ZIP code to another ZIP code within one HSA. It is termed ‘the maximum hospitalization problem.’
In step 3, the document shows that an island ZIP code is reassigned to the enclosing HSA and provides an example of assigning an enclaved ZIP code to its neighbouring HSA. However, it does not provide a systematic rule to process these spatially non-contiguous HSAs. We term it ‘the spatial non-contiguity problem’.
We design strategies to resolve these problems, and standardize the process as detailed below, hereafter referred to as ‘refined Dartmouth method’:
Identify each unique destination ZIP code area from the network of hospitalization to anchor the initial HSA instead of a city or town. This solves ‘the large city problem.’
Assign a ZIP code area to an HSA with the highest service volume and ensure that the HSA is also spatially adjacent to that ZIP code area. If a ZIP code has flows to multiple ZIP codes in the same HSA, add up the flows together before assessing the maximum one. It solves the ‘maximum hospitalization problem.’ If the flows are tied as the maximum, assign the ZIP code to the HSA with the smallest population for most gain in balancing region size. If the ZIP code has the maximum flow going to a nonadjacent HSA, leave it unassigned for next iteration. When a ZIP code is assigned to an HSA, whose maximum flow goes to another adjacent HSA, they are non-independent HSAs that need to be merged. This resolves the ‘non-independent HSA problem.’
Repeat step 2 until all ZIP code areas are assigned to their adjacent HSA. If the ZIP code has no patients going to its adjacent HSAs, assign it to the HSA with the smallest population and at least one hospital for most gain in balancing region size. This solves ‘the spatial non-contiguity problem’.
Two additional rules may be considered if either or both are desirable: (a) each HSA with a minimum population, such as 1,000 as suggested in defining PCSAs (Goodman et al. Citation2003) and (b) each HSA with a minimum localization index (LI), such as 0.5, used in some existing studies (Jia, Wang, and Xierali Citation2017; Haynes, Wertli, and Aujesky Citation2020). Here, LI refers to the proportion of patients that receive services in hospitals within an HSA out of total patients from the HSA.
illustrates the process of the refined Dartmouth method for defining HSAs with directed weighted networks on the left and corresponding explanations on the right. Step 1 identifies three destination ZIP codes with hospitals as three initial HSAs: HSA(3), HSA(5) and HSA(8). Step 2 has two iterations to assign each ZIP code to the adjacent HSA connected by the highest service volume. The first iteration initially assigns nodes 2, 8 and 9 to HSA(8); nodes 3, 5, 6 and 7 to HSA(3); and node 4 to HSA(5). As node 1 goes to a non-adjacent HSA(8) with the highest volume, it is unassigned at this stage. Node 4 goes to HSA(5), which goes to HSA(3); and according to the rule for consolidating ‘non-independent HSAs’, HSA(5) is merged to HSA(3), which now contains five nodes (3, 4, 5, 6 and 7). The second iteration finds node 1 unassigned, and is then assigned to the expanded HSA(8) composed of three ZIP code areas (2, 8 and 9), which becomes adjacent to node 1. Step 3 ends by verifying all nodes have been assigned and forming two final HSAs: HSA(8) contains four nodes (1, 2, 8 and 9), and HSA(3) contains five nodes (3, 4, 5, 6 and 7).
Figure 3. Schematic illustration of the refined Dartmouth method for delineating HSAs.
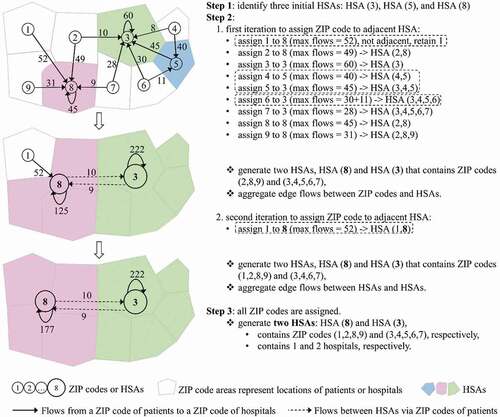
Our refined Dartmouth method clarifies, for the first time, three important processes in Step 2, highlighted in dash rectangles in , which are not explicitly illustrated in the original Dartmouth method. The first one is the definition of the adjacent HSAs with the highest service volumes. Node 1 has the largest service volume (= 52) to the nonadjacent HSA(8) so that it is unassigned in the first iteration, and subsequently assigned to it in the second iteration after the expanded HSA becomes adjacent to it. The second one refers to the non-independent HSA problem. Node 4 is initially assigned to the adjacent HSA(5), whose maximum flow volume (= 45) goes to its adjacent HSA(3). The two non-independent HSAs are merged. The third one illustrates the process of updating edge weights (flows) between HSAs, which also refers to the maximum hospitalization problem. For example, after merging nodes 3, 4 and 5 to form HSA(3), the flow from node 6 to HSA(3) is the sum of flows from node 6 to all member nodes of HSA(3), i.e. 41 (= 30 + 11).
The delineation of HRRs follows a similar process, and the differences are that (1) HRRs are constructed from HSAs instead of ZIP code areas, (2) the service flows are hospitalizations for specialized care such as cardiovascular surgery and neurosurgery between HSAs instead of all hospitalizations between ZIP code areas, and (3) it enforces mandatory constraints such as threshold population size and minimum LI value (Wennberg and Cooper Citation1998).
Spatialized network community detection methods for defining HSAs
In comparison to the refined Dartmouth method, this study also adapts two network community detection methods, spatially constrained Louvain algorithm (ScLouvain) and spatially constrained Leiden algorithm (ScLeiden), which have been used to define CSAs in the northeast U.S. (Wang, Wang, and Onega Citation2021a), to delineate HSAs in Florida. More technical details about the three methods can be found in our book (Wang and Wang Citation2022).
Given a spatial network, both algorithms use modularity, one of the best-known quality measures in network science (Newman and Girvan Citation2004; Newman Citation2004) to detect communities within which the interactions are maximal but minimal between different communities. Modularity is formulated by incorporating a tunable resolution parameter (Reichardt and Bornholdt Citation2006):
where represents the modularity value that sums over each community
,
is the total number of edge weights between all nodes within community c,
is the sum of the edge weights between nodes in community c and nodes in other communities, and m is the total number of edge weights in the network. The constant
> 0 is the resolution parameter, and a higher resolution
leads to a larger number of communities. Such an important property makes the ScLouvain and ScLeiden methods scale flexible. In general, a higher modularity represents higher-quality communities, and thus a more stable and robust network structure. In our analysis, the nodes refer to ZIP codes, the edge weights are the service volumes between the ZIP codes of patients and the ZIP codes of service providers, and the community is the HSA.
As Wang, Wang, and Onega (Citation2021a) pointed out, the ScLouvain method has three steps: (1) local nodes moving, (2) network aggregation and (3) spatial contiguity and minimal region size guarantees, while the ScLeiden method contains four phases: (1) local nodes moving, (2) refinement, (3) network aggregation based on the refined partition and (4) spatial contiguity and minimal region size guarantees. To highlight the differences, this study uses a simple network of 19 ZIP codes to briefly illustrate their implementations in delineating 3 HSAs in , respectively.
Figure 4. Schematic illustration of ScLouvain method.
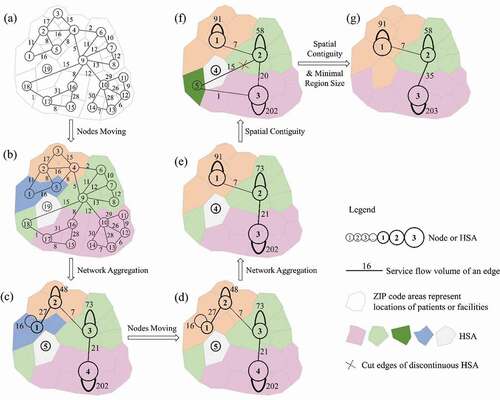
Figure 5. Schematic illustration of ScLeiden method.
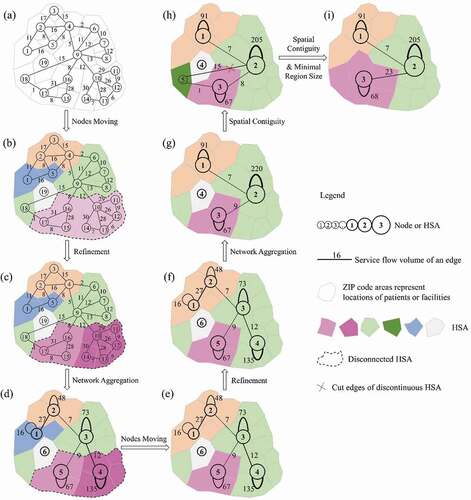
In the nodes moving phase, both methods assign 19 ZIP codes to 19 individual HSAs in . Then, the ScLouvain method repeatedly moves each individual ZIP code to different HSAs to find the one with the greatest gain of modularity. Eventually, it detects five HSAs with different colours in ). In contrast, the ScLeiden method uses the fast local move (Ozaki, Tezuka, and Inaba Citation2016; Bae et al. Citation2017) procedure to speed up the process as not all ZIP codes are necessary to be moved, and it derives five HSAs with different colours in ). The highlighted HSA has two separate sets of ZIP codes, (15, 16 and 17) and (10, 11, 12, 13 and 14) at the bottom, forming two sub-HSAs in terms of the local subnetworks but as whole for the entire network. This is attributable to the role of ZIP code 9 acting as a bridge to connect two sub-HSAs. It is later moved to the upper HSA for gaining modularity, leaving two sub-HSAs internally disconnected. ZIP code 9 also has a strong connection with the nonadjacent ZIP code 18 at the lower left, which is assigned to the same HSA for the greatest modularity gain.
Next, the ScLouvain method creates a new network, where five HSAs become five new renumbered nodes and the service volumes between any new nodes are updated (see )). However, the ScLeiden method adopts the smart local move (Waltman and Van Eck Citation2013) and random neighbour move (Traag Citation2015) to refine the five HSAs by splitting the highlighted HSAs into two sub-HSAs in which two sets of nodes are well connected, respectively, in ). This is a significant difference between the two methods. The ScLeiden method continues to initialize the new network by five HSAs but with the highlighted HSA locally separated into two sub-HSAs in ) for guaranteeing a monotonic increase of modularity. Although the poorly connected HSAs detected in this phase have small edge weights within each HSA, having one large HSA in the aggregated network will have modularity higher than that derived from multiple sub-HSAs detected in the refinement phase.
Then both methods start the second iteration. Since nodes 1 and 2 at the top left corner have strong connections with each other, they are moved into one HSA by both methods. The ScLeiden method even moves node 4 to node 3 to maximize the modularity gain (see )). The ScLouvain method continues to aggregate the network into a new one in ) while the ScLeiden method refines the partition in ) and aggregates the network to a different one in . Both obtain the best aspatial community structure with the highest modularity.
The final phase is to enforce the spatial contiguity and minimal region size rules. Using a predefined spatial adjacency matrix, both methods split four non-spatially continuous HSAs in or to five HSAs (nodes) in or at a cost of decreasing modularity. To be consistent with original definition of HSAs, we refine both methods to ensure each node (or HSA) has a population size above the threshold and contains at least one hospital (or one destination node here). Otherwise, further aggregation is needed to account for the following scenarios:
For an orphan node with no edges (zero service volume) to any nodes in the network, merge it to its neighbouring node (or HSA) with at least one hospital and the smallest population size (e.g. node 4 in ) is moved to node 1 and node 3 in , respectively).
For an enclaved node with or without edges connecting to its adjacent neighbouring nodes but having edges connecting to multiple non-adjacent nodes, merge it to the adjacent neighbouring node that achieves the maximal modularity gain, and if there is no positive gain in modularity, merge it to the adjacent neighbouring node with hospitals and the smallest population size (e.g. the lower-left node 5 in ) is moved to node 3 in ), respectively).
For an enclosed node with one neighbouring node like a hole in a donut HSA, merge it directly to its neighbour.
This process continues until each HSA has a minimal regional size and at least one hospital when a global optimal modularity is achieved. As shown in ), both methods aggregate 19 ZIP code areas to 3 contiguous HSAs so that the total service volumes are maximal within each HSA and minimal between different HSAs. Note that the two methods delineate HSAs with different spatial configurations as the ScLeiden method can identify poorly or disconnected HSAs and refine them while such a merit is absent in the ScLouvain method.
Quality measures of HSAs
Three common indices from health care studies are selected to evaluate the quality of HSAs: localization index (LI), geographic compactness, and balanced region size. As the most important property in health service area delineation (Wennberg and Cooper Citation1998; Guagliardo et al. Citation2004; Kilaru et al. Citation2015; Jia, Wang, and Xierali Citation2017; Hu, Wang, and Xierali Citation2018), LI represents the tendency of patients to seek local hospitalization and it is defined as the ratio of service flows within an HSA divided by the total service flows originated from the same HSA. A higher LI is more favourable as it demonstrates that the generated HSAs better reflect local health care markets. Geographic compactness and balanced region size are two other measures widely used to assess the quality of regionalization from a geographic perspective (Guo Citation2008). We use the perimeter (P) vs. area (A) corrected ratio or PAC to capture the geographic compactness of an HSA (Wang et al. Citation2020; Wang, Wang, and Onega Citation2021a). A lower PAC value implies a more compact HSA that is more acceptable in system planning. The region size is described as the total population in an HSA. Balanced region size is often desirable as the population sizes are more comparable across different HSAs. Moreover, in accordance with the definition of HSA requiring at least one hospital inside, we also use the number of destination ZIP code areas to measure the number of hospitals within each HSA.
Results and discussion
Comparing two Dartmouth methods
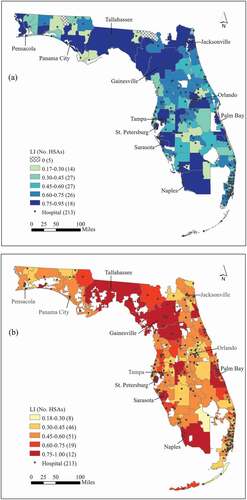
In Florida, there were 117 original HSAs defined by Dartmouth method in 1993. Using the spatial network of all hospitalization flows from the 2011 SID data in Florida, our refined Dartmouth method derives 136 HSAs. We experimented with imposing the minimum population size of 1,000 to avoid extremely small HSAs, but it did not take effect as the derived HSAs were the same without this constraint. Four indices, the number of destination ZIP codes, LI, geographic compactness and region size across 117 original HSAs and 136 newly derived HSAs are reported in . The moderate increase in the number of HSAs (19) reflects an expanded health care market from 1993 to 2011. Five original HSAs are found to have no hospitals, while each HSA derived by our refined Dartmouth method contains at least one hospital. This observation once again demonstrates the changes of health care market for about two decades and confirms the necessity of updating the original HSAs. Moreover, the increase in the HSA number comes with very little drop in the LI mean value (0.515 vs. 0.513)Footnote1 and smaller variability (standard deviation 0.219 vs. 0.153). In term of geographic compactness and region size, the 136 HSAs have a smaller average PAC (2.2 vs. 2.402) and a lower standard deviation of population (121,000 vs. 250,000), suggesting more compact shapes and more balanced region size.
Table 1. Indices for HSAs delineated by various methods in Florida
) shows the variations of LI across 117 original HSAs and 136 newly derived HSAs. The five original HSAs without any hospitals are either in the very north bordering Georgia or at the southern tip of Florida due to hospital closures ()). In the category of lowest LI values (< 0.30), there are 14 original HSAs located at some inland small towns in ) while only 8 new HSAs mainly in the southeast coast in ). In other words, the change of health care system in the state exposed the poor fit of the original HSAs in these areas, whereas the areas covered by the updated HSAs in this category are much more limited but nevertheless highlight where the vast majority of residents have to seek hospital services far beyond local. Most of the HSAs by the refined Dartmouth method have LI values in the moderate low category (0.3–0.45) with 46 or 33.8% HSAs or in middle range around the average (0.45–0.60) with 51 or 37.5% HSAs.
Figure 6. Localization index in (a) 117 original HSAs and (b) 136 HSAs by the refined Dartmouth.
Comparing ScLouvain, ScLeiden and refined Dartmouth methods
As stated previously, the ScLouvain and ScLeiden methods are scale flexible and allow users to generate a series of HSAs at different scales by adjusting the predefined resolution values. To illustrate this property, we simulate 1,000 scenarios using different resolution values ranging from 0 to 10 with an increment of 0.01 by both methods to delineate HSAs in Florida. The spatial adjacency matrix and a threshold size of 1,000 used in the refined Dartmouth method are also applied here to ensure all HSAs are spatially contiguous with a population size over 1,000. Both methods are very efficient and complete one round of simulation in a fraction of minute.Footnote2 The ScLeiden method is faster than the ScLouvain method, and its advantage in efficiency becomes more evident when the number of HSAs increases. This is consistent with findings by Wang, Wang, and Onega (Citation2021a).
To be comparable to the 136 HSAs derived from the refined Dartmouth method, the same number of HSAs (136) is targeted for the ScLouvain and ScLeiden methods. As shown in , each HSA derived from the three methods contains at least one hospital. The refined Dartmouth HSAs enjoy a higher average LI (0.513) than the ScLouvain and ScLeiden HSAs (both 0.472), and their lower bound of LI (0.188) is also significantly higher than those by the two methods (both 0.001). However, their overall shape is less compact (the mean value of PAC is 2.2 vs. 2.179 and 2.181) and region size is less balanced (with standard deviation of 121,000 vs. 80,000 and 77,000) than the comparable HSAs with the ScLouvain and ScLeiden methods. Such a comparison also indicates a slight advantage of the ScLeiden method over the ScLouvain method in deriving HSAs with a lower standard deviation of LI values and thus more balanced region size. Also, the ScLeiden method yields HSAs with a slightly higher modularity value than the ScLouvain method (0.519 vs. 0.510).
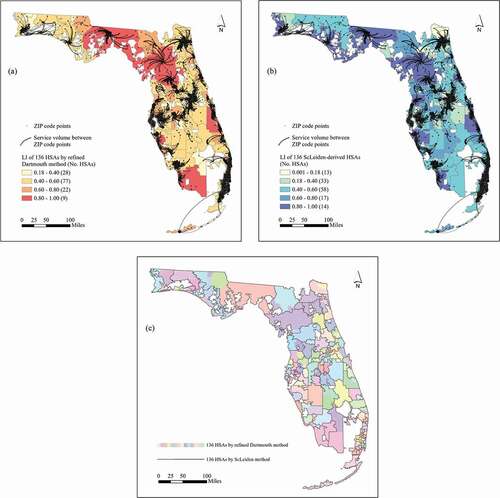
shows the spatial distributions of the major hospitalization flows and LI values across 136 HSAs derived from the refined Dartmouth method and ScLeiden method. We omit the comparison to the 136 HSAs with the ScLouvain method as the result is very similar to the ScLeiden method. While the boundaries of the 136 HSAs with the refined Dartmouth method enclose the greatest service volumes, the comparable HSAs with the ScLeiden method are largely consistent with the major service flows. Both methods have the HSAs of the lowest LI distributed in the east coast areas and derive most HSAs with LI between 0.4 and 0.6. However, the ScLeiden method yields more HSAs (33) with LI between 0.18 and 0.40 than the refined Dartmouth method (28) but does a better job in delineating HSAs with LI > 0.80 (14 vs. 9). Moreover, the boundaries of most HSAs by the refined Dartmouth method and the ScLeiden method do not match as shown in ).
Figure 7. (a) LI of 136 HSAs by the refined Dartmouth method with overlaid major service flows (volume ≥150); (b) LI of 136 ScLeiden-derived HSAs with overlaid major service flows (volume ≥150); and (c) 136 HSAs with the refined Dartmouth method versus ScLeiden.
The loss of advantage in LI by the two network community detection methods to the refined Dartmouth method seems surprising. Our experiments on running Louvain and Leiden methods without imposing any spatial constraints generate 161 and 164 noncontiguous HSAs, respectively. There are 25 and 29 HSAs without hospitals (or HSAs with zero number of destination ZIP codes) and their LI values are all zero. For the remaining 136 and 135 HSAs, they have the same minimum LI value of 0.008 but the Leiden-derived HSAs have a higher mean LI value than the Louvain-derived HSAs (0.484 vs. 0.483). Most HSAs from the two aspatial methods are largely consistent with those derived from the spatial constrained versions. The lower LI issues may attribute to the community detection methods and network data themselves rather than the spatial constraints imposed. Prior studies using the same network community detection methods generate service areas with higher LI values (Hu, Wang, and Xierali Citation2018; Wang et al. Citation2020; Wang, Wang, and Onega Citation2021a). As stated previously, unlike this study, those prior studies utilized different data in different years, and the comparisons were made to the original Dartmouth HSAs. We speculate that in the scenario of a large number of HSAs (here 136 HSAs, constructed from 213 destination ZIP code areas), the network community detection methods are not very effective in dividing the network into highly fragmented sub-networks, but their advantages might be more evident when the number of HSAs is reduced. This motivates us to further investigate the HSAs with the global optimal modularity derived from the two network community detection methods.
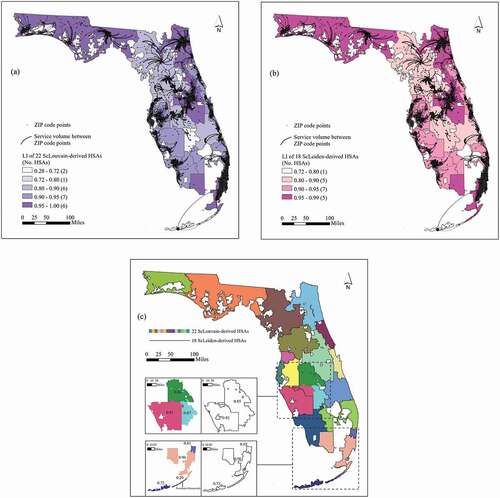
As shown in , the ScLouvain and ScLeiden methods yield 22 and 18 HSAs respectively at the global optimal modularity, both significantly lower than the 136 HSAs by the refined Dartmouth method. They have similar modularity values with a slight edge to the ScLouvain (0.846 vs. 0.844). The mean LI value of the 18 HSAs with the ScLeiden method is higher than 22 HSAs with the ScLouvain method (0.909 vs. 0.869) as fewer and larger HSAs are more likely to contain more intra-HSA flows. The range of LI with the ScLeiden method is significantly narrower than that with the ScLouvain method (0.727–0.985 vs. 0.286–1), so is the difference in the standard deviations (0.065 vs. 0.154). Thus, the ScLeiden method is more favourable in capturing local health care markets. The 18 ScLeiden HSAs have a higher average PAC value (3.191 vs. 2.927), and thus are less compact than the 22 ScLouvain HSAs. However, they have a larger average population (1,045,000 vs. 855,000) with less variability (743,000 vs. 765,000), and thus are more balanced in region size compared to the 22 ScLouvain HSAs.
shows the variations of LI across 22 ScLouvain-derived HSAs and 18 ScLeiden-derived HSAs overlaid with the major hospitalization flows, respectively. In both cases, the boundaries of HSAs align well with the major flows, which demonstrate their scientific soundness. Most of the HSAs (19 out of 22 ScLouvain HSAs and 17 out of 18 ScLeiden HSAs) have their LI values above 0.8. The HSAs by the two methods are also largely consistent, with some discrepancies highlighted in the insets of ). In the first row inset, three smaller HSAs with LI values between 0.67 and 1 by the ScLouvain method are merged to form one larger ScLeiden HSA with LI = 0.85, and the ScLouvain HSA in the southwest corner becomes a smaller ScLeiden HSA but with a slightly improved LI (0.92 vs. 0.91). The two ScLeiden HSAs are more balanced in region size (696,599–901,405) than the four ScLouvain HSAs (14,158–575,833). In the second row inset, the lowest LI = 0.29 is located at Tavernier, Islamorada, by the ScLouvain method, whereas the ScLeiden method has the lowest LI = 0.73 in the south. The three ScLeiden HSAs have more balanced region sizes (52,751–3,233,600) than the four ScLouvain HSAs (8,379–3,209,318).
Figure 8. (a) LI of 22 ScLouvain-derived HSAs with overlaid major service flows (volume ≥150); (b) LI of 18 ScLeiden-derived HSAs with overlaid major service flows (volume ≥150); and (c) 22 HSAs with ScLouvain versus 18 HSAs with ScLeiden.
Discussion and recommendation
is compiled to summarize the findings and guide us to make some recommendations. The refined Dartmouth method seems more advantageous in deriving a large number of (136) HSAs with higher LI values than the two network community detection methods. The plurality rule, i.e. aggregating ZIP code areas around the hospitals receiving the most patients, is the primary driver for determining the number of HSAs. Such a number is usually very close to the number of ZIP code areas with at least one hospital. A significant number of hospitals in ) are too close to each other to form their own HSAs. The relatively low LI value (slightly above 0.5) suggests that the number of HSAs by the Dartmouth method could be too numerous for today’s highly interconnected hospital systems. The method itself, including the refined version in our case, is not scale flexible and can only generate one set of HSAs, and therefore is probably ill equipped to capture the increasingly complex health care market structure. It may be used for deriving ‘Dartmouth HSAs’ as a baseline for comparison.
Table 2. Comparing Refined Dartmouth Method versus ScLouvain and ScLeiden Methods
The real advantage of the two network community detection methods lies in their property of being scale flexible. The methods strive to maximize the modularity value to group ZIP codes to a set of HSAs where hospitalization flows are maximal within HSAs and minimal between HSAs. The methods let the structure of a health care market dictate the number of HSAs to be derived. For a highly integrated and interdependent health care market as it is often the case today, the methods can capture its organic and best configuration, where many hospitals share overlapping patient bases and their service areas are tangled together to a degree inseparable. Thus, their major advantage comes in deriving a smaller number of HSAs by achieving higher LI values with the global optimal modularity.
Between the two network community detection methods, the ScLeiden method yields the highest average LI value of 0.909 for 18 HSAs, higher than the average LI value of 0.869 for the 22 ScLouvain-derived HSAs. The discrepancy in the numbers of global optimal HSAs between the two is attributable to the different impacts of two constraints added to the methods. The enforcement of spatial contiguity splits noncontiguous HSAs at a cost of decreasing modularity, while the implementation of minimal region size merges smaller HSAs to larger ones and results in an increase of modularity. A much narrower range of LI’s variability across the ScLeiden-derived HSAs is even more impressive. Overall, the ScLeiden method is more advantageous than the ScLouvain method, consistent with findings in previous studies (Wang, Wang, and Onega Citation2021a, Citation2021b), and thus is recommended.
Concluding remarks
Hospital Service Areas (HSAs) offer a reliable analysis unit for assessment of local health care market. The Dartmouth method is the earliest attempt and remains the most popular method for delineating HSAs, and the Dartmouth HSAs have been widely used for evaluating health care system performance and informing policies. However, the Dartmouth HSAs were defined by using the Medicare data limited to a particular demographic group (65+ years old), considered outdated, and criticized for lack of clarity on specific steps and some decision makings on an ad hoc basis. It calls for developing reliable, automated, and highly efficient methods for updating the derived units to meet the challenges of an ever-changing and a diverse set of health care services.
In response, this study develops a reproducible, automated, and efficient GIS tool to implement the refined Dartmouth method and adopts two popular network community detection methods accounting for spatial constraints for defining HSAs. The spatial network built from the 2011 SID data in Florida is used to evaluate their performance. The major findings are summarized as follows:
The original 1993 Dartmouth HSAs (with several without any hospitals inside) do not reflect the changes of health care market over the years and thus need to be updated. The refined Dartmouth method resolves several uncertainties in the original process and enables its automation in a GIS environment.
The refined Dartmouth method defines HSAs with a higher average LI value than those comparable HSAs derived by the two network community detection methods. It suggests that the refined Dartmouth method be viable in delineating local healthcare markets when HSAs are as numerous as the number of ZIP codes with hospitals.
The network community detection methods can define a series of HSAs including one with the global optimal modularity. The ‘optimal’ HSAs defined by the two methods are much fewer, have much higher LI values and are better balanced in size than the refined Dartmouth HSAs.
Overall, the 136 HSAs derived by all three methods have LI values averaged as low at about 0.5, indicating that about half of the hospitalization pattern is left out of the HSAs. As the healthcare system becomes increasingly integrated and interwoven, the large number of HSAs derived by the Dartmouth method leads to highly fragmented structure and does not capture the true market structure. The ScLouvain and ScLeiden methods are scale flexible and are recommended to define the right number of HSAs that reflect the underlying market configuration. Between the two, ScLeiden enjoys a slight edge over ScLouvain.
The three methods are automated in an ArcGIS toolkit with a friendly user interface.Footnote3 Users can easily apply them in other study areas or for delineating other type of service areas.
Several issues call for future work. Firstly, the refined Dartmouth method deals with a directed weighted network, while the two network community detection methods are implemented in an undirected weighted network. Future studies may consider implementing them in one framework to facilitate direct comparison and possible fusion between them. Secondly, the HSA delineation results by any one of the three methods may differ slightly in various simulations, due to the order of ZIP code areas being processed (or being assigned or moved to an HSA). Our suggestion is to run the programmes multiple times and select the best solution. Thirdly, the spatial constraints added to the two community detection methods complicate the process. While their aspatial precedents are optimal in community detection, there is no such a guarantee for the spatialized versions, and it leaves much room for pursuit of further improvement. See more scenarios in Wang and Wang (Citation2022, 138). Moreover, the two network community detection methods focus on segmenting a network into distinctive subnetworks. In the real world, hospitals share overlapping patient bases, and the market has become increasingly interwoven. Multiple‐membership multi-level models (Falster, Jorm, and Leyland Citation2018) and overlapping network community detection methods (Xie, Kelley, and Szymanski Citation2013) may be considered to account for this complexity and further improve LI values in derived HSAs.
Disclosure statement
No potential conflict of interest was reported by the author(s).
Additional information
Funding
Notes
1. In general, a larger number of HSAs and thus smaller HSAs on average imply that fewer hospitalization flows could be captured within HSAs, and therefore lower LI values.
2. On an Intel® Xeon® Gold 6140 CPU @ 2.30 GHz 2.29 GHz desktop with a memory of 128GB, it took 9.36 h for the 1,000 simulations of HSAs in Florida.
3. Visit https://faculty.lsu.edu/fahui/news/2021/book-gis-hsa-by-crc.php for free downloading the programmes and sample data sets.
References
- AHRQ (Agency for Healthcare Research and Quality). 2011. Healthcare Cost and Utilization Project (HCUP) State Inpatient Databases (SID)—Florida. Rockville, MD. (Accessed 18 January 2021. https://www.hcup-us.ahrq.gov/sidoverview.jsp
- Bae, S.-H., D. Halperin, J. D. West, M. Rosvall, and B. Howe. 2017. “Scalable and Efficient Flow-based Community Detection for Large-scale Graph Analysis.” ACM Transactions on Knowledge Discovery from Data 11 (3): 1–30. doi:https://doi.org/10.1145/2992785.
- Blondel, V. D., J. L. Guillaume, R. Lambiotte, and E. Lefebvre. 2008. “Fast Unfolding of Communities in Large Networks.” Journal of Statistical Mechanics: Theory and Experiment 2008 (10): 1–12. doi:https://doi.org/10.1088/1742-5468/2008/10/P10008.
- CHHS (California Health and Human Services Agency). 2019. CHHS Open Data. Accessed 15 March 2021 https://data.chhs.ca.gov/
- Chen, X. 2017. “Take the Edge Off: A Hybrid Geographic Food Access Measure.” Applied Geography 87: 149–159. doi:https://doi.org/10.1016/j.apgeog.2017.07.013.
- Cliff, A. D., and J. K. Ord. 1973. Spatial Autocorrelation. London: Pion.
- Dartmouth Atlas of Health Care. 1993. HSA boundaries. Accessed 18 January 2021 https://www.dartmouthatlas.org/downloads/geography/
- Falster, M. O., L. R. Jorm, and A. H. Leyland. 2018. “Using Weighted Hospital Service Area Networks to Explore Variation in Preventable Hospitalisation.” Health Services Research 53 (1): 3148–3169. doi:https://doi.org/10.1111/1475-6773.12777.
- Fotheringham, A. S., and D. W. S. Wong. 1991. “The Modifiable Areal Unit Problem in Multivariate Statistical Analysis.” Environment and Planning A: Economy and Space 23 (7): 1025–1044. doi:https://doi.org/10.1068/a231025.
- Goodman, D. C., S. S. Mick, D. Bott, T. Stukel, C.-H. Chang, N. Marth, J. Poage, and H. J. Carretta. 2003. “Primary Care Service Areas: A New Tool for the Evaluation of Primary Care Services.” Health Services Research 38 (1p1): 287–309. doi:https://doi.org/10.1111/1475-6773.00116.
- Guagliardo, M. F., K. A. Jablonski, J. G. Joseph, and D. C. Goodman. 2004. “Do Pediatric Hospitalizations Have a Unique Geography?” BMC Health Services Research 4 (1): 1–9. doi:https://doi.org/10.1186/1472-6963-4-2.
- Guo, D. 2008. “Regionalization with Dynamically Constrained Agglomerative Clustering and Partitioning (REDCAP).” International Journal of Geographical Information Science 22 (7): 801–823. doi:https://doi.org/10.1080/13658810701674970.
- Haynes, A. G., M. M. Wertli, and D. Aujesky. 2020. “Automated Delineation of Hospital Service Areas as a New Tool for Health Care Planning.” Health Services Research 55 (3): 469–475. doi:https://doi.org/10.1111/1475-6773.13275.
- Herrin, J., K. Kenward, M. S. Joshi, A. M. J. Audet, and S. J. Hines. 2016. “Assessing Community Quality of Health Care.” Health Services Research 51 (1): 98–116. doi:https://doi.org/10.1111/1475-6773.12322.
- Hu, Y., F. Wang, and I. M. Xierali. 2018. “Automated Delineation of Hospital Service Areas and Hospital Referral Regions by Modularity Optimization.” Health Services Research 53 (1): 236–255. doi:https://doi.org/10.1111/1475-6773.12616.
- Institute of Medicine. 2013. Variation in Health Care Spending: Target Decision Making, Not Geography. Washington, DC: Institute of Medicine.
- Jia, P., F. Wang, and I. M. Xierali. 2017. “Delineating Hierarchical Hospital Service Areas in Florida.” Geographical Review 107 (4): 608–623. doi:https://doi.org/10.1111/j.1931-0846.2016.12207.x.
- Kanter, G. P., A. G. Segal, and P. W. Groeneveld. 2020. “Income Disparities in Access to Critical Care Services.” Health Affairs 39 (8): 1362–1367. doi:https://doi.org/10.1377/hlthaff.2020.00581.
- Kilaru, A. S., D. J. Wiebe, D. N. Karp, J. Love, M. J. Kallan, and B. G. Carr. 2015. “Do Hospital Service Areas and Hospital Referral Regions Define Discrete Health Care Populations?” Medical Care 53 (6): 510–516. doi:https://doi.org/10.1097/MLR.0000000000000356.
- Klauss, G., L. Staub, M. Widmer, and A. Busato. 2005. “Hospital Service Areas - A New Tool for Health Care Planning in Switzerland.” BMC Health Services Research 5: 1–15. doi:https://doi.org/10.1186/1472-6963-5-33.
- Mossanen, M., J. Izard, J. L. Wright, J. D. Harper, M. P. Porter, K. B. Daratha, S. K. Holt, and J. L. Gore. 2014. “Identification of Underserved Areas for Urologic Cancer Care.” Cancer 120: 1565–1571. doi:https://doi.org/10.1002/cncr.28616.
- Newman, M. E. J. 2004. “Fast Algorithm for Detecting Community Structure in Networks.” Physical Review E 69 (6): 066133. doi:https://doi.org/10.1103/PhysRevE.69.066133.
- Newman, M. E. J., and M. Girvan. 2004. “Finding and Evaluating Community Structure in Networks.” Physical Review E 69 (2): 1–15.
- Ozaki, N., H. Tezuka, and M. Inaba. 2016. “A Simple Acceleration Method for the Louvain Algorithm.” International Journal of Computer and Electrical Engineering 8 (3): 207–218. doi:https://doi.org/10.17706/IJCEE.2016.8.3.207-218.
- Pinheiro, D., R. Hartman, E. Romero, R. Menezes, and M. Cadeiras. 2020. “Network-based Delineation of Health Service Areas: A Comparative Analysis of Community Detection Algorithms.” Paper read at Complex Networks XI, at Cham.
- Reichardt, J., and S. Bornholdt. 2006. “Statistical Mechanics of Community Detection.” Physical Review E 74 (1): 1–14. doi:https://doi.org/10.1103/PhysRevE.74.016110.
- Rosenberg, B. L., J. A. Kellar, A. Labno, D. H. M. Matheson, M. Ringel, P. VonAchen, R. I. Lesser, et al. 2016. “Quantifying Geographic Variation in Health Care Outcomes in the United States before and after Risk-adjustment.” PloS one 11 (12): e0166762–e0166762. doi:https://doi.org/10.1371/journal.pone.0166762.
- Schroeck, F. R., S. R. Kaufman, B. L. Jacobs, T. A. Skolarus, J. M. Hollingsworth, V. B. Shahinian, and B. K. Hollenbeck. 2014. “Regional Variation in Quality of Prostate Cancer Care.” Journal of Urology 191 (4): 957. doi:https://doi.org/10.1016/j.juro.2013.10.066.
- Traag, V. A. 2015. “Faster Unfolding of Communities: Speeding up the Louvain Algorithm.” Physical Review E 92 (3): 1–10. doi:https://doi.org/10.1103/PhysRevE.92.032801.
- Traag, V. A., L. Waltman, and N. J. Van Eck. 2019. “From Louvain to Leiden: Guaranteeing Well-connected Communities.” Scientific Reports 9 (1): 1–12. doi:https://doi.org/10.1038/s41598-019-41695-z.
- Waltman, L., and N. J. Van Eck. 2013. “A Smart Local Moving Algorithm for Large-scale Modularity-based Community Detection.” The European Physical Journal. B 86 (11): 471. doi:https://doi.org/10.1140/epjb/e2013-40829-0.
- Wang, C., F. Wang, and T. Onega. 2021a. “Network Optimization Approach to Delineating Health Care Service Areas: Spatially Constrained Louvain and Leiden Algorithms.” Transactions in GIS 25 (2): 1065–1081. doi:https://doi.org/10.1111/tgis.12722.
- Wang, C., F. Wang, and T. Onega. 2021b. “Spatial Behavior of Cancer Care Utilization in Distance Decay in the Northeast Region of the U.S.” Travel Behaviour and Society 24: 291–302. doi:https://doi.org/10.1016/j.tbs.2021.05.003.
- Wang, F. 2020. “Why Public Health Needs GIS: A Methodological Overview.” Annals of GIS 26 (1): 1–12. doi:https://doi.org/10.1080/19475683.2019.1702099.
- Wang, F., and C. Wang. 2022. GIS Automated Delineation of Hospital Service Areas. Boca Ration, FL: CRC Press.
- Wang, F., C. Wang, Y. Hu, J. Weiss, J. Alford-Teaster, and T. Onega. 2020. “Automated Delineation of Cancer Service Areas in Northeast Region of the United States: A Network Optimization Approach.” Spatial and Spatio-temporal Epidemiology 33: 100338. doi:https://doi.org/10.1016/j.sste.2020.100338.
- Ward, M. M., F. Ullrich, K. Matthews, G. Rushton, R. Tracy, D. F. Bajorin, M. A. Goldstein, et al. 2014. “Access to Chemotherapy Services by Availability of Local and Visiting Oncologists.” Journal of Oncology Practice 10 (1): 26–31. doi:https://doi.org/10.1200/JOP.2013.001217.
- Wennberg, J. E., and M. M. Cooper. 1998. The Dartmouth Atlas of Health Care in the United States. Chicago, IL: American Hospital Publishing.
- Xie, J., S. Kelley, and B. K. Szymanski. 2013. “Overlapping Community Detection in Networks: The State-of-the-art and Comparative Study.” ACM Computing Surveys 45 (4): 1–35. doi:https://doi.org/10.1145/2501654.2501657.