
 ?Mathematical formulae have been encoded as MathML and are displayed in this HTML version using MathJax in order to improve their display. Uncheck the box to turn MathJax off. This feature requires Javascript. Click on a formula to zoom.
ABSTRACT
Studying the structure of polycentric cities can promote a better understanding of urban development and contribute to urban planning. In this study, we identified polycentric cities in China and evaluated the urban centre development level of polycentric cities from new data and method. We used Luojia-1A night-time light (NTL) data, combined with the concept of natural cities (NCs), to identify urban centres and thus identify polycentric cities in China. In addition, we used the urban centre development index (UCDI) to quantify the urban centre development level (UCDL) that represents the overall urban centre development level within a polycentric city. The polycentric cities in China are characterized by the spatial distribution pattern of a larger number in the east and fewer in the west. There are a large number of polycentric cities in eastern China, and the closer to the coastal areas, the more polycentric cities there are. The distribution of UCDL in China’s polycentric cities is characterized by significant spatial heterogeneity. UCDLs are generally smaller in polycentric cities in western China. In addition, polycentric cities in northeastern China have smaller UCDL. Polycentric cities with high UCDL are concentrated in the central and coastal regions of China.
1. Introduction
With the development of the economy and urbanization, the urban resident population and human activities have increased and the urban spatial structure has changed significantly, leading to the emergence of more polycentric cities (cities with multiple urban centres) (Li and Li Citation2019; Meijers Citation2005). The urban centre is a key element of both the urban structure and polycentric city and is defined as the continuous area with a larger population or higher economic development level than the surrounding area. Therefore, urban centre planning is of great interest to urban planners and policy-makers. For example, in recent decades, the urban spatial structure of major cities in China, such as Beijing and Shanghai, has exhibited a multicenter characteristic. At the same time, the urban planning of each city clearly indicates the development plan for building multiple urban centres (Cai, Huang, and Song Citation2017; Taubenböck et al. Citation2017).
The identification of urban centres and study of polycentric cities have also aroused great interest from many scholars. Previous studies on urban centre identification relied heavily on statistical data, such as census data and economic statistics. For example, a previous study identified the region with the highest employment density as the urban centre (McMillen Citation2003, Citation2001). A negative exponential model based on the employment density is applied to the identification of urban centres in Chicago (McDonald and Prather Citation1994). Fine-grained population data are used to analyse the polycentric urban development of 22 city regions in China at multiple scales (Liu, Derudder, and Wang Citation2018). Although these methods have made great contributions to the study of urban centres, there are still several minor problems that need to be solved. For example, statistical data are usually collected by administrative divisions, which necessarily limits the shape and range of the final identified urban centre to administrative boundaries, but real urban centres are mostly irregular polygons.
To solve these problems, scholars have used night-time light (NTL) data instead of statistical data to study the urban structure. NTL data record the NTL intensity on the surface of the Earth, and NTL values can reflect socioeconomic activities and urban development (Li and Zhou Citation2018; Pok, Matsushita, and Fukushima Citation2017; Stathakis and Baltas Citation2018). Specifically, NTL data can be used to measure the urban GDP, electricity consumption, carbon dioxide emissions and other indicators as well as to identify urban areas (Benz, Bayer, and Blum Citation2017; Garratt, Jenkins, and Davies Citation2019; Nieves et al. Citation2020; Wu, Zhao, and Jiang Citation2018). Two NTL data sets released by the National Oceanic and Atmospheric Administration’s National Geophysical Data Center of the United States (NOAA/NGDC) have been widely used for research, including the NTL data set released earlier obtained by the Defence Meteorological Satellite Program–Operational Linescan System (DMSP-OLS) and another NTL data set released in 2013 acquired from the day/night band of the new sensor called the Visible Infrared Imaging Radiometer Suite (VIIRS) mounted on the National Polar-orbiting Partnership (NPP) satellite. Although existing studies have made great contributions to the study of the urban structure and the identification of urban centres based on the use of NTL data, there are still two issues that should be solved. First, the spatial resolution of the NTL data used in the existing research is still low, and the emerging NTL data with a higher resolution could be used instead. Second, the existing research using NTL data can only identify urban centres and investigate the spatial distribution of the urban structure but cannot compare the development level of the urban centres in different polycentric cities.
To reduce the errors caused by the coarse spatial resolution of DMSP-OLS and NPP-VIIRS NTL data, Luojia-1A NTL data were used in this study. Luojia-1A NTL data are emerging NTL data, which were developed by the State Key Laboratory of Information Engineering in Surveying, Mapping and Remote Sensing (China) in 2015 and released in June 2018 (Ou et al. Citation2019). Compared with DMSP-OLS and NPP-VIIRS NTL data, Luojia-1A NTL data have a much higher spatial resolution (130 m) and a better temporal resolution (global NTL images can be obtained within 15 days under ideal conditions) (Wang et al. Citation2020). Therefore, spatial NTL information at a finer scale can be derived from Luojia-1A NTL data. In addition, the concept of the natural city (NC) was introduced in this study to quantitatively describe urban centres. The NC concept is a bottom-up approach to geographic event research and involves geographic events clustered in space that provide a new perspective for the analysis of geospatial data and help to better understand the form and process of geographic events (Long Citation2016). In addition, fractal geometry is the basis of an NC, which is a mathematical set with a complex structure reflected at various scales. Compared with the traditional Euclidean geometry, which is related to regular shapes (e.g. circle and rectangle), the fractal geometry mainly concerns irregular shapes (e.g. snowflake) (Wentz Citation2003). Furthermore, the fractal geometry pays more attention to the whole, and the Euclidean geometry only focuses on pieces (Batty Citation2008). To identify polycentric cities and evaluate the urban centre development level, we conducted this study, which aims to (1) identify polycentric cities in China; and (2) evaluate the urban centre development level of polycentric cities.
2. Study area and data
2.1. Study areas
China has a land area of approximately 9.6 million and 331 cities (missing data in Taiwan). The spatial distribution of cities in China is extremely uneven, and the area difference between cities is significant. Specifically, most of the cities are concentrated in the eastern part of China, and the size of these cities is small, while Western China has a small number of cities, but these cities are very large. Moreover, based on administrative system of China, there are five levels among these 331 cities: special administrative region (2 cities), municipality directly under the central government (4 cities), vice-provincial city (15 cities), other provincial capital city (17 cities), and prefecture-level city (293 cities).
2.2. Data
Luojia-1A NTL data (http://datasearch.hbeos.org.cn:3000/) was used in this study. Note that the pixel values of the original Luojia-1A images need to be calibrated. is the conversion equation of the pixel value (suggested by the data provider), where
is the NTL value of the pixel, and
is the original pixel value. The pixel size of a converted Luojia-1A NTL image is 130 m, and the unit of Luojia-1A NTL value is
. In addition, since this study requires calculating the NTL pixel area, the Luojia-1A NTL data were converted into the Albers Equal Area Conic projection.
The edge length of each Luojia-1A NTL image is 250 . Therefore, for cities with narrow swath or large area, it is necessary to use multiple Luojia-1A NTL images to cover these cities. When collecting Luojia-1A NTL images that cover a certain city in this study, the first step is to ensure a high image quality, and the second step is to ensure that these images are obtained in the same month or consecutive months. Nevertheless, certain cities are still not fully covered by existing Luojia-1A NTL images. Fortunately, only some of the large cities in Western China have gaps that cannot be covered by the existing images, and these gaps are mostly on the urban fringe. Moreover, most of these cities are sparsely populated areas, making it difficult to have a polycentric urban structure. In addition, the Luojia-1A NTL images (366 in total) of all 331 cities collected in this study were obtained from July 2018 to March 2019.
3. Methodology
3.1. Deriving natural cities
In this research, we used the NC concept and the active area of the city as a basis for the identification of the urban centre (Cai, Huang, and Song Citation2017). Referring to previous studies, we found that a segmentation method is the basis of deriving NCs (Jiang and Liu Citation2012). This method is closely related to the mean value of the data set and is based on the head/tail division rule. The head/tail division rule is used in variables that follow the heavy-tailed distribution representing the statistical distribution of the right deviation (e.g. the power law and exponential distributions) (Jiang and Miao Citation2015). More specifically, for a variable X that follows the heavy-tailed distribution, its mean value can divide all X values into two parts. The first part of the X values is greater than the mean value but at a low percentage, and this part is called the head. The other part is called the tail, which has a high percentage, but the values are less than the mean value. In other words, the number of small values is much larger than that of large values.
Many heavy-tailed distributions have been found in previous studies, such as the density of street nodes, the density of social media location data, and the area of street blocks (Jiang Citation2015). For example, in a previous study, we found that the density of POIs also follows the heavy-tailed distribution, which can be used to derive NCs, and the NCs derived from POIs are used to study urban expansion (Yang et al. Citation2019). In addition, previous studies have confirmed that the pixel values of NTL images are also subject to the heavy-tailed distribution (the number of low-value NTL pixels is significantly larger than that of high-value NTL pixels), although the NTL images used are DMSP-OLS and NPP-VIIRS NTL images (Jiang and Yin Citation2014). Through empirical research, we found that the pixel values of Luojia-1A NTL images also follow the heavy-tailed distribution, which further confirms the heavy-tailed distribution characteristics of the pixel values of NTL images. This further confirms that the pixel values of NTL images are characteristic of heavy-tailed distributions.
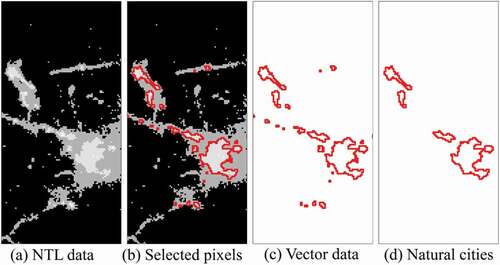
There are 4 steps in the derivation of NCs from Luojia-1A NTL images (): 1) calculate the mean value of the pixels of the NTL image and divide all pixels into two parts based on the head/tail division rule; 2) select the part of the pixels that belongs to the head (the pixel value is greater than the mean value); 3) transform the selected pixels (raster data) into vector data and aggregate the pixels into polygons; and 4) calculate the area of all polygons and remove any small polygons (smaller than ), and the remaining polygons are NCs. However, it must be acknowledged that in the process of deriving NCs, some low-value pixels are surrounded by high-value pixels, which causes small gaps to appear inside some NCs. Fortunately, the area of these gaps is much smaller compared to the whole are of NCs. Therefore, these gaps are filled to make NCs become spatial entities, which does not affect the identification of NCs but can improve the quantitative analysis in this study.
Figure 1. The procedures of deriving the NCs from NTL image.
3.2. Identifying urban centres
Among the identified natural cities, some of them should not be considered as urban centres. Therefore, we used three indexes to select urban centres from NCs. The first index is the area , the second index is the standard deviation (
), and the third index is the elongation (
). The attributes of an NC, which can be called an urban centre, must meet the evaluation criteria of these three indexes. The definitions of these three indexes are detailed in .
Table 1. Definitions of indexes for identifying urban centres
The area is the size of an NC.
is the number of pixels in an NC and
is the size of a pixel. The area of each NC derived from NTL data is larger than
, but the area of the urban centre is much larger. Therefore, it is necessary to select a minimum urban centre area to distinguish between urban and nonurban centres. Referring to previous studies (Cai, Huang, and Song Citation2017), we refer to NCs with an area larger than
as urban centres. However, it must be admitted that there are cities in China that are either large or small, but whose population and economic activities are insignificant. NCs in these cities are small (smaller than
) and do not meet the evaluation criterion for the size of urban centre. Therefore, we lowered the evaluation criterion for the urban centre size in a few cities (6 out of 331) to ensure that each city has at least one urban centre.
The standard deviation () is the standard deviation of the values for all NTL pixels in an NC, where
is the value of the
NTL pixel and
represents the average value of all NTL pixels in the NC.
is an index that measures the degree of dispersion of the data set. A larger
represents a large difference between most of the values in the data set and its mean, while a smaller
inidcates that these values are closer to the average value. Some NCs (e.g. airports and ports), which consist of high-value NTL pixels, have a large area, but these NCs cannot be considered urban centres. Through empirical research, we found that the values of the NTL pixels in airports or ports are not significantly different, but the values of the different NTL pixels in urban centres are different due to the difference in human activities. Therefore, more accurate urban centres can be identified by calculating
(an NC with
close to 0 is considered a nonurban centre).
The elongation () represents the spatial distribution of the NC in different directions.
and
represent the lengths of the major and minor axes, respectively, of the minimum bounding rectangle of the NC. In the process of deriving NCs, we found that some NTL pixels with high values (location in the same area as a narrow road) can form an NC. Therefore, in identifying urban centres, we need to eliminate those NCs that represent narrow roads. The minimum bounding rectangle of an NC can help us distinguish whether an NC is long and narrow. In general, if
of an NC is equal to or greater than 5, then the NC is not an urban centre.
3.3. Urban centre development index
Urban centre development level (UCDL) is the overall urban centre development level within a polycentric city. To quantify the UCDL within a polycentric city, the urban centre development index (UCDI) was proposed. A characteristic of NTL data (more significant differences in NTL pixel values within regions indicate higher levels of development) is the basis for calculating UCDI within polycentric cities (Yang et al. Citation2021).
In the NTL images of urban centres, the phenomenon of high-value and low-value pixel aggregation is observed. That is, the urban centre can be divided into many blocks with similar NTL pixel values. In addition, in the process of analysing the difference in NTL pixel value, we found that the NTL pixel values in urban centres also follow the heavy-tailed distribution. Therefore, we adopted a similar operation as the procedure of deriving NCs from NTL images, dividing the NTL pixels into two parts (the head and the tail) based on the head/tail division rule. Moreover, if the NTL pixel values still follow the heavy-tailed distribution, then the NTL pixels are divided again based on the head/tail division rule until the NTL pixel values no longer follow the heavy-tailed distribution. For the urban centres in different polycentric cities, the number of times the NTL pixels are divided based on the head/tail division rule are different. As a numerical value, the number of division times enables the quantitative comparison of the development of the overall urban centre across different polycentric cities. Therefore, in this study, the UCDI of a polycentric city is represented by the number of times the NTL pixels are divided.
In conclusion, in this study, calculating the UCDI of a polycentric city is a process of continuously dividing NTL pixels based on the head/tail division rule. The number of division times represents the UCDI of a polycentric city. In other words, if the number of times that the NTL pixels in a polycentric city can be divided is
, then the UCDI of this area is
. Moreover, it should be noted that the urban centre is the result of the first division of NTL pixels
, so when the NTL pixels in urban centres cannot be divided, the UCDI of this polycentric city is 1
.
In fact, calculating the UCDI of a polycentric city is an iterative process, and the threshold (the proportion of NTL pixels divided into the head) determines the number of iterations. For a polycentric city, when the threshold is larger, more iterations are computed and the UCDI obtained is larger. In this study, referring to previous studies, we chose 30% as the threshold for calculating the UCDI of polycentric cities. In other words, if the number of NTL pixels that are divided into the head is larger than 30% of the total number of NTL pixels, these NTL pixel values are considered not to follow the heavy-tailed distribution and cannot be further divided based on the head/tail division rule.
4. Results
4.1. Identification of polycentric cities in China
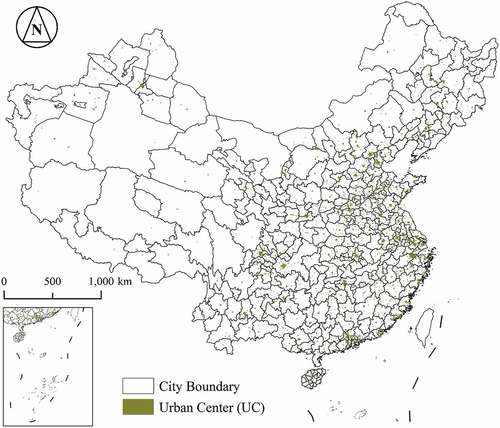
The urban centres of the 331 cities in China were identified from Luojia-1A NTL data, as shown in . The distribution of urban centres in eastern China is significantly dense, while in the larger western regions of China, the number of urban centres is small and the distribution is very sparse. In addition, there is no significant positive correlation between the number or area of urban centres and the area of a city. For example, some large cities in Western China have only one urban centre, and the area of the urban centre is smaller than 1% of the total urban area. However, in some smaller cities in eastern China, the number of urban centres exceeds 10, and the total area of the urban centres is even larger than 20% of the whole city.
Figure 2. Distribution of urban centres in 331 cities in China.
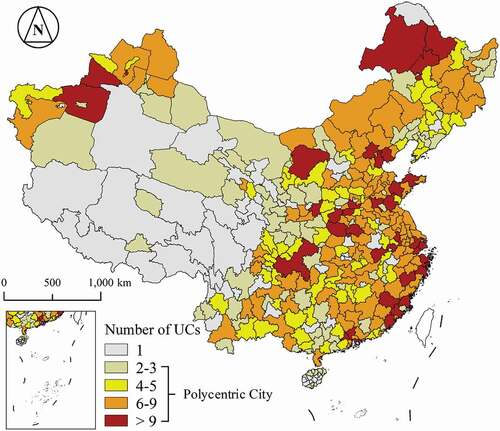
The number of urban centres in each city was calculated to determine the polycentric cities in China (i.e. cities with more than 2 urban centres), as shown in . Most of the 331 cities in China are polycentric cities, while only 54 cities have only one urban centre. Among all polycentric cities, there are 76 cities with 2 or 3 urban centres, 64 cities with 4 or 5 urban centres, 96 cities with 6 to 9 urban centres, and 41 cities with more than 9 urban centres. The polycentric cities in China are characterized by the spatial distribution pattern of a larger number in the east and fewer in the west. There are a large number of polycentric cities in eastern China, and the closer to the coastal areas, the more polycentric cities there are. In addition, the number of polycentric cities with more than 5 urban centres is mostly concentrated in eastern China. There are some large cities in western China, some of which are non-polycentric cities, while some are polycentric cities, but the number of urban centres is small.
Figure 3. Distribution of polycentric cities in China.
4.2. Urban centre development level of polycentric cities
UCDL is the overall urban centre development level within a polycentric city. The UCDI can be used to quantitatively analyse the UCDL in polycentric cities. According to the UCL calculation method mentioned above, based on the head/tail division rule, the NTL pixels in the urban centre of a city can be continuously divided, and then the UCDL of a polycentric city can be calculated. In other words, the number of times the NTL pixels can be divided is the UCDL of the city (when the NTL pixel values no longer follow the heavy-tailed distribution, the pixels can no longer be divided). The UCDL of 331 cities in China is calculated in this study ().
Figure 4. Distribution of UCDL in polycentric cities in China.
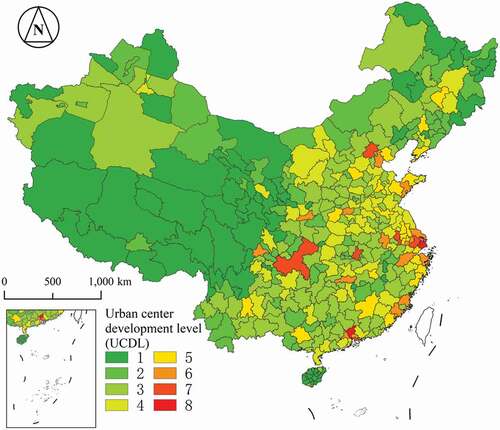
The distribution of UCDL in China’s polycentric cities is characterized by significant spatial heterogeneity. For a city with only one urban centre, its USDL is undoubtedly only 1. UCDLs are generally smaller in polycentric cities in western China. Polycentric cities in northeastern China have smaller UCDL. Polycentric cities with high UCDL are concentrated in the central and coastal regions of China. The number of NTL pixels divided into the head in all cities (the NTL values follow the heavy-tailed distribution) is smaller than 30% of the total number of NTL pixels and larger than 20% of the total number of NTL pixels. Therefore, whether the number of NTL pixels divided into the head reaches 30% of the total number of NTL pixels is reasonable as the basis for judging whether the NTL pixel values follow the heavy-tailed distribution.
5. Discussion
5.1. Delineation accuracy
In this study, the accuracy of urban centre identification from the Luojia-1A NTL data was measured by using POI data. Determining the accurate spatial distribution of the urban centres of a city and generating accurate urban centre maps is difficult. However, POI data can well represent a large area of human activities. POI data are not only open data (obtained and used freely by the public) but also geographical data. POI data have a unique geospatial location (coordinate point information) that represents the location of a series of information types, including land use categories and socioeconomic and other geographic features, which can link the information and human activity ranges and help to identify the range of different urban functional areas. Therefore, the coverage of the POI data can be applied to compare the results of urban centre identification from NTL data, and this method has also been used in previous studies (Cai, Huang, and Song Citation2017). In other words, the high consistency between the coverage of urban centres and that of POI data implies that the accuracy of urban centre identification from Luojia-1A NTL data is high.
Since Beijing is a typical polycentric city, we chose the urban centre of Beijing for validation. The number of POIs in Beijing is 539,086, obtained from the largest electronic map website of China (www.baidu.com). These POIs are connected by coordinate information to a gridded map with a resolution of 130 m (the same as that of the Luojia-1A NTL images). Then, the coverage of the POI data in Beijing is drawn by extracting a grid containing one or more POIs, as shown in . In addition, the process of identifying the coverage of POI data is similar to the process of identifying urban centres from Luojia-1A NTL data (if an area is smaller than 10 , it is eliminated).
Figure 5. Urban centres of Beijing identified from Luojia-1A NTL data (a) and the coverage of POI data in Beijing (b).
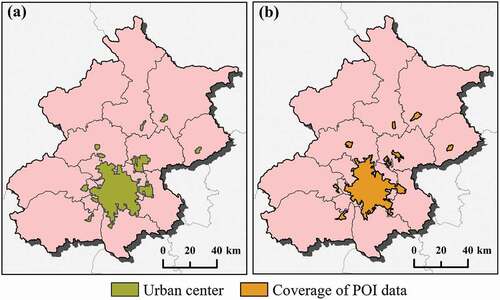
Kappa coefficients calculated based on the confusion matrix were used to assess the consistency between the coverage of urban centres and the coverage of POI data. We selected a sample of 10,000 (5,000 within urban centres and 5,000 in other areas) to calculate the Kappa coefficients. The coverage of urban centres in Beijing is highly consistent with the coverage of POI data, which has a Kappa coefficient of over 0.9 (0.9226). Therefore, the high consistency between the coverage of urban centres and that of POI data implies that the accuracy of urban centre identification from Luojia-1A NTL data is high.
5.2. Hot spot analysis
We found differences in the distribution of the number of urban centres and the distribution of UCDL. Therefore, we used hot spot analysis to understand the differences in the distribution of the number of urban centres and the distribution of UCDL. Hot spot analysis is used to identify spatial clusters with statistically significant high values (hot spots) and low values (cold spots). For example, for the distribution of UCDL, high and low UCDL clusters formed in space will be identified separately. We used hot spot analysis to identify high and low value clusters for the number of urban centres and UCDL, respectively ().
Figure 6. Hot spot analysis of the number of urban centres in polycentric cities.
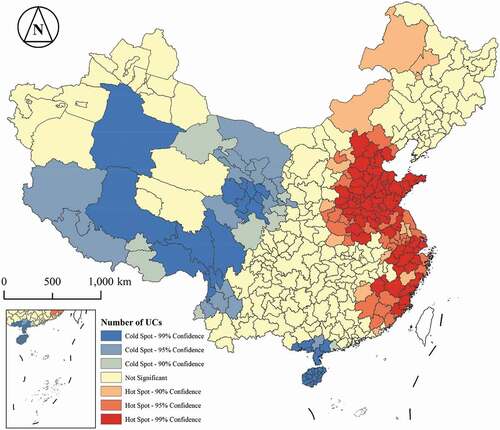
Figure 7. Hot spot analysis of the UCDL in polycentric cities.
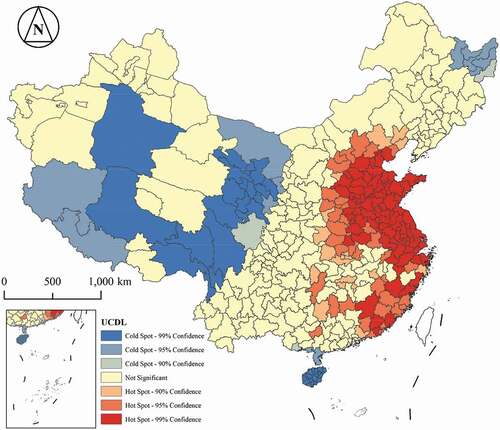
The clusters with high values of the number of urban centres are concentrated in the coastal areas and the central regions of China. The clusters with low values of the number of urban centres are mainly in the western part of China. Small clusters of low UCDLs also occur in the south of China (e.g. Hainan). High UCDL clusters are also concentrated in the coastal areas of China as well as in the central regions of China. Low UCDL clusters are mainly concentrated in the western part of China. Smaller concentrations of low UCDL also occur in southern (e.g. Hainan) and northeastern provinces of China.
The spatial distribution of clusters with high and low values of the number of urban centres is similar to that of clusters with high and low values of UCDL. However, compared to the clusters with high values of the number of urban centres, the clusters of high UCDLs cover a larger area spatially. For example, the extent of the clusters of high UCDLs formed in the central region of China is greater than that of the clusters with high values of the number of urban centres. Compared to the clusters with low values of the number of urban centres, the clusters of low UCDLs cover a smaller area in space. For example, the extent of the clusters of high UCDLs formed in the southern region of China is smaller than that of the clusters with high values of the number of urban centres.
5.3. Recommendations for future studies
In this study, we identified China’s polycentric cities and evaluated the urban centre development level. In addition, we used hot spot analysis to understand the differences in the distribution of the number of urban centres and the distribution of UCDL. The spatial distribution of clusters with high and low values of the number of urban centres is similar to that of clusters with high and low values of UCDL. However, we have not quantified the relationship between the number of urban centres and UCDL. Therefore, we will explore whether there is a relationship between the number of urban centres and UCDL in future study.
In the process of identifying polycentric cities, we found an interesting phenomenon. Some developing cities (e.g. cities in northern and western China) have more urban centres than developed cities (e.g. cities on the eastern coast of China). This phenomenon indicates that the number of urban centres in a city cannot reflect the level of urban development. For example, as a city grows, multiple urban centres expand and merge into one large urban centre. The number of urban centres in this city has decreased, but the level of urban development has increased. In addition, in future research, we will carry out a long time series of identification of polycentric cities and evaluation of their urban centres in order to understand the process of urban development.
6. Conclusions
The spatial resolution of the NTL data used in the existing research is still low. Moreover, the existing research using NTL data can only identify urban centres and investigate the spatial distribution of the urban structure but cannot compare the development level of the urban centres in different polycentric cities. In this study, we identified polycentric cities in China and evaluated the urban centre development level of polycentric cities from new data and method.
The polycentric cities are characterized by the spatial distribution pattern of a larger number in the east and fewer in the west of China. There are a large number of polycentric cities in eastern China, and the closer to the coastal areas, the more polycentric cities there are. In addition, the number of polycentric cities with more than 5 urban centres is mostly concentrated in eastern China. There are some large cities in Western China, some of which are non-polycentric cities, while some are polycentric cities, but the number of urban centres is small.
The distribution of UCDL in China’s polycentric cities is characterized by significant spatial heterogeneity. For a city with only one urban centre, its USDL is 1. UCDLs are generally smaller in polycentric cities in western China. In addition, polycentric cities in northeastern China have smaller UCDL. Polycentric cities with high UCDL are concentrated in the central and coastal regions of China.
Acknowledgements
We are grateful to Wuhan University for providing free use of Luojia-1A NTL data. This work was supported by the National Key R&D Program of China [grant no. 2018YFB2100703]; the National Natural Science Foundation of China [grant no. U1901219]; the Key Special Project for Introduced Talents Team of Southern Marine Science and Engineering Guangdong Laboratory (Guangzhou) [grant no. GML2019ZD0301]; the Key Science and Technology Projects of Guangzhou [grant no. 20180203008]; and the postgraduate innovation ability training program of Guangzhou University [grant no. 2019GDJC-M01].
Disclosure statement
No potential conflict of interest was reported by the author(s).
Additional information
Funding
References
- Batty, M. 2008. “The Size, Scale, and Shape of Cities.” Science (80-) 319 (5864): 769–771. doi:https://doi.org/10.1126/science.1151419.
- Benz, S. A., P. Bayer, and P. Blum. 2017. “Identifying Anthropogenic Anomalies in Air, Surface and Groundwater Temperatures in Germany.” Sci. Total Environ 584-585: 145–153. doi:https://doi.org/10.1016/j.scitotenv.2017.01.139.
- Cai, J., B. Huang, and Y. Song. 2017. “Using Multi-source Geospatial Big Data to Identify the Structure of Polycentric Cities.” Remote Sensing of Environment 202: 210–221. doi:https://doi.org/10.1016/j.rse.2017.06.039.
- Garratt, M. J., S. R. Jenkins, and T. W. Davies. 2019. “Mapping the Consequences of Artificial Light at Night for Intertidal Ecosystems.” Science of the Total Environment 691: 760–768. doi:https://doi.org/10.1016/j.scitotenv.2019.07.156.
- Jiang, B. 2015. “Wholeness as a Hierarchical Graph to Capture the Nature of Space.” International Journal of Geographical Information Science 29 (9): 1632–1648. doi:https://doi.org/10.1080/13658816.2015.1038542.
- Jiang, B., and X. Liu. 2012. “Scaling of Geographic Space from the Perspective of City and Field Blocks and Using Volunteered Geographic Information.” International Journal of Geographical Information Science 26 (2): 215–229. doi:https://doi.org/10.1080/13658816.2011.575074.
- Jiang, B., and Y. Miao. 2015. “The Evolution of Natural Cities from the Perspective of Location-Based Social Media.” The Professional Geographer 67 (2): 295–306. doi:https://doi.org/10.1080/00330124.2014.968886.
- Jiang, B., and J. Yin. 2014. “Ht-Index for Quantifying the Fractal or Scaling Structure of Geographic Features.” Annals of the Association of American Geographers 104 (3): 530–540. doi:https://doi.org/10.1080/00045608.2013.834239.
- Li, G., and F. Li. 2019. “Urban Sprawl in China: Differences and Socioeconomic Drivers.” Science of the Total Environment 673: 367–377. doi:https://doi.org/10.1016/j.scitotenv.2019.04.080.
- Li, X., and W. Zhou. 2018. “Dasymetric Mapping of Urban Population in China Based on Radiance Corrected DMSP-OLS Nighttime Light and Land Cover Data.” Science of the Total Environment 643: 1248–1256. doi:https://doi.org/10.1016/j.scitotenv.2018.06.244.
- Liu, X., B. Derudder, and M. Wang. 2018. “Polycentric Urban Development in China: A Multi-scale Analysis.” Environment and Planning B: Urban Analytics and City Science 45 (5): 953–972. doi:https://doi.org/10.1177/2399808317690155.
- Long, Y. 2016. “Redefining Chinese City System with Emerging New Data.” Applied Geography 75: 36–48. doi:https://doi.org/10.1016/j.apgeog.2016.08.002.
- McDonald, J. F., and P. J. Prather. 1994. “Suburban Employment Centres: The Case of Chicago.” Urban Studies 31 (2): 201–218. doi:https://doi.org/10.1080/00420989420080201.
- McMillen, D. P. 2001. “Nonparametric Employment Subscenter Identification.” Journal of Urban Economics 50 (3): 448–473. doi:https://doi.org/10.1006/juec.2001.2228.
- McMillen, D. P. 2003. “Identifying Sub-centres Using Contiguity Matrices.” Urban Studies 40 (1): 57–69. doi:https://doi.org/10.1080/00420980220080161.
- Meijers, E. 2005. “Polycentric Urban Regions and the Quest for Synergy: Is a Network of Cities More than the Sum of the Parts?” Urban Studies 42 (4): 765–781. doi:https://doi.org/10.1080/00420980500060384.
- Nieves, J. J., A. Sorichetta, C. Linard, M. Bondarenko, J. E. Steele, F. R. Stevens, A. E. Gaughan, et al. 2020. “Annually Modelling Built-settlements between Remotely-sensed Observations Using Relative Changes in Subnational Populations and Lights at Night.” Computers, Environment and Urban Systems 80: 101444. doi:https://doi.org/10.1016/j.compenvurbsys.2019.101444.
- Ou, J., X. Liu, P. Liu, and X. Liu. 2019. “Evaluation of Luojia 1-01 Nighttime Light Imagery for Impervious Surface Detection: A Comparison with NPP-VIIRS Nighttime Light Data.” International Journal of Applied Earth Observation and Geoinformation 81: 1–12. doi:https://doi.org/10.1016/j.jag.2019.04.017.
- Pok, S., B. Matsushita, and T. Fukushima. 2017. “An Easily Implemented Method to Estimate Impervious Surface Area on a Large Scale from MODIS Time-series and Improved DMSP-OLS Nighttime Light Data.” ISPRS Journal of Photogrammetry and Remote Sensing 133: 104–115. doi:https://doi.org/10.1016/j.isprsjprs.2017.10.005.
- Stathakis, D., and P. Baltas. 2018. “Seasonal Population Estimates Based on Night-time Lights.” Computers, Environment and Urban Systems 68: 133–141. doi:https://doi.org/10.1016/j.compenvurbsys.2017.12.001.
- Taubenböck, H., I. Standfuß, M. Wurm, A. Krehl, and S. Siedentop. 2017. “Measuring Morphological Polycentricity - A Comparative Analysis of Urban Mass Concentrations Using Remote Sensing Data.” Computers, Environment and Urban Systems 64: 42–56. doi:https://doi.org/10.1016/j.compenvurbsys.2017.01.005.
- Wang, C., Z. Chen, C. Yang, Q. Li, Q. Wu, J. Wu, G. Zhang, and B. Yu. 2020. “Analyzing Parcel-level Relationships between Luojia 1-01 Nighttime Light Intensity and Artificial Surface Features across Shanghai, China: A Comparison with NPP-VIIRS Data.” International Journal of Applied Earth Observation and Geoinformation 85: 101989. doi:https://doi.org/10.1016/j.jag.2019.101989.
- Wentz, E. A. 2003. “Modelling Scale in Geographical Information Science (Review).” Geogr. Anal 35: 177–178. doi:https://doi.org/10.1353/geo.2003.0004.
- Wu, W., H. Zhao, and S. Jiang. 2018. “A Zipf’s Law-based Method for Mapping Urban Areas Using NPP-VIIRS Nighttime Light Data.” Remote Sens 10. doi:https://doi.org/10.3390/rs10010130.
- Yang, Z., Y. Chen, G. Guo, Z. Zheng, and Z. Wu. 2021. “Using Nighttime Light Data to Identify the Structure of Polycentric Cities and Evaluate Urban Centers.” Science of the Total Environment 780: 146586. doi:https://doi.org/10.1016/j.scitotenv.2021.146586.
- Yang, Z., Y. Chen, Z. Wu, Q. Qian, Z. Zheng, and Q. Huang. 2019. “Spatial Heterogeneity of the Thermal Environment Based on the Urban Expansion of Natural Cities Using Open Data in Guangzhou, China.” Ecological Indicators 104: 524–534. doi:https://doi.org/10.1016/j.ecolind.2019.05.032.