
 ?Mathematical formulae have been encoded as MathML and are displayed in this HTML version using MathJax in order to improve their display. Uncheck the box to turn MathJax off. This feature requires Javascript. Click on a formula to zoom.
ABSTRACT
COVID-19 has had a serious impact on the lives and health of people and severely affected the population flow in 2020. Baidu migration data offer great opportunities to study spatiotemporal interactions among cities. Revealing population flow patterns has important scientific significance for the precise prevention and control of the COVID-19 epidemic. The aim of this article is to reveal the spatiotemporal patterns of population flow and associated influential factors in 22 cities in the Sichuan-Chongqing region (SCR), which is regarded as the fourth pole of China’s economy. Four typical time periods are selected to study the spatiotemporal patterns of population flow. The regional population flow intensities in all cities and between different cities in the SCR are illustrated. Stepwise regression is used to analyse the factors affecting regional population flow intensity in four selected periods. The results show that (1) the COVID-19 epidemic greatly affected population flow in the SCR, (2) more travel occurred between cities on holidays than on weekdays in the SCR when the epidemic was not serious, and (3) the regional population flow intensity was strongly correlated with the population education level and transportation facilities when the epidemic was not serious.
Introduction
Population flow is an important feature that reflects the level of urban development and interconnectedness between cities, and it provides important information that reflects economic links and transportation needs between cities (Shumway and Otterstrom Citation2001; González, Hidalgo, and Barabási Citation2008). Since January 2020, COVID-19 has been spreading worldwide (Chung, Xu, and Zhang Citation2020), and the WHO declared it an international public health emergency by the end of January 2020 (Lai et al. Citation2020). COVID-19 has not only had a serious impact on the lives and health of people around the world but has also significantly damaged the economic development of various cities (Connolly, Ali, and Keil Citation2020). Studies have shown that limiting population flow can largely reduce the spread of COVID-19, thus resulting in a significant reduction in prevalence (Wells et al. Citation2020; Wang et al. Citation2021; Wu et al. Citation2021). During the severe epidemic periods in China, major changes in population flow patterns occurred due to policy restrictions (Chen et al. Citation2020).
Scholars have explored population flow in China during the COVID-19 epidemic using statistical data (Zhang et al. Citation2020a). However, these studies focused on a short period of population flow because collecting statistical data to determine population flow is not only very costly but also very time sensitive. In China, large-scale population surveys are conducted every ten years, and it is impossible to obtain real-time information on population flow from statistical data (Xu et al. Citation2017). With the development of communications and networks in the last decade, big data, especially location-based big data, offer great opportunities to study the sense of place and spatial interactions between cities (Liu et al. Citation2016; Meijers and Peris Citation2019; Yao et al. Citation2019; Ye, Li, and Peng Citation2021).
Rapidly available, yet accurate, big-data analytics on population flow and its influencing factors are invaluable to decision-makers. The emergence of location-based big data provides a new perspective for studying population flow, and revealing population flow patterns and their influencing factors has more important scientific significance for the precise prevention and control of the COVID-19 epidemic. The main contribution of this article is to reveal the spatiotemporal patterns of population flow and associated influential factors in 22 cities in the Sichuan-Chongqing region (SCR). This paper proceeds as follows. Section 2 introduces the related work. Then, the basic situations underlying the SCR and Baidu migration data are explained. Then, we briefly describe the impact of the epidemic on population flow. Stepwise regression is then used to analyse the influencing factors on regional population flow intensity in four selected periods. Finally, we analyse and discuss the results and conclude the paper.
Related work
The emergence of big data has facilitated our research on population flow. Population flow is affected by many factors. Here, the related works that explore population flow and influencing factors are reviewed.
The use of location-based big data to detect population flow is becoming mainstream (Chen et al. Citation2016; Zhang et al. Citation2020b). Cell phone signalling data are generated by cell phone users in the event of calls, text messages or mobile location, and these data are acquired by the operator’s communication base station that records the user’s signalling trajectory. Many scholars use cell phone signalling data to analyse the user’s trajectory and derive population mobility patterns (Ratti et al. Citation2006; Fan et al. Citation2018; Gao et al. Citation2020; Hu et al. Citation2021). The use of cell phone signalling data to study population flow has the advantages of wide coverage and high accuracy; however, cell phone signalling data are generally expensive and often have a large amount of redundant data (Jarv et al. Citation2012). Floating car data refer to the trajectories of vehicles equipped with Global Navigation Satellite System (GNSS) devices that automatically record real-time traffic data (Erdelić et al. Citation2021). Floating car data have the advantages of stability and high accuracy. Many scholars are now using floating car data to study the population flow pattern of cities (Veloso, Phithakkitnukoon, and Bento Citation2011; Tang et al. Citation2015; Shen, Liu, and Chen Citation2017). Floating car data emphasize the flow of vehicles; however, the flow of vehicles and the population flow are not completely equivalent. Social media data are also a very popular source for studying population movement (Wu et al. Citation2014; Huang et al. Citation2020; Ye, Li, and Peng Citation2021). However, more social media data are obtained for young people, whereas social media platforms are less frequently used by children and older people. Therefore, using social media data to study population mobility and flow may introduce bias. Location-based services (LBS) denote applications integrating geographic location with the general notion of services, and examples of such applications include emergency services, car navigation systems, and tourist tour planning (Schiller and Voisard Citation2004). Baidu migration data are based on Baidu’s LBS data; moreover, Baidu is an open platform that collects the results of various internet releases and the location information of various user mobile applications, and it also provides a unified data format and a unified open interface (Deville et al. Citation2014) and offers great opportunities to study spatiotemporal interactions between cities.
The large-scale population flow in 2020 was influenced not only by the COVID-19 epidemic but also by other factors. The main factor underlying population flow was the economic situation of each city or region (Xu et al. Citation2017; Cao et al. Citation2018). Cities or regions with a high level of urbanization tend to have a more developed economy, more jobs and higher income, which can attract people from other regions who are seeking employment and development, and the flow rate tends to be higher. Weaker economic regions tend to have fewer jobs, and a large amount of outward talent spread (Shen Citation2006; Gao et al. Citation2014; He et al. Citation2016; Jin et al. Citation2019; Li et al. Citation2019; Zhao, Liu, and Wang Citation2019). In addition to economic conditions, population flow is also related to quality of life (Mueser and Graves Citation1995), which is largely influenced by the public facilities in the city. Cities and regions with better public facilities, such as cinemas, shopping malls and parks, can better attract immigrants. Research shows that the general budget expenditures of local governments are an important factor that influences the distribution of migrating populations (Xu and Ouyang Citation2018). Traffic conditions can also greatly affect the flow of people. Convenient and well-located areas are more attractive to immigrants (Kotavaara, Antikainen, and Rusanen Citation2011). However, these studies did not consider the impact of epidemics. Some of the features may show a high degree of correlation between themselves. Excessive features may result in redundant data, resulting in an increase in time complexity. Moreover, in a large-scale municipal or provincial administrative area, the relationship or structure of the variables would change as the geographical location changes, which is known as spatial existence nonstationarity. Using the traditional regression model may cause a certain deviation in the result (Matthews and Parker Citation2013).
Most of the cities in the SCR are located in the Sichuan Basin, which is surrounded by the highlands of the Wu Mountains in the east and the Yunnan-Guizhou Plateau in the south and the Tibet Plateau in the west and the Daba Mountains in the north. In recent years, some studies have focused on the SCR, for example, temperature variability (Shao, Li, and Ni Citation2012), comprehensive drought index (Ji et al. Citation2018), precipitation (Lai and Gong Citation2017), and atmosphere (Wang et al. Citation2018; Huang et al. Citation2021), whereas few studies have explored population flow patterns in the SCR. Since SCR is a relatively closed geographical unit, the population flow in the SCR has strong regional characteristics, and the connections between cities in the SCR are closer. During the COVID-19 pandemic, revealing population flow patterns in the SCR has more important scientific significance for the precise prevention and control of the COVID-19 epidemic.
Study area and data sources
Study area
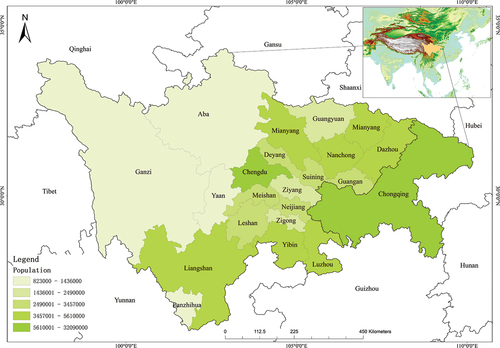
The SCR is located in southwestern China in the upper reaches of the Yangtze River. It is bordered by Hubei and Hunan Provinces in the east, the Tibet Autonomous Region and Qinghai Province in the west, Yunnan and Guizhou Provinces in the south, and Shaanxi and Gansu Provinces in the north. The area of the SCR, which is 568,422 square kilometres, accounts for 5.9% of China’s total area. It includes 22 cities in Sichuan Province and Chongqing municipality. It is an urbanization region with the highest development level and significant development potential in western China and is regarded as the fourth pole of China’s economy. By the end of 2020, the permanent population of the SCR reached 115.8 million, which accounted for 8.2% of China’s total population, and the gross domestic product (GDP) of the SCR reached 73,601.55 trillion yuan, which accounted for 7.24% of China’s total GDP (National Bureau of Statistics of China Citation2021). The study area and the population of each city in 2020 are shown in .
Figure 1. Study area: 22 cities in Sichuan Province and Chongqing municipality.
Data sources
The population flow data were obtained from the Baidu platform (http://qianxi.baidu.com/), which has been online since 2014 and uses its own LBS open platform to calculate and analyse LBS big data to realize full, dynamic, and instantaneous visualization of the trajectory and characteristics of population flow before and after the Chinese New Year. Baidu provides daily population flow data for two periods (January 1 – March 15 and September 22 to December 31) in 2020. It records the population inflow trend, population outflow trend, urban population inflow source, and urban population outflow destination. Baidu migration data can help us reveal population flow patterns. show some examples of data on population inflow trends and examples of data on the source of urban population inflow, respectively. In , population flow intensity is a relative value that reflects the size of population flow, and the value of population flow intensity can be compared across cities. In , the sum of the percentage of population flow is equal to 100.
Table 1. Examples of data on population inflow trends.
Table 2. Examples of data on the source of urban population inflow.
The population flow was greatly affected by the COVID-19 epidemic during 2020. Considering the COVID-19 epidemic and holiday factors, four typical time periods were selected for the analysis of population flow patterns (). The first time period (Period I) is the first month of the Chinese lunar calendar, which is from January 25 to 22 February 2020. New local cases of COVID-19 in Chongqing and Sichuan were 516 and 498, respectively, during Period I. In Period I, shortly after COVID-19 appeared in China, people self-isolated at home. On 8 April 2020, China lifted outbound travel restrictions on Wuhan, the city hardest hit by the COVID-19 outbreak in 2020. At that time, COVID-19 was basically controlled in China, and people’s lives generally returned to normal in the following days. The second time period (Period II) is the national day holiday from October 1 to 8 October 2020. Since Period II is a holiday and the COVID-19 epidemic is basically under control, many families choose to travel. The third period (Period III) is the period of normal population flow in the SCR from November 2 to 29 November 2020, and it was not greatly impacted by the COVID-19 epidemic. The number of new local cases is 0 during Periods II and III. Several COVID-19 cases have occurred in Chengdu since December 7. Therefore, population flow in the SCR has been affected to some extent. The fourth period (Period IV) from December 8 to December 27 in 2020 was selected. The number of new local cases is 36 during Period IV.
Table 3. Degree of population flow influenced by the COVID-19 epidemic in the four periods.
Considering the availability of data, indicators of population, society, economy, education, health, infrastructure, and public security were selected. Finally, the resident population, number of employed persons, gross domestic product (GDP), number of college students, number of health institutions, number of personnel in health institutions, total mileage of highways, and rate of criminal cases were obtained from the Sichuan Statistical Yearbook (Citation2020) and Chongqing Statistical Yearbook (Citation2020). The temporal resolution of these data is the annual scale, and the spatial resolution is the city scale; these data were used to reveal the causes of population flow.
Methods
Calculation of regional population flow intensity
Baidu migration data provide the population flow intensity for each city to characterize the overall situation of a city’s population flow as well as the percentage of the population flow of other cities to the population flow intensity of that city. To calculate the regional population flow intensity, the daily regional population flow intensity of each city was first calculated, and then the average daily regional population flow intensity in a time period was obtained. The regional population flow intensity can be calculated by Formula (1).
where represents the regional population flow intensity of city
,
represents the population flow intensity of city
on day
,
represents the percentage of population flow of city
to the population flow intensity of city
on day
,
is the total number of days in that time period, and
represents the number of cities in the study area other than city
. If
is the in-flow intensity, then
is the regional population in-flow intensity; if
is the out-flow intensity, then
is the regional population out-flow intensity.
Stepwise regression analysis
Regression analysis is widely used to infer the relationship between a dependent variable and a series of independent variables. To exclude independent variables that have no significant influence on dependent variables, stepwise regression analysis is intended to be used. Unlike conventional regression analysis that considers all independent variables, stepwise regression is the step-by-step iterative construction of a regression model that involves the selection of independent variables to be used in a final model. Therefore, stepwise regression is able to provide a good explanation of the outcome, and we chose stepwise regression for the analysis of factors affecting regional population flow intensity in this study. R2 and RMSE are widely used indicators for evaluating regression models. Therefore, the performance of the stepwise regression is evaluated by using RMSE and R2 in the article.
Results
Regional population flow intensity in the SCR
Regional population flow intensity varies greatly in different time periods and cities in the SCR. The regional population flow intensity in different time periods is illustrated in . ) show the regional population out-flow intensity and regional population in-flow intensity, respectively.
Figure 2. Regional population flow intensity during the four periods. (a) Regional population out-flow intensity; and (b) regional population in-flow intensity.
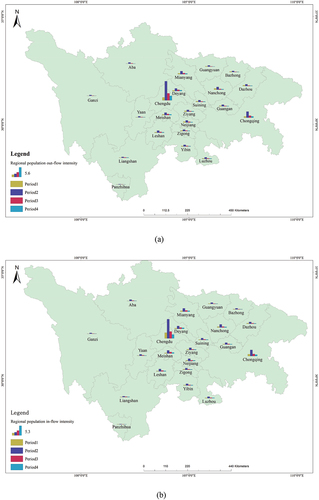
From a temporal perspective, the following conclusions can be drawn from . The time period of population flow from small to large was Period I, Period IV, Period III, and Period II. In Period IV, since the Chinese government took very strong measures to curb the spread of COVID-19 in the early days of the outbreak, the lowest population flow was observed in the SCR. In Period Ⅳ, population flow was affected to some extent by the COVID-19 epidemic and decreased considerably in the SCR compared to that in Period III. Moreover, the population flow in Period IV was significantly greater than that in Period I in view of the small scale of the epidemic. In Period III, because the population flow is slightly affected by the COVID-19 epidemic and most people work on weekdays, the population flow is relatively large in the SCR. During Period II, since the COVID-19 epidemic is basically under control and people do not work on holidays, population flow occurs on a massive scale, and the highest population flow occurs in the SCR.
From the perspective of the spatial distribution of population flow, cities can be roughly divided into five categories according to the regional population flow intensity. The greatest population flow is observed in the first group of cities, including Chongqing and Chengdu, which are the dual core of the SCR. The second group of cities includes Nanchong, Leshan, Neijiang, Mianyang, Deyang, and Meishan, which are the subcentres of the SCR. The third group of cities includes Ziyang, Dazhou, Guangan, Yibin, Suining, Luzhou, and Zigong. The fourth group of cities includes Liangshan, Aba, Yaan, and Guangyuan. The fifth group of cities includes Ganzi, Bazhong, and Panzhihua.
Regional population flow intensity between different cities in the SCR
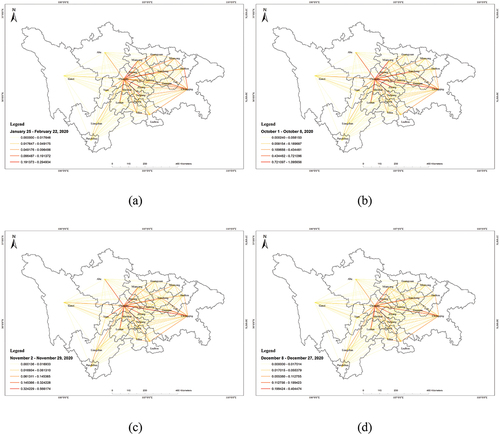
To reveal the spatiotemporal patterns of population flow between different cities, the regional population flow intensity between different cities in the SCR for the four time periods was illustrated. show the regional population out-flow intensity and regional population in-flow intensity, respectively, between different cities in the SCR.
Figure 3. Regional population out-flow intensity between different cities in the SCR. (a) Period I; (b) Period II; (c) Period III; and (d) Period IV.
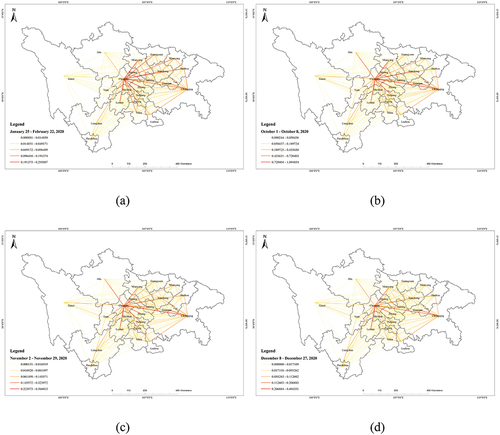
Figure 4. Regional population in-flow intensity between different cities in the SCR. (a) Period I; (b) Period II; (c) Period III; and (d) Period IV.
From , the following conclusions can be drawn. There are 11, 19, 18, and 14 cities in the SCR with the largest population flowing out to Chengdu in Period I, Period II, Period III, and Period IV, respectively. Therefore, Chengdu is the centre of the population out-flow. There are 14 cities in the SCR with the smallest population flowing out to Ganzi in Period I. There are 17, 15, and 8 cities in the SCR with the smallest population flowing out to Panzhihua in Period II, Period III, and Period IV. The population from other cities to Ganzi and Panzhihua is relatively small.
From , the following conclusions can be drawn. The 17, 19, 17, and 14 cities in the SCR with the largest population sources are Chengdu in Period I, Period II, Period III, and Period IV, respectively. Therefore, Chengdu is the centre of population in-flow. The 10 cities in the SCR with the smallest source of population are Aba in Period I. The 19 and 13 cities in the SCR with the smallest source of population are Panzhihua in Period II and Period III, respectively. The 8 cities in the SCR with the smallest source of population are Ganzi in Period IV. The population of Aba, Panzhihua, and Ganzi moving to other cities is relatively small.
Discussion
Analysis of population in-flow outside the study area
Because there were no new local cases of COVID-19 during Periods II and III and only a small number of new local cases of COVID-19 during Period IV, the population in-flow outside the study area in Period I will be further analysed. In Period I, the number of new local cases was mainly related to the population in-flow outside the study area. The top ten provinces with population inflows to Chongqing and Sichuan are shown in .
Figure 5. Population in-flow outside the study area. (a) Population in-flow outside Chongqing; (b) Population in-flow outside Sichuan.
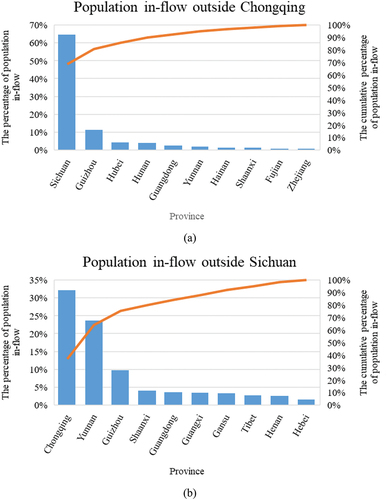
Chongqing and Sichuan are each other’s provinces with the largest population inflows. The percentage of population in-flow from the top ten provinces of Chongqing and Sichuan accounted for 94.19% and 87.32% of the total population in-flow, respectively. Since Hubei, which had the most local cases in Period I in China, was Chongqing’s third largest inflow of out-of-province population, Chongqing had more new local cases than Sichuan in Period I. Although the population flowing into Sichuan from Hubei was relatively small, there were also some new local cases in Sichuan due to the widespread interprovincial movement of people in Period I.
Population flow pattern affected by the lockdown policy
Regional population flow intensity in 2020 was affected by the lockdown policy. For example, COVID-19 cases were reported in Chengdu on 7 December 2020, and some areas in Chengdu imposed lockdown policies. Since Chengdu and Chongqing are the two main cities in the SCR, the regional population flow intensities on two weekends before and after the outbreak of COVID-19 in Chengdu, Chongqing, and all cities in the SCR are listed in .
Table 4. Changes in regional population flow intensity.
The changes in population flow intensity show the following. (1) The population out-flow intensity of Chengdu, Chongqing, and all cities in the SCR in the first weekend after the outbreak of COVID-19 was 59.21%, 72.99%, and 67.06% of the previous weekend. (2) The population in-flow intensity of Chengdu, Chongqing, and all cities in the SCR in the first weekend after the outbreak of COVID-19 was 50.29%, 77.38%, and 67.06% of the previous weekend. (3) Due to the close connection of population flows between Chengdu and Chongqing, the population flow in Chongqing has been affected to a certain extent, but the impact is not more serious than that in Chengdu. (4) Under the COVID-19 lockdown policy, there has been a major drop in population flow intensity in cities where COVID-19 cases have been reported, and population flow intensity will also be affected to a certain extent in cities that are more closely linked to cities where COVID-19 cases have been reported.
The influencing factors of the regional population flow intensity
Stepwise regression analysis is used to analyse the factors affecting regional population flow intensity. Resident population (X1), number of employed persons (X2), GDP (X3), number of college students (X4), number of health institutions (X5), number of personnel in health institutions (X6), total mileage of highways (X7), and rate of criminal cases (X8) are selected as independent variables, and the regional population flow intensity (Y) during the four time periods are selected as dependent variables for analysis at the significance level of 0.05.
Four stepwise regression models for modelling the relationships between the regional population out-flow intensity during the four time periods and the eight independent variables are built. The stepwise regression models are given in Formulas (2–5). Y1, Y2, Y3 and Y4 are the regional population out-flow intensities of Period I, Period II, Period III, and Period IV, respectively. The R2 and RMSE in Formula (2) are 0.627219 and 0.213915, respectively. The R2 and RMSE in Formula (3) are 0.961458 and 0.478429, respectively. The R2 and RMSE in Formula (4) are 0.952019 and 0.190031, respectively. The R2 and RMSE in Formula (5) are 0.950361 and 0.123812, respectively.
Likewise, four stepwise regression models for modelling the relationships between the regional population in-flow intensity during the four time periods and the eight independent variables are built. The stepwise regression models are given in Formulas (6–9). Y5, Y6, Y7 and Y8 are the regional population in-flow intensities of Period I, Period II, Period III, and Period IV, respectively. The R2 and RMSE in Formula (6) are 0.970617 and 0.116928, respectively. The R2 and RMSE in Formula (7) are 0.952041 and 0.492412, respectively. The R2 and RMSE in Formula (8) are 0.949653 and 0.181261, respectively. The R2 and RMSE in Formula (9) are 0.940243 and 0.110898, respectively.
The following conclusions can be drawn from Formulas (2–9). The 7 stepwise regression models (Formulas (3–9)) reveal the relationship between the regional population flow intensity and the eight independent variables very well, whereas since strict home quarantine measures were taken in Period I, the population outflow was very small, and Formula (2) did not fit the results well. Therefore, although X8 is more explanatory to population flow in Formula (2), this is the case where the model does not perform well. Six stepwise regression models include variables X4, and seven stepwise regression models include variables X7, indicating that these two variables are more explanatory to population flow. Therefore, educational resources and transportation facilities are mainly concentrated in core cities, which helps to increase population flow. Since the regional population flow intensity in these three time periods (Period I, Period III, and Period IV) is less than 30% of the regional population flow intensity in Period II, the RMSE of the regional population flow intensity in Period II is larger than that of the other three periods.
Conclusions
In this article, the spatiotemporal patterns of population flow in the SCR during the COVID-19 epidemic in 2020 are explored. The difference in regional population flow intensity at different time periods showed that population flow in the SCR is seriously affected by the COVID-19 epidemic and that more travel occurs between cities on holidays than on weekdays in the SCR. Under the COVID-19 epidemic lockdown policy, there has been a major drop in population flow intensity in cities where COVID-19 cases have been reported, and population flow intensity will also be affected to a certain extent in cities that are more closely linked to city where COVID-19 cases have been reported. Stepwise regression showed that the regional population flow intensity is closer to the population education level and transportation facilities.
This study also has some drawbacks. Since Baidu did not release population flow data for all days in 2020, it is impossible for us to study the daily population flow situation in 2020. Limited by Baidu migration data, we have not studied the strength of connections between different districts in the same city.
Acknowledgements
This research was supported by the Chongqing Social Science Planning Project (No. 2020PY28), Chongqing Youth Innovative Talent Training Program (No. CY210208), and Talent Introduction Program Project of Southwest University (No. SWU020015). We would like to thank the editors and anonymous referees for their constructive comments.
Data availability statement
The data that support the findings of this study are openly available in Figshare (https://figshare.com/articles/dataset/migration_data_Spatiotemporal_patterns/16935061; DOI: 10.6084/m9.figshare.16935061).
Disclosure statement
No potential conflict of interest was reported by the author(s).
References
- Cao, Z., X. Zheng, Y. Liu, Y. Li, and Y. Chen. 2018. “Exploring the Changing Patterns of China’s Migration and Its Determinants Using Census Data of 2000 and 2010.” Habitat International 82: 72–82. doi:10.1016/j.habitatint.2018.09.006.
- Chen, C., J. Ma, Y. Susilo, Y. Liu, and M. Wang. 2016. “The Promises of Big Data and Small Data for Travel Behavior (Aka Human Mobility) Analysis.” Transportation Research Part C 68: 285–299. doi:10.1016/j.trc.2016.04.005.
- Chen, Z. L., Q. Zhang, Y. Lu, Z. M. Guo, X. Zhang, W. J. Zhang, C. Guo, et al. 2020. “Distribution of the COVID-19 Epidemic and Correlation with Population Emigration from Wuhan, China.” Chinese Medical Journal 133 (9): 1044–1050. doi:10.1097/cm9.0000000000000782.
- Chongqing Statistics Bureau. 2020. Chongqing Statistical Yearbook. Beijing: China Statistics Press.
- Chung, C. K. L., J. Xu, and M. Zhang. 2020. “Geographies of COVID-19: How Space and Virus Shape Each Other.” Asian Geographer 37 (2): 99–116. doi:10.1080/10225706.2020.1767423.
- Connolly, C., S. H. Ali, and R. Keil. 2020. “On the Relationships between COVID-19 and Extended Urbanization.” Dialogues in Human Geography 10 (2): 213–216. doi:10.1177/2043820620934209.
- Deville, P., C. Linard, S. Martin, M. Gilbert, F. R. Stevens, A. E. Gaughan, V. D. Blondel, and A. J. Tatem. 2014. “Dynamic Population Mapping Using Mobile Phone Data.” Proceedings of the National Academy of Sciences of the United States of America 111 (45): 15888–15893. doi:10.1073/pnas.1408439111.
- Erdelić, T., T. Carić, M. Erdelić, T. Tišljarić, A. Turkovi Ć, and N. Jelušić. 2021. “Estimating Congestion Zones and Travel Time Indexes Based on the Floating Car Data.” Computers, Environment and Urban Systems 87: 101604. doi:10.1016/j.compenvurbsys.2021.101604.
- Fan, Z., T. Pei, T. Ma, Y. Du, C. Song, Z. Liu, and C. Zhou. 2018. “Estimation of Urban Crowd Flux Based on Mobile Phone Location Data: A Case Study of Beijing, China.” Computers, Environment and Urban Systems 69: 114–123. doi:10.1016/j.compenvurbsys.2018.01.005.
- Gao, J., Y. D. Wei, W. Chen, and J. Chen. 2014. “Economic Transition and Urban Land Expansion in Provincial China.” Habitat International 44: 461–473. doi:10.1016/j.habitatint.2014.09.002.
- Gao, S., J. Rao, Y. Kang, Y. Liang, J. Kruse, D. Dopfer, A. Sethi, J. Reyes, B. Yandell, and J. Patz. 2020. “Association of Mobile Phone Location Data Indications of Travel and stay-at-home Mandates with COVID-19 Infection Rates in the US.” JAMA Network Open 3 (9): e2020485. doi:10.1001/jamanetworkopen.2020.20485.
- González, M., C. Hidalgo, and A. Barabási. 2008. “Understanding Individual Human Mobility Patterns.” Nature 453: 779–782. doi:10.1038/nature06958.
- He, C., T. Chen, X. Mao, and Y. Zhou. 2016. “Economic Transition, Urbanization and Population Redistribution in China.” Habitat International 51: 39–47. doi:10.1016/j.habitatint.2015.10.006.
- Hu, S., C. Xiong, M. Yang, H. Younes, W. Luo, and L. Zhang. 2021. “A big-data Driven Approach to Analyzing and Modeling Human Mobility Trend under non-pharmaceutical Interventions during COVID-19 Pandemic.” Transportation Research Part C 124: 102955. doi:10.1016/j.trc.2020.102955.
- Huang, X., Z. Li, Y. Jiang, X. Li, and D. Porter. 2020. “Twitter Reveals Human Mobility Dynamics during the COVID-19 Pandemic.” PloS One 15 (11): e0241957. doi:10.1371/journal.pone.0241957.
- Huang, R., T. Ju, H. Dong, J. Duan, J. Fan, Z. Liang, and T. Geng. 2021. “Analysis of Atmospheric SO2 in Sichuan-Chongqing Region Based on OMI Data.” Environmental Monitoring and Assessment 193: 849. doi:10.1007/s10661-021-09638-2.
- Jarv, O., R. Ahas, E. Saluveer, B. Derudder, and F. Witlox. 2012. “Mobile Phones in a Traffic Flow: A Geographical Perspective to Evening Rush Hour Traffic Analysis Using Call Detail Records.” PLoS One 7 (11): e49171. doi:10.1371/journal.pone.0049171.
- Ji, T., G. Li, H. Yang, R. Liu, and T. He. 2018. “Comprehensive Drought Index as an Indicator for Use in Drought Monitoring Integrating multi-source Remote Sensing Data: A Case Study Covering the Sichuan-Chongqing Region.” International Journal of Remote Sensing 39 (3–4): 786–809. doi:10.1080/01431161.2017.1392635.Jin.
- Jin, W., C. Zhou, T. Liu, and G. Zhang. 2019. “Exploring the Factors Affecting Regional Land Development Patterns at Different Developmental Stages: Evidence from 289 Chinese Cities.” Cities, no. 91: 193–201. doi:10.1016/j.cities.2018.11.019.
- Kotavaara, O., H. Antikainen, and J. Rusanen. 2011. “Population Change and Accessibility by Road and Rail Networks: GIS and Statistical Approach to Finland 1970-2007.” Journal of Transport Geography 19 (4): 926–935. doi:10.1016/j.jtrangeo.2010.10.013.
- Lai, X., and Y. Gong. 2017. “Relationship between Atmospheric Heat Source over the Tibetan Plateau and Precipitation in the Sichuan–Chongqing Region during Summer.” Journal of Meteorological Research 31: 555–566. doi:10.1007/s13351-017-6045-2.
- Lai, C., T. Shih, W. Ko, H. Tang, and P. Hsueh. 2020. “Severe Acute Respiratory Syndrome Coronavirus 2 (SARS-CoV-2) and Coronavirus Disease-2019 (COVID-19): The Epidemic and the Challenges.” International Journal of Antimicrobial Agents 55 (3): 404–412. doi:10.1016/j.ijantimicag.2020.105924.
- Li, M., G. Zhang, Y. Liu, Y. Cao, and C. Zhou. 2019. “Determinants of Urban Expansion and Spatial Heterogeneity in China.” International Journal of Environmental Research and Public Health 16 (19): 3706. doi:10.3390/ijerph16193706.
- Liu, X., C. Kang, L. Gong, and Y. Liu. 2016. “Incorporating Spatial Interaction Patterns in Classifying and Understanding Urban Land Use.” International Journal of Geographical Information Science 30 (2): 334–350. doi:10.1080/13658816.2015.1086923.
- Matthews, S. A., and D. M. Parker. 2013. “Progress in Spatial Demography.” Demographic Research 28: 271–311. doi:10.4054/DemRes.2013.28.10.
- Meijers, E., and A. Peris. 2019. “Using Toponym co-occurrences to Measure Relationships between Places: Review, Application and Evaluation.” International Journal of Urban Sciences 23 (2): 246–268. doi:10.1080/12265934.2018.1497526.
- Mueser, P. R., and P. E. Graves. 1995. “Examining the Role of economic-opportunity and Amenities in Explaining Population Redistribution.” Journal of Urban Economics 37 (2): 176–200. doi:10.1006/juec.1995.1010.
- National Bureau of Statistics of China. 2021. China Statistical Yearbook. Beijing: China Statistics Press.
- Ratti, C., D. Frenchman, R. M. Pulselli, and S. Williams. 2006. “Mobile Landscapes: Using Location Data from Cell Phones for Urban Analysis.” Environment and Planning B-Planning & Design 33 (5): 727–748. doi:10.1068/b32047.
- Schiller, J., and A. Voisard. 2004. Location-based Services. San Francisco: Morgan Kaufmann.
- Shao, J., Y. Li, and J. Ni. 2012. “The Characteristics of Temperature Variability with Terrain, Latitude and Longitude in Sichuan-Chongqing Region.” Journal of Geographical Sciences 22: 223–244. doi:10.1007/s11442-012-0923-4.
- Shen, J. 2006. “Understanding dual-track Urbanisation in post-reform China: Conceptual Framework and Empirical Analysis.” Population Space and Place 12 (6): 497–516. doi:10.1002/psp.426.
- Shen, J., X. Liu, and M. Chen. 2017. “Discovering Spatial and Temporal Patterns from taxi-based Floating Car Data: A Case Study from Nanjing.” GIScience & Remote Sensing 54 (5): 617–638. doi:10.1080/15481603.2017.1309092.
- Shumway, J. M., and S. M. Otterstrom. 2001. “Spatial Patterns of Migration and Income Change in the Mountain West: The Dominance of service-based, amenity-rich Counties.” Professional Geographer 53 (4): 492–502. doi:10.1111/0033-0124.00299.
- Sichuan Statistics Bureau. 2020. Sichuan Statistical Yearbook. Beijing: China Statistics Press.
- Tang, J., F. Liu, Y. Wang, and H. Wang. 2015. “Uncovering Urban Human Mobility from Large Scale Taxi GPS Data.” Physica a-Statistical Mechanics and Its Applications 438: 140–153. doi:10.1016/j.physa.2015.06.032.
- Veloso, M., S. Phithakkitnukoon, and C. Bento (2011). “Urban Mobility Study Using Taxi Traces.” International Workshop on Trajectory Data Mining and Analysis (TDM) in conjunction with the 13th International Conference on Ubiquitous Computing. ACM Beijing, China, 23–30. doi: 10.1145/2030080.2030086.
- Wang, H., B. Qiao, L. Zhang, F. Yang, and X. Jiang. 2018. “Characteristics and Sources of Trace Elements in PM2.5 in Two Megacities in Sichuan Basin of Southwest China.” Environmental Pollution 242 (B): 1577–1586. doi:10.1016/j.envpol.2018.07.125.
- Wang, X., L. Yang, H. Zhang, Z. Yang, and C. Liu. 2021. “Forecasting Confirmed Cases of the COVID-19 Pandemic with a migration-based Epidemiological Model.” Statistics and Its Interface 14 (1): 59–71. doi:10.4310/20-SII641.
- Wells, C., P. Sah, S. Moghadas, A. Pandey, A. Shoukat, Y. Wang, Z. Wang, L. Meyerse, B. Singer, and A. Galvania. 2020. “Impact of International Travel and Border Control Measures on the Global Spread of the Novel 2019 Coronavirus Outbreak.” Proceedings of the National Academy of Sciences of the United States of America 117 (13): 7504–7509. doi:10.1073/pnas.2002616117.
- Wu, L., Y. Zhi, Z. Sui, and Y. Liu. 2014. “Intra-urban Human Mobility and Activity Transition: Evidence from Social Media check-in Data.” PLoS One 9 (5): e97010. doi:10.1371/journal.pone.0097010.
- Wu, X., J. Yin, C. Li, H. Xiang, M. Lv, and Z. Guo. 2021. “Natural and Human Environment Interactively Drive Spread Pattern of COVID-19: A city-level Modeling Study in China.” Science of the Total Environment 756: 143343. doi:10.1016/j.scitotenv.2020.143343.
- Xu, J., A. Li, D. Li, Y. Liu, Y. Du, T. Pei, T. Ma, and C. H. Zhou. 2017. “Difference of Urban Development in China from the Perspective of Passenger Transport around Spring Festival.” Applied Geography 87: 85–96. doi:10.1016/j.apgeog.2017.07.014.
- Xu, Z., and A. Ouyang. 2018. “The Factors Influencing China’s Population Distribution and Spatial Heterogeneity: A prefectural-level Analysis Using Geographically Weighted Regression.” Applied Spatial Analysis and Policy 11 (3): 465–480. doi:10.1007/s12061-017-9224-8.
- Yao, X. A., H. Huang, B. Jiang, and J. M. Krisp. 2019. “Representation and Analytical Models for location-based Big Data.” International Journal of Geographical Information Science 33 (4): 707–713. doi:10.1080/13658816.2018.1562068.
- Ye, X., S. Li, and Q. Peng. 2021. “Measuring Interaction among Cities in China: A Geographical Awareness Approach with Social Media Data.” Cities 109: 103041. doi:10.1016/j.cities.2020.103041.
- Zhang, C., C. Chen, W. Shen, F. Tang, H. Lei, Y. Xie, Z. Cao, et al. 2020a. “Impact of Population Movement on the Spread of 2019-nCoV in China.” Emerging Microbes & Infections 9 (1): 988–990. doi:10.1080/22221751.2020.1760143.
- Zhang, W., Z. Chong, X. Li, and G. Nie. 2020b. “Spatial Patterns and Determinant Factors of Population Flow Networks in China: Analysis on Tencent Location Big Data.” Cities 99: 102640. doi:10.1016/j.cities.2020.102640.
- Zhao, H., N. Liu, and J. Wang. 2019. “Effects of Human Capital Difference on Migration Destination Preference of Rural Floating Population in China.” Journal of the Asia Pacific Economy 24 (4): 595–617. doi:10.1080/13547860.2019.1641356.