
 ?Mathematical formulae have been encoded as MathML and are displayed in this HTML version using MathJax in order to improve their display. Uncheck the box to turn MathJax off. This feature requires Javascript. Click on a formula to zoom.
ABSTRACT
People’s attitudes towards hydraulic fracturing (fracking) can be shaped by socio-demographics, economic development, social equity and politics, environmental impacts, and fracking-related information. Existing research typically conducts surveys and interviews to study public attitudes towards fracking among a small group of individuals in a specific geographic area, where limited samples may introduce bias. Here, we compiled geo-referenced social media big data from Twitter during 2018–2019 for the entire United States to present a more holistic picture of people’s attitudes towards fracking. We used a multiscale geographically weighted regression (MGWR) to investigate county-level relationships between the aforementioned factors and percentages of negative tweets concerning fracking. Results indicate spatial heterogeneity and varying scales of those associations. Counties with higher median household income, larger African American populations, and/or lower educational level are less likely to oppose fracking, and these associations show global stationarity in all contiguous US counties. Eastern and Central US counties with higher unemployment rates, counties east of the Great Plains with less fracking sites nearby, and Western and Gulf Coast region counties with higher health insurance enrolments are more likely to oppose fracking activities. These three variables show clear East-West geographical divides in influencing public perspective on fracking. In counties across the southern Great Plains, negative attitudes towards fracking are less often vocalized on Twitter as the share of Republican voters increases. These findings have implications for both predicting public perspectives and needed policy adjustments. The methodology can also be conveniently applied to investigate public perspectives on other controversial topics.
Introduction
People’s attitudes towards fracking are influenced by a variety of factors. The key factors that contribute to people’s approval of fracking activity include the public’s trust in local, state and federal governments, knowledge about the fracking process, fracking as a personal income source, and so forth (Klass Citation2015; Truong, Davidson, and Parkins Citation2019). Conversely, the main factors that contribute to negative attitudes include concerns over environmental impacts and fracking role in delaying the pursuit of cleaner, carbon free energy alternatives, etc. (Yan et al. Citation2020). All of these potential factors can be categorized into five groups: socio-demographics, economic development, social equity and politics, environmental impacts, and fracking-related information obtainment. These will be reviewed in detail in the next section.
There currently is a dearth of research considering factors from multiple categories together to understand their associations with people’s attitudes towards fracking. Residents living closer to a hydraulic fracking well may be exposed to higher levels of water and air pollution, and could therefore experience increased health risks (Meng and Ashby Citation2014). People’s geographical proximity to fracking regions could potentially affect their attitudes towards fracking, but this relationship remains understudied. Moreover, the influence of these factors may operate at different geographical scales, and the aforementioned associations can vary across geographical regions. This study fills this literature gap by investigating the associations between these factors and people’s attitudes towards fracking at the county level across the United States.
Most existing research relies on surveys or interviews for data collection, which tends to include limited population samples (Bayer and Ovodenko Citation2019; Boudet et al. Citation2014; Mehany and Guggemos Citation2015). For a better representation of the entire population, other data collection methods that can cover more samples in a large spatial-temporal scale are needed. Social media, a group of interactive Web 2.0 Internet-based applications, has constructed virtual communities for users to create and share user-generated content (Kaplan and Haenlein Citation2010; Kietzmann et al. Citation2011). Social media has attracted a large user population who create massive digital footprints; many social media platforms (such as Twitter, Facebook, and Instagram) also support geo-referenced information sharing (Gong and Yang Citation2020). The crowd-sourced, high-volume, geo-referenced, and open source social media data are available at a much lower cost, faster speed, and larger amount in comparison to traditional data collection methods such as surveys and censuses (Rizwan, Wan, and Gwiazdzinski Citation2020). Social media data, as a type of emerging spatial big data, provide an unprecedented opportunity for uncovering the spatial-temporal patterns of human behaviour and attitudes at a large scale (Gong and Wang Citation2021; Liu et al. Citation2021). Twitter is popular among social media users because of its shorter messaging (up to 280 characters), directed-following, and retweeting features can facilitate faster information dissemination and better user interactions (Gong and Lane Citation2020; Gong and Ye Citation2021; Huberman, Romero, and Wu Citation2008; Kwak et al. Citation2010). Therefore, Twitter is a useful social media platform to collect large samples of people’s attitudes towards fracking activities across a large geographic area in this study.
This study innovatively compiled geo-referenced social media big data from Twitter during 2018–2019 in the United States to analyse public perspectives on fracking from geographical lenses. It addresses two research questions: (1) which factors have significant influences on people’s attitudes towards fracking as expressed on Twitter; and (2) what is the degree of spatial heterogeneity and scales of those influences. These findings have implications for predicting public perspectives and making adjustments in related policies. The methodology of this study can also be conveniently applied to investigate public perspectives on other controversial topics.
Related literature
We have synthesized the factors that may affect attitudes towards fracking into five general categories: socio-demographic factors, economic development factors, social equity and politics factors, environmental impact factors, and information obtainment factors. These categories and their subcategories are listed in .
Table 1. Factors affecting people’s attitudes towards fracking activities.
Socio-demographic factors include gender, age, and education. Truong, Davidson, and Parkins (Citation2019) and Boudet et al. (Citation2016) find that males tend to have a more positive attitude to fracking than females of the same age group, especially for the age group from 35 to 50. This pattern may be because of a predominantly male workforce in the energy sector (Truong, Davidson, and Parkins Citation2019). Generally, younger age groups are more likely to be against fracking than older ones (Boudet et al. Citation2016; Jacquet Citation2012; Yu et al. Citation2018). Education is a debated predictor for public perspectives on fracking. Some studies argue that college-educated people tend to support fracking activity (Boudet et al. Citation2016; Pierce et al. Citation2018), yet other research shows exactly the opposite relationship (Jacquet Citation2012).
Economic development factors impacting public attitudes towards fracking include the availability of other natural resources to offset the demand for fracking, income level and source, unemployment rate, and poverty rate. In the UK, many people tend to rely on other natural resources (e.g. nuclear and wind energy) as a replacement for fracking to meet increasing energy demands, so other natural resources may play a role in negatively affecting people’s attitudes towards fracking (Howell Citation2018). Pierce et al. (Citation2018) found that people with higher median household income tend to be more supportive of fracking. A person’s source of income may also play an important role. For example, in the United States, some landowners who signed lease agreements with oil companies receive economic incentives from fracking activities, which sometimes became their main source of income (Bomberg Citation2013). Such households are less likely to oppose fracking or the oil and gas industry writ large (Kriesky et al. Citation2013).
Unemployment rate is a debated factor in influencing people’s attitudes towards fracking. Barnes (Citation2013) and Zirogiannis et al. (Citation2015) find that greater unemployment rates encourage support for fracking; however, Walsh, Bird, and Heintzelman (Citation2015) find unemployment rates have no significant impact on public perspectives. Regarding the poverty rate, other studies show that people living in states with higher poverty rates are more likely to support fracking than affluent ones (Howell et al. Citation2017).
Attitudes towards fracking may also be influenced by issues surrounding social equity, local and state energy policies, economic nationalism, and political partisanship. Social equity refers to the equitable distribution of social wealth and resources. Fracking has had disproportionate costs and benefits for different groups of people, particularly in terms of the inequitable distribution of negative externalities on marginalized populations (Wakefield Citation2020). For example, more than one million African Americans live within a half mile of existing natural gas facilities and face an elevated risk of cancer and asthma due to toxics emitted by natural gas development (Schneider et al. Citation2017). In response, anti-fracking movements organized by African American communities in New York, for example, have forced government leaders to address environmental problems from oil and gas sector (Wakefield Citation2020). The energy policies vary across scales where state governments tend to favour economic development and increasing employment rates while local governments tend to balance economic benefit with environmental protection (Davis Citation2017; Howell Citation2018). These policy variances could have influences on individuals’ attitudes towards fracking, so state-level approval of fracking can be at odds with local approval (Howell Citation2018). Attitudes can also be influenced by perceptions of economic nationalism; for example, concerns over energy security or mistrust of specific foreign companies overshadow environmental concerns and lead to relatively positive attitudes towards domestic shale gas production (Jaspal, Nerlich, and Lemańcyzk Citation2014; Howell Citation2018; Lachapelle, Kiss, and Montpetit Citation2018). Generally, fracking encounters considerably greater scepticism among Democrats and has relatively more support among Republicans (Lee and Clark Citation2020). However, this relationship is not entirely consistent across the United States (Brown et al. Citation2013; Lee and Clark Citation2020).
The environmental impacts of fracking take two main forms. First, because fracking produces a huge amount of contaminated wastewater as a byproduct, the negative environmental health impacts associated with the process are diverse when wastewater is improperly managed (Christenson, Goldfarb, and Kriner Citation2017). Second, municipal and agricultural water supplies near fracking operations may become contaminated or depleted (Brasch Citation2016), leading to diminished agricultural productivity and that may be linked to increased cancer incidences in nearby communities (Brasch Citation2016). Critics of fracking argue that the long-term environmental health ramifications of fracking overshadow the short-term economic benefits (Brasch Citation2016), a problem that is compounded by the fact that states regulate and market water within a different regulatory framework that parallels the fracking industry (Howell Citation2018).
Information obtainment factors that influence public perspectives on fracking include people’s familiarity with the fracking process and the media platforms they use to receive information. While research suggests that people with more knowledge of the fracking process tend to support it, they are also more likely to actively work in the energy sector or be close to someone who does (Kriesky et al. Citation2013). Conversely, people who have limited knowledge about fracking tend to be against the practice (Stedman et al. Citation2016). The mechanisms by which people receive information are also important because they can inform people about fracking and guide their approval or disapproval (Gearhart, Adegbola, and Huemmer Citation2019). Similarly, cable news generally fails to enhance people’s limited knowledge about fracking, because such outlets tend to use thematic frames when reporting, further entrenching people’s existing attitudes (Gearhart, Adegbola, and Huemmer Citation2019). Boudet et al. (Citation2014) also found that people who read newspapers more than once per week are more likely to oppose fracking, but people who watch TV news more than once per week are more likely to support it.
Data and method
This study collected geo-referenced fracking-related Twitter data during 2018–2019 for the entire United States, categorized the sentiments of tweets using a machine learning approach, and used a multiscale geographically weighted regression (MGWR) to investigate county-level relationships between the contributing factors and percentages of negative tweets concerning fracking.
Data collection
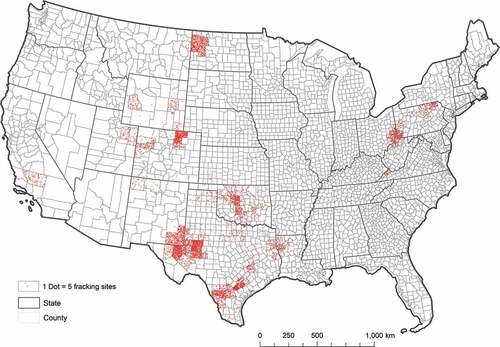
Data on fracking sites was collected from FracFocus (Citation2021), an online repository of about 175,000 fracking site disclosures in the United States. The data used in this analysis include all active fracking sites (37,714) reported in 2018 and 2019. shows the distribution of active fracking sites in contiguous US counties. Most fracking sites lie just east of the Great Plains and across the Rocky Mountains, with some diasporas in Southern California and the Northeast. Most of these counties had fewer than 500 active fracking sites in 2018 and 2019. Only eight counties (Weld in Colorado; Reeves, Midland, Martin, and Karnes in Texas; Lea and Eddy in New Mexico; and McKenzie in North Dakota) have more than 1000 active fracking sites.
Figure 1. Distribution of active fracking sites in contiguous US counties from 2018 to 2019.
Socio-demographic data for all contiguous US counties in year 2018 were gathered from the U.S. Census Bereau (Citation2021). Sociodemographic variables used in the present analysis are age (percentage of people aged 18–49 and 50 or older), gender (female-to-male ratio),Footnote1 education (percentage of people without bachelor’s degree), median household income, health insurance (percentage of people without health insurance), unemployment rate, and race/ethnicity (percentage of Hispanic, non-Hispanic white, and non-Hispanic African American populations). Partisanship data for all counties were collected from the 2016 election results (MIT Election Data and Science Lab Citation2017). Each variable is converted to standardized Z-scores for further analysis, because standardization allows the bandwidths of MGWR modelling to directly indicate the spatial scales at which the conditional relationship between the outcome variable and the independent variable varies (Oshan et al. Citation2019; Li and Fotheringham Citation2020).
Tweets related to fracking were collected in real-time during the entirety of 2018–2019 using the Twitter streaming application programming interfaces (APIs). Tweets were filtered using fracking-related keywords, such as ‘fracking’, ‘hydraulic fracturing’, ‘globalfrackdown’, ‘natgas’, ‘shale’, and ‘shalegas’. Each tweet was recorded with its ID, username, creation time, full text, and the number of times it has been liked, retweeted, and quoted.
Twitter data filtering
More than 300,000 raw tweets were collected; however, we found that the collected Twitter stream filtered by single fracking-related keyword may erroneously include unrelated tweets, such as one tweet which reads: ‘I fracking love this juice’. In response, we utilized keyword combinations that are manually identified from 2000 tweets (e.g. ‘fracking + water’, ‘fracking + environment protect’, and ‘fracking + drill’) to further filter pertinent tweets. A list of the keyword combinations can be found in . We then further extracted tweets with coordinates or places as geotags from the selected tweets. The coordinates and places were geocoded using ESRI ArcMap 10.6.1 (Citation2019). Based on these geotagged tweets, we mapped the tweet density per county across the United States. Overall, 59,605 fracking related geotagged tweets were identified (). Counties with fewer than 20 tweets related to fracking were excluded from analysis. Here, we set 20 as the threshold because we need to find a balance between the number of counties included and the number of tweets in each county. Fewer tweets per county may not accurately indicate people’s attitudes towards fracking activities broadly; while higher thresholds of counties’ tweets may significantly reduce the number of counties, which could not clearly represent the spatial variations of people’s attitudes towards fracking and potential contributing factors. There are a total of 276 contiguous US counties with 20 or more applicable tweets during the study timeframe.
Figure 2. Number of tweets toward fracking in contiguous US counties during 2018–2019.
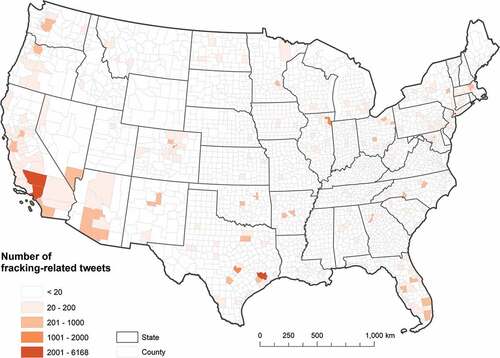
Table 2. Keyword combinations for filtering fracking-related tweets.
Sentiment analysis
We conducted sentiment analysis on each tweet to understand people’s attitudes towards fracking using a machine learning approach as follows. First, we cleaned all tweet texts by (1) removing links, punctuation, and special characters; (2) removing words that are not number or letters; (3) filtering out the non-content-bearing words (such as ‘the’, ‘at’, ‘which’, and ‘in’); and (4) conducting spelling correction and lemmatization (converting different forms of a word to its root form). Second, we manually classified 2000 tweets into three sentiment groups (positive, neutral, and negative) and used them to train a Naïve Bayes text classifier. The classifier’s average prediction accuracy based on the 10-fold cross validation is 73.3%. Third, we used the text classifier to evaluate the sentiments of all other tweets. From the data, we found that people who hold a negative attitude towards fracking are more likely to share their attitudes on Twitter. To better represent the public perspectives on fracking, this study only focused on the percentage of negative tweets among all collected tweets in each county for further analysis.
Regression analysis
We analysed the spatial patterns of county-level negative tweet percentages towards fracking and examined contributing factors of those patterns using different regression models. We first checked the regression assumptions in the data visually through diagnostic plots. After the diagnosis of multicollinearity and exclusion of multicollinear explanatory variables, the potential contributing factors (explanatory variables) examined in this study include: ratio of females to males, percentage of people aged 18 to 49 and 50 or older, percentage of Hispanic and non-Hispanic African American populations, unemployment rate, median household income, number of fracking sites within 100 km of each county, percentage of people without a bachelor’s degree or higher, percentage of people without health insurance, the ratio of Democratic to Republican voters, and tweet density per 100,000 people. An ordinary least squares (OLS) linear regression model was first applied to identify global associations between those explanatory variables and negative tweet percentages towards fracking. Since the associations may vary across geographical regions, we further investigated the local patterns of the associations using geographically weighted regression (GWR), which is a popular choice for modelling such spatially varying associations. GWR is a local model that applies spatial weights in calculations such that observations closer to each other exert stronger influence than those farther away within a given bandwidth (Brunsdon, Fotheringham, and Charlton Citation1998). However, in GWR, only one bandwidth is employed for all explanatory variables assuming the relationship varies over the same spatial scale. As discussed earlier, the influence of the explanatory variables can have different geographical scales (e.g. national, state, county, or local scales). Therefore, the multiscale geographically weighted regression (MGWR) is more appropriate than the GWR in this context because it considers a separate bandwidth for each explanatory variable (Fotheringham, Yang, and Kang Citation2017). The MGWR model formulation can be described as follows:
where is the response variable at location
,
is the error term,
is the jth explanatory variable (including the intercept),
is the coefficient for the jth explanatory variable, and the bwj in
indicates the different bandwidth for each explanatory variable (Fotheringham, Yang, and Kang Citation2017).
Consequently, a smaller bandwidth indicates a localized relationship while a larger bandwidth shows a relationship with a long-range regional or global trend. We used the MGWR 2.2 software to optimize the optimal bandwidth and estimate the local coefficients for each explanatory variable. An adaptive bi-square spatial kernel was used as the weighting scheme to calibrate the model, and the corrected Akaike information criterion (AICc) is used to evaluate the model performance in the optimization process (Oshan et al. Citation2019; Li and Fotheringham Citation2020).
Results and discussion
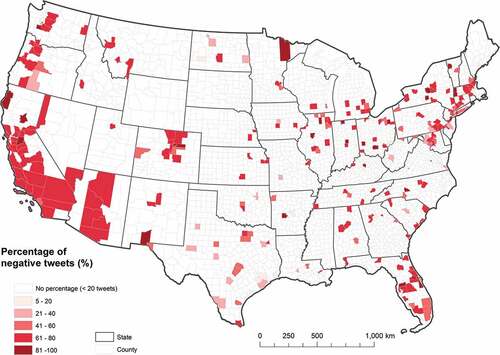
Of the 276 contiguous US counties included in the present analysis, there were typically fewer than 900 fracking-related tweets in each county during 2018–2019. Only four counties nationwide (Queens in New York; Harris in Texas; and Kern and Los Angeles in California) have more than 2000 related tweets. The machine learning algorithm identified 35,048 negative tweets, 284 positive tweets, and 24,272 tweets with neutral sentiments nationwide. In this study, more than 60% of all collected tweets express a negative attitude towards fracking ().
Figure 3. Percentage of negative tweets toward fracking in contiguous US counties with 20 or more fracking-related tweets during 2018–2019.
lists the parameter coefficients associated with negative tweet percentages and significance levels of each from the OLS regression. The following explanatory variables have statistically significant negative associations: the percentage of non-Hispanic African American population, the median household income, the sum of fracking sites within 100 km buffer of a county, the percentage of people without health insurance, and the percentage of people without bachelor’s degree. Percentage of people without bachelor’s degree shows the strongest negative association (coefficient = −0.284, p-value = 0.001) in the model. Conversely, the percentage of people over the age of 50 and the unemployment rate both have statistically significant positive associations with negative tweet percentages. Although no statistically significant association in national scale is shown in other variables, including the female-to-male ratio, the percentage of people aged 18–49, the percentages of Hispanic population, the ratio of Democratic to Republican voters, and the tweet density per 100,000 people, there might be local associations available which were supported by existing literature. Therefore, all 12 variables were included in the MGWR model to further investigate their multiscale local patterns.
Table 3. OLS regression results showing associations between potential explanatory variables and percentage of negative tweets towards fracking in contiguous US counties during 2018–2019.
The MGWR model generates better goodness of fit than the OLS model. The R2 value increases from 0.246 to 0.384, and the corrected AIC value decreases from 735 to 721. Although the improvement does not seem to be obvious, the MGWR model removed the spatial dependence in the residuals of OLS model. The Moran’s I value for the OLS model’s residual is 0.065 (p-value = 0.015), which shows a statistically significant clustered pattern suggesting a poor model specification; while the Moran’s I value for the MGWR model’s residual is −0.012 (p-value = 0.755), demonstrating a random distribution. Therefore, we conclude that the MGWR can better predict the negative tweet percentages towards fracking in this study.
The MGWR model provides a coefficient and an associated t-statistic for every explanatory variable in each county, where the coefficient sign indicates the direction of an association and the t-statistic’s value beyond the adjusted t-value threshold for 95% confidence level is statistically significant (). The female-to-male ratio and population percentages breakdown by age (age group 18–49 and over 50) do not show significant associations with the percentage of negative tweets towards fracking (). For variables pertaining to the racial composition of population in US counties, Hispanic population percentage fails to significantly predict negative tweet percentage regarding fracking (); however, the African American population percentage is negatively associated with negative tweet percentages at the significance level of 0.05 nationwide (). Counties in Southern, Southwest, and Great Plains regions show stronger negative correlations than other regions with coefficients less than −0.4 (). Considering the African American population distributions in the 276 counties, the pattern indicates that counties with more African Americans are less likely to oppose fracking. The result is conflicting with the New York result that people of colour are more likely to be against fracking due to the inequitable distribution of environmental problem (Wakefield Citation2020). However, the immediate economic benefits and local job opportunities brought by fracking could have overshadowed the long-term environmental health concerns in this national study, which changed the African American population’s perspective on fracking activities.
Figure 4. MGWR model results showing county-specific parameter estimates for associations between percentage of negative tweets toward fracking and: (a) female-to-male ratio, (b) percentage of people aged 18–49, (c) percentage of people aged 50 or older, (d) percentage of Hispanics, (e) percentage of non-Hispanic African Americans, (f) unemployment rate, (g) median household income, (h) sum of fracking activity within 100km buffer, (i) percentage of people without health insurance, (j) percentage of people without bachelor’s degree, (k) ratio of Democratic to Republican voters, and (l) tweet density per 100,000 people.
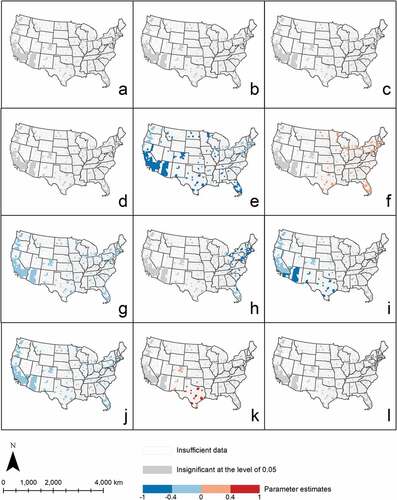
There are significant positive associations between the unemployment rate and the percentage of negative tweets in most Eastern and Central US counties (). The pattern is consistent with the conclusion by Belakhdar (Citation2019) that negative sentiments towards fracking rise as the unemployment rate increases. However, this relationship is not significant across the entire Western United States (). The East-West divide may be influenced by the increased prevalence of fracking across the Western states, as displayed in . The median household income has a significant negative association with negative tweet percentage across the whole country at the level of 0.05 (). This pattern is consistent with extant literature that finds people who have higher income are more likely to approve fracking (Pierce et al. Citation2018).
The number of fracking sites within 100 km of US counties similarly falls along the East-West divide such that it only shows a significant negative association with negative tweet percentage east of the Great Plains, especially in New England (). Florida counties show strong opposition to fracking even when there are almost no fracking activities within 100 km. Extant studies argue that people who directly benefit from fracking are less likely to hold negative attitudes towards fracking (Howell et al. Citation2017; Kriesky et al. Citation2013). Therefore, one possible reason of the current pattern is that most people in the Eastern United States do not enjoy direct benefits from fracking activities which are primarily distributed in the Great Plain ().
In most Western and Gulf Coast counties, the percentage of people without health insurance is negatively associated with the percentage of negative tweets (). Counties in the Southwest show stronger negative correlations (coefficients < −0.4) than other counties (). In other words, as enrolment in health insurance increases, a county is more likely to oppose fracking activities. One possible reason is that people with lower socioeconomic status are less likely to have health insurance (Arpey, Gaglioti, and Rosenbaum Citation2017Citation2013); instead, they rely on employment from fracking activities and are more supportive of fracking. However, this relationship is different in the Eastern US counties, where countywide health insurance levels do not predict negative tweet percentages (). The percentage of people without a bachelor’s degree is significantly negatively associated with negative tweet percentages across the country (p < 0.05) (). As discussed in the background section, education is a controversial predictor for public perspectives on fracking. The current pattern matches the argument by Jacquet (Citation2012) that people with a bachelor’s degree or higher are prone to show relatively negative attitudes towards fracking; however, the pattern contradicts with the conclusions of some other studies (Boudet et al. Citation2016; Pierce et al. Citation2018).
The ratio of Democratic to Republican voters by county is positively associated with the percentage of negative tweets in some counties across the southern Great Plains, especially in Texas (). It indicates that as the percentage of Republican voters increases, negative attitudes towards fracking are less often vocalized on Twitter. However, this relationship is insignificant elsewhere across the country. This inconsistent pattern matches the existing literature on party affiliation and attitudes towards fracking (Berardo et al. Citation2020; Lee and Clark Citation2020). Finally, tweet density is insignificantly associated with the negative tweet percentage in all counties (). Therefore, the tweet density could not predict the public perspectives on fracking.
Bandwidth is the range (distance or number of nearest neighbours) over which data is borrowed in each local regression calculation; it measures the spatial scale of the relationship between an independent variable and an dependent variable (Li et al. Citation2020; Oshan et al. Citation2019). In other words, it can provide intuitive interpretations of the spatial scale of each variable’s underlying data generating process (Li et al. Citation2020; Oshan et al. Citation2019). shows the optimal bandwidths with 95% confidence intervals for the aforementioned 12 explanatory variables, where the numbers represent the amount of nearest counties to a regression focus (a county) that have been borrowed and down-weighted according to the distance in local regression. The female-to-male ratio, the unemployment rate, the median household income, percentages of Hispanics, non-Hispanic African Americans, people aged 18 to 49, and people without a bachelor’s degree all have a bandwidth of between 250 and 275. Considering the total number of counties included in this study is 276, the influence of these seven variables on the negative tweet percentage towards fracking is virtually the same in each county across the country. Therefore, these relationships demonstrate more global stationarity, as shown in . The percentage of people aged 50 or older, and tweet density per 100,000 people in US counties have bandwidths around 100, which indicate more locally varying relationships with the negative tweet percentage. However, the patterns are not clear as coefficients associated with these two variables are insignificant at the level of 0.05 across the country (). The other three variables have moderate bandwidths around 150 to 200, which show relative stationary effects on negative tweet percentage within regions and varying effects across regions. For example, the ratio of Democratic to Republican voters () and sum of fracking activities within 100 km buffer () shows significant associations in the Southern and Eastern regions respectively, but the relationship does not persist in other regions.
Table 4. Bandwidths for potential explanatory variables in the MGWR model.
Most variables’ local parameter estimates from the MGWR model generally align with their global counterpart in OLS model, except for the percentage of people aged 50 or older and the ratio of Democratic to Republican voters ( and ). In the global OLS model, the ratio of Democratic to Republican voters does not show statistically significant associations with the percentage of negative tweets at the national level; however, the local estimates illustrate significant positive associations in some regions (). On the other hand, the association between the percentage of elderly people and the negative tweets percentage towards fracking is significantly positive (coefficient = 0.322, p-value = 0.012) in the global OLS model, yet the local estimates do not exhibit any significant association (). Both patterns show the Simpson’s paradox from spatial perspective, which means contradictory results show in same dataset at different spatial scales. Therefore, we need to be careful when interpreting these relationships because they depend on the scale of the analysis.
Compared to traditional data collection methods, such as surveys and interviews, the social media data we used can cover more samples of people’s attitudes towards fracking activity across a larger geographic area. To ensure the study power of the spatial statistics, a threshold of 20 fracking-related tweets is set to filter the counties in this study. Because the uneven distribution of geotagged tweets about fracking in county level, only 276 contiguous US counties have been included in the analysis. The question of how to appropriately include counties with fewer than 20 applicable tweets remains. Analysis of counties with a lower threshold of 10 fracking-related tweets resulted in similar spatial patterns of statistical significance, but the coefficient values were significantly reduced. Another possible solution is to aggregate all variables to state level to increase the tweet sample size in each geographic unit. However, it will diminish the variation of the associations in finer scales that have been identified in . Therefore, a balance between the sample size and geographic scale is key to the pattern explorations in this type of study.
Limitations and future research
Several limitations of the present study should also be observed. First, Twitter is the only social media platform used in this study to ascertain people’s attitudes towards fracking. Because people who have a negative attitude towards fracking activity are more likely to voice their opposition via Twitter, we addressed this limitation and only selected the percentage of negative tweets in US counties with 20 or more tweets as our dependent variable. One direction for future research is to integrate data from more social media platforms, such as Facebook and Instagram, to achieve a more representative and balanced distribution of sentiments. Like the traditional data collection methods, there could be potential bias in people’s demographics in the data sample because the geotagged Twitter data exclude people who do not use social media and tweets without geotags (Zhang and Zhu Citation2018). Also, there might be potential location spoofing issues if users intentionally include incorrect geotags in their tweets (Gong and Yang Citation2020). However, the advantage of Twitter data is its coverage of much larger samples of people’s attitudes towards fracking activities across a large geographic area in this study. Future studies may consider further investigate whether the geotagged tweets are representative samples of the entire tweets and tweeting locations, and also combine the traditional data sources with social media data to overcome the potential bias.
Second, because it is untenable to manually classify sentiments for all 59,605 fracking-related tweets collected in this study, we trained a sentiment classifier based on 2000 manually classified tweets and leveraged the classifier to evaluate the remaining tweets’ sentiments. This machine learning approach basically generated the associations of word combinations and sentiments based on the training datasets. Although the cross-validation accuracy of the current approach is relatively high, sentiment misclassification may still arise during the predicting process due to the complexities in human communication, such as sarcasm, word ambiguity, negation, and multipolarity (Eremyan Citation2018). Future research can attend to the problems of misclassification by training multiple classifiers (e.g. maximum entropy classifier, decision tree classifier, and positive Naïve Bayes classifier) based on the manual labelled tweets with sentiments, then picking the classifier with the best accuracy.
Third, most of the exploratory variables in this study can be easily derived without uncertainty from the census data and election data. However, there are some subjectivities in calculating the number of proximate fracking activities. Because many extant studies only consider fracking sites within a relative short distance to the residential areas, this study tries to expand this threshold to include the influence of more fracking sites. We only chose a 100 km buffer of each county to represent the county’s proximate area and counted for the number of fracking activities within this range. Although the model performance is acceptable in the current results, future studies could further investigate how the changing buffer distance threshold (e.g. from 10 km to 200 km) could affect the local association patterns in .
Fourth, this study only examined the spatial aspect of people’s attitudes towards fracking over the two-year period as a whole, without accounting for the temporal change in those attitudes. This is primarily due to the uneven distribution of tweets, which does not allow us to examine temporal changes in counties with fewer samples. Future studies could investigate how people’s attitudes towards fracking change over time by investigating only the counties with more samples or by analysing spatial patterns during another time period and comparing them to the current patterns.
Finally, the data of fracking sites included in the present study is from FracFocus (Citation2021), a catalogue of voluntary disclosures from private fracking operations. To the best of our knowledge, this is the most complete record of fracking sites in the United States, but there is still uncertainty in whether all fracking sites across the nation are included. Other data sources of fracking locations or crowdsourced reporting of fracking sites could be used to cross validate the current datasets in future studies.
Conclusion
This study innovatively used geo-referenced social media big data from Twitter to investigate public perspectives on fracking activities from geographical lenses. One strength of the study is Twitter’s coverage of larger samples in the entire United States than traditional data collection methods, which provides a more holistic picture of people’s attitudes towards fracking activities. The study also clearly depicts how the influences of different factors on attitudes towards fracking varies across geographical regions and at different geographical scales by applying an advanced local regression approach (MGWR).
Generally, most fracking-related tweets from 2018 to 2019 in the United States exerted negative or neutral attitudes towards fracking, but the percentages fluctuate among counties. Comparing with the global OLS model, the MGWR generates better goodness of fit and removed the spatial dependence in the residuals, indicating the MGWR’s better predicting potential of the negative tweet percentages towards fracking.
The median household income and percentages of African Americans and people without a bachelor’s degree have strong negative associations with negative tweet percentage across the whole country, indicating counties with higher median household income, more African Americans, and/or lower educational level are less likely to oppose fracking. The large bandwidths of these three variables also demonstrate more global stationarity in these associations. Unemployment rates show positive associations with negative tweet percentages in most Eastern and Central US counties; proximate fracking site amounts only show negative associations in counties east of the Great Plains; and populations without health insurance only show negative associations in Western, Gulf Coast region counties. In those regions, as unemployment rate increases, proximate fracking site amount decreases, and/or enrolment in health insurance increases, a county is more likely to oppose fracking activities. All three variables demonstrate clear East-West divide geographical patterns in influencing public perspective on fracking. The East-West divide may be influenced by the increased prevalence of fracking across the Western states. In counties across the southern Great Plains, especially in Texas, negative attitudes towards fracking are less often vocalized on Twitter as the percentage of Republican voters increases. The female-to-male ratio, population percentages breakdown by age, the percentage of Hispanics, and the tweet density do not show significant associations with the percentage of negative tweets towards fracking.
Spatial heterogeneities and scales of these associations identified in this study can provide a guide for predicting people’s attitudes towards fracking activity based on different factors in future studies. The findings can also help policymakers to understand public perspectives on fracking and make evidence-based policy adjustments. As an example, while enjoying the economic benefits and job opportunities that fracking brings, the relevant policy should consider public perspectives from different groups as a way to avoid inequitable distribution of environmental burdens, such as water contamination. The methodology can also be conveniently used to investigate public perspectives on other controversial topics, such as siting of wind farms, industrial solar facilities, and hazardous waste facilities.
Disclosure statement
No potential conflict of interest was reported by the authors.
Additional information
Funding
Notes
1. The census data for 2018 do not include data for more inclusive gender types other than the binary genders.
References
- Arpey, N. C., A. H. Gaglioti, and M. E. Rosenbaum. 2017. “How Socioeconomic Status Affects Patient Perceptions of Health Care: A Qualitative Study.” Journal of Primary Care & Community Health 8 (3): 169–175. doi:10.1177/2150131917697439.
- Barnes, M. 2013. “Hydrofracking and Policymaking in New York Municipalities.” American Political Science Association 2013 Annual Meeting. Chicago, IL, USA. https://papers.ssrn.com/sol3/papers.cfm?abstract_id=2301197
- Bayer, P., and A. Ovodenko. 2019. “Many Voices in the Room: A National Survey Experiment on How Framing Changes Views Toward Fracking in the United States.” Energy Research & Social Science 56. doi:10.1016/j.erss.2019.05.023.
- Belakhdar, N. 2019. “When Unemployment Meets Environment. The Case of the Anti-Fracking Coalition in Ouargla.” Mediterranean Politics 24 (4): 420–442. doi:10.1080/13629395.2019.1639026.
- Berardo, R., F. Holm, T. Heikkila, C. M. Weible, H. Yi, J. Kagan, C. Chen, and J. Yordy. 2020. “Hydraulic Fracturing and Political Conflict: News Media Coverage of Topics and Themes Across Nine States.” Energy Research & Social Science 70: 101660. doi:https://doi.org/10.1016/j.erss.2020.101660.
- Bomberg, E. 2013. “The Comparative Politics of Fracking: Networks and Framing in the US and Europe.” American Political Science Association 2013 Annual Meeting. Chicago, IL, USA. https://papers.ssrn.com/sol3/papers.cfm?abstract_id=2301196
- Boudet, H., D. Bugden, C. Zanocco, and E. Maibach. 2016. “The Effect of Industry Activities on Public Support for ‘Fracking.” Environmental Politics 25 (4): 593–612. doi:10.1080/09644016.2016.1153771.
- Boudet, H., C. Clarke, D. Bugden, E. Maibach, C. Roser-Renouf, and A. Leiserowitz. 2014. ““Fracking” Controversy and Communication: Using National Survey Data to Understand Public Perceptions of Hydraulic Fracturing.” Energy Policy 65: 57–67. doi:https://doi.org/10.1016/j.enpol.2013.10.017.
- Brasch, W. M. 2016. Fracking America: Sacrificing Health and the Environment for Short-Term Economic Benefit. Spectrum Publishers. https://books.google.com/books?id=eEv_vQAACAAJ.
- Brown, E., K. Hartman, C. P. Borick, B. G. Rabe, and T. M. Ivacko. 2013. The National Surveys on Energy and Environment Public Opinion on Fracking: Perspectives from Michigan and Pennsylvania ( May 2013). Ann Arbor, MI, USA: Center for Local, State, and Urban Policy (CLOSUP). https://ssrn.com/abstract=2313276
- Brunsdon, C., S. Fotheringham, and M. Charlton. 1998. “Geographically Weighted Regression.” Journal of the Royal Statistical Society: Series D (The Statistician) 47 (3): 431–443. doi:10.1111/1467-9884.00145.
- Christenson, D. P., J. L. Goldfarb, and D. L. Kriner. 2017. “Costs, Benefits, and the Malleability of Public Support for “Fracking.” Energy Policy 105: 407–417. doi:https://doi.org/10.1016/j.enpol.2017.03.002.
- Davis, C. E. 2017. “Shaping State Fracking Policies in the United States: An Analysis of Who, What, and How.” State and Local Government Review 49 (2): 140–150. doi:10.1177/0160323X17712555.
- EIA (U.S. Energy Information Administration). 2011. “Shale Gas is a Global Phenomenon.” U.S. Energy Information Administration. https://www.eia.gov/todayinenergy/detail.php?id=811
- EIA (U.S. Energy Information Administration). 2021. “How Much Shale Gas is Produced in the United States?” U.S. Energy Information Administration. https://www.eia.gov/tools/faqs/faq.php?id=907&t=8
- Eremyan, R. 2018. “Four Pitfalls of Sentiment Analysis Accuracy.” https://www.toptal.com/deep-learning/4-sentiment-analysis-accuracy-traps
- ESRI (Environmental Systems Research Institute). 2019. “ArcMap 10.6.1 (10.6.1).” Environmental Systems Research Institute.
- Fotheringham, A. S., W. Yang, and W. Kang. 2017. “Multiscale Geographically Weighted Regression (MGWR).” Annals of the American Association of Geographers 107 (6): 1247–1265. doi:10.1080/24694452.2017.1352480.
- FracFocus. 2021. “About FracFocus.” Fracfocus.Org. https://www.fracfocus.org/index.php?p=learn/about-fracfocus
- Gearhart, S., O. Adegbola, and J. Huemmer. 2019. “Where’s the Fracking Bias?: Contested Media Frames and News Reporting on Shale Gas in the United States.” Energy Research & Social Science 51: 168–175. doi:https://doi.org/10.1016/j.erss.2019.01.010.
- Gong, X., and K. M. D. Lane. 2020. “Institutional Twitter Usage Among U.S. Geography Departments.” Professional Geographer 72 (2): 219–237. doi:10.1080/00330124.2019.1653770.
- Gong, X., and Y. Wang. 2021. “Exploring Dynamics of Sports Fan Behavior Using Social Media Big Data - a Case Study of the 2019 National Basketball Association Finals.” Applied Geography 129: 102438. doi:10.1016/J.APGEOG.2021.102438.
- Gong, X., and X. Yang. 2020. ”Social Media Platforms.” In Geographic Information Science & Technology Body of Knowledge. Forthcoming. doi:10.22224/gistbok/2020.3.2.
- Gong, X., and X. Ye. 2021. “Governors Fighting Crisis: Responses to the COVID-19 Pandemic Across U.S. Dtates on Twitter.” Professional Geographer 1–19. doi:10.1080/00330124.2021.1895850.
- Gregory, K. B., R. D. Vidic, and D. A. Dzombak. 2011. “Water Management Challenges Associated with the Production of Shale Gas by Hydraulic Fracturing.” Elements 7 (3): 181–186. doi:10.2113/gselements.7.3.181.
- Howell, R. A. 2018. “UK Public Beliefs About Fracking and Effects of Knowledge on Beliefs and Support: A Problem for Shale Gas Policy.” Energy Policy 113: 721–730. doi:https://doi.org/10.1016/j.enpol.2017.11.061.
- Howell, E. L., N. Li, H. Akin, D. A. Scheufele, M. A. Xenos, and D. Brossard. 2017. “How Do U.S. State Residents Form Opinions About ‘Fracking’ in Social Contexts? A Multilevel Analysis.” Energy Policy 106: 345–355. doi:https://doi.org/10.1016/j.enpol.2017.04.003.
- Huberman, B., D. M. Romero, and F. Wu. 2008. “Social Networks That Matter: Twitter Under the Microscope.” First Monday 14 (1): 1–9. doi:10.5210/fm.v14i1.2317.
- Jacquet, J. B. 2012. “Landowner Attitudes Toward Natural Gas and Wind Farm Development in Northern Pennsylvania.” Energy Policy 50: 677–688. doi:https://doi.org/10.1016/j.enpol.2012.08.011.
- Jaspal, R., B. Nerlich, and S. Lemańcyzk. 2014. “Fracking in the Polish Press: Geopolitics and National Identity.” Energy Policy 74: 253–261. doi:https://doi.org/10.1016/j.enpol.2014.09.007.
- Kaitlin, T., and M. R. Leary. 2014. “Belief Superiority in the Environmental Domain: Attitude Extremity and Reactions to Fracking.” Journal of Environmental Psychology 40: 76–85. doi:10.1016/j.jenvp.2014.05.005.
- Kaplan, A. M., and M. Haenlein. 2010. “Users of the World, Unite! The Challenges and Opportunities of Social Media.” Business Horizons 53 (1): 59–68. doi:10.1016/j.bushor.2009.09.003.
- Kietzmann, J. H., K. Hermkens, I. P. McCarthy, and B. S. Silvestre. 2011. “Social Media? Get Serious! Understanding the Functional Building Blocks of Social Media.” Business Horizons 54 (3): 241–251. doi:10.1016/j.bushor.2011.01.005.
- Kinnaman, T. C. 2011. “The Economic Impact of Shale Gas Extraction: A Review of Existing Studies.” Ecological Economics 70 (7): 1243–1249. doi:https://doi.org/10.1016/j.ecolecon.2011.02.005.
- Klass, A. 2015. “Fracking and the Public Trust Doctrine: A Response to Spence.” Texas Law Review 88 (3): 163–173.
- Kriesky, J., B. D. Goldstein, K. Zell, and S. Beach. 2013. “Differing Opinions About Natural Gas Drilling in Two Adjacent Counties with Different Levels of Drilling Activity.” Energy Policy 58: 228–236. doi:https://doi.org/10.1016/j.enpol.2013.03.005.
- Kwak, H., C. Lee, H. Park, and S. Moon 2010. “What is Twitter, a Social Network or a News Media?” In Proceedings of the 19th International Conference on World Wide Web, edited by, M. Rappa, P. Jones, J. Freire, and S. Chakrabarti , 591–600. ACM. doi:10.1145/1772690.1772751
- Lachapelle, E., S. Kiss, and É. Montpetit. 2018. “Public Perceptions of Hydraulic Fracturing (Fracking) in Canada: Economic Nationalism, Issue Familiarity, and Cultural Bias.” The Extractive Industries and Society 5 (4): 634–647. doi:https://doi.org/10.1016/j.exis.2018.07.003.
- Lee, M. H. W., and A. Clark. 2020. “Partisanship Does Not Tell the Full Story: The Complexities of Public Opinion and Fracking in the United States.” Energy Research & Social Science 70: 101686. doi:https://doi.org/10.1016/j.erss.2020.101686.
- Li, Z., and A. S. Fotheringham. 2020. “Computational Improvements to Multi-Scale Geographically Weighted Regression.” International Journal of Geographical Information Science 34 (7): 1378–1397. doi:10.1080/13658816.2020.1720692.
- Li, Z., A. S. Fotheringham, T. M. Oshan, and L. J. Wolf. 2020. “Measuring Bandwidth Uncertainty in Multiscale Geographically Weighted Regression Using Akaike Weights.” Annals of the American Association of Geographers 110 (5): 1500–1520. doi:10.1080/24694452.2019.1704680.
- Liu, R., X. Yao, C. Guo, and X. Wei. 2021. “Can We Forecast Presidential Election Using Twitter Data? An Integrative Modelling Approach.” Annals of GIS 27 (1): 43–56. doi:10.1080/19475683.2020.1829704.
- Majumdar, S. R. 2018. ”The Politics of Fracking: Regulatory Policy and Local Community Responses to Environmental Concerns.” In Taylor & Francis. 1st ed. doi:10.4324/9781315545059.
- Mehany, M. S. H. M., and A. Guggemos. 2015. “A Literature Survey of the Fracking Economic and Environmental Implications in the United States.” Procedia Engineering 118: 169–176. doi:10.1016/j.proeng.2015.08.415.
- Meng, Q., and S. Ashby. 2014. “Distance: A Critical Aspect for Environmental Impact Assessment of Hydraulic Fracking.” The Extractive Industries and Society 1 (2): 124–126. doi:https://doi.org/10.1016/j.exis.2014.07.004.
- MIT Election Data and Science Lab. 2017. “U.S. President 1976–2020.” Harvard Dataverse. https://doi.org/10.7910/DVN/42MVDX
- Oshan, T. M., Z. Li, W. Kang, L. J. Wolf, and A. Stewart Fotheringham. 2019. “MGWR: A Python Implementation of Multiscale Geographically Weighted Regression for Investigating Process Spatial Heterogeneity and Scale.” ISPRS International Journal of Geo-Information 8 (6). doi:10.3390/ijgi8060269.
- Pierce, J. J., H. Boudet, C. Zanocco, and M. Hillyard. 2018. “Analyzing the Factors That Influence U.S. Public Support for Exporting Natural Gas.” Energy Policy 120: 666–674. doi:https://doi.org/10.1016/j.enpol.2018.05.066.
- Ritchie, L. A., M. A. Long, M. Leon-Corwin, and D. A. Gill. 2021. “Citizen Perceptions of Fracking-Related Earthquakes: Exploring the Roles of Institutional Failures and Resource Loss in Oklahoma, United States.” Energy Research & Social Science 80: 102235. doi:10.1016/j.erss.2021.102235.
- Rizwan, M., W. Wan, and L. Gwiazdzinski. 2020. “Visualization, Spatiotemporal Patterns, and Directional Analysis of Urban Activities Using Geolocation Data Extracted from LBSN.” ISPRS International Journal of Geo-Information 9 (2). doi:10.3390/ijgi9020137.
- Schneider, C., S. Uhl, S. Ross, J. Banks, D. Mccabe, J. Graham, L. Authors, and F. Fleischman. 2017. “Fumes Across the Fence-Line: The Health Impacts of Air Pollution from oil & Gas Facilities on African American Communities.” www.naacp.org/climate-justice-resources/fumes-across-the-fence-linehttp://catf.us/resources/publications/files/FumesAcrossTheFenceLine.pdf
- Stedman, R. C., D. Evensen, S. O’Hara, and M. Humphrey. 2016. “Comparing the Relationship Between Knowledge and Support for Hydraulic Fracturing Between Residents of the United States and the United Kingdom.” Energy Research & Social Science 20: 142–148. doi:https://doi.org/10.1016/j.erss.2016.06.017.
- Truong, D., D. J. Davidson, and J. R. Parkins. 2019. “Context Matters: Fracking Attitudes, Knowledge and Trust in Three Communities in Alberta, Canada.” The Extractive Industries and Society 6 (4): 1325–1332. doi:https://doi.org/10.1016/j.exis.2019.09.004.
- U.S. Census Bereau. 2021. “U. S. Census Bereau.” https://www.census.gov/
- Wakefield, J. 2020. “Pro-Fracking Movements have a Deadly Impact on BIPOC Communities.” PRISM. https://prismreports.org/2020/11/06/profracking-movements-have-a-deadly-impact-on-bipoc-communities/
- Walsh, P. J., S. Bird, and M. D. Heintzelman. 2015. “Understanding Local Regulation of Fracking: A Spatial Econometric Approach.” Agricultural and Resource Economics Review 44 (2): 138–163. doi:10.1017/S1068280500010261.
- Yan, H., L. Tian, R. Feng, H. Mitri, J. Chen, K. He, Y. Zhang, S. Yang, and Z. Xu. 2020. “Liquid Nitrogen Waterless Fracking for the Environmental Protection of Arid Areas During Unconventional Resource Extraction.” The Science of the Total Environment 721: 137719. doi:10.1016/j.scitotenv.2020.137719.
- Yu, C.-H., S.-K. Huang, P. Qin, and X. Chen. 2018. “Local Residents’ Risk Perceptions in Response to Shale Gas Exploitation: Evidence from China.” Energy Policy 113: 123–134. doi:https://doi.org/10.1016/j.enpol.2017.10.004.
- Zhang, G., and A. X. Zhu. 2018. “The Representativeness and Spatial Bias of Volunteered Geographic Information: A Review.” Annals of GIS 24 (3): 151–162. doi:10.1080/19475683.2018.1501607.
- Zirogiannis, N., J. Alcorn, J. Piepenburg, and J. Rupp. 2015. “I Want in on That: Community-Level Policies for Unconventional Gas Development in New York.” Agricultural and Resource Economics Review 44 (2): 164–194. doi:10.1017/S1068280500010273.