
 ?Mathematical formulae have been encoded as MathML and are displayed in this HTML version using MathJax in order to improve their display. Uncheck the box to turn MathJax off. This feature requires Javascript. Click on a formula to zoom.
ABSTRACT
Disaster resilience describes the ability of a community to bounce back from disaster impacts by resilience building activities. Social media provides an innovative way to observe human attitudes and responses, especially during disasters. However, most previous social media and disasters studies were conducted at a coarse spatial scale such as by county. This study analyzes Twitter activities during Hurricane Sandy in 2012, at the county and the zip code area levels in the five affected states. The study examines two questions: (1) will the relationships between disparities in social media use and disparities in disaster resilience found at the county level in previous studies still hold at the zip code area level? And (2) what new information or patterns can be revealed with the zip code area level analysis? Results show that correlations between Twitter use indices and social-environmental variables representing community resilience found at the county level in previous studies still hold, but they are weaker at the zip code area level. The study also shows that zip code areas that have major transportation hubs and commercial activities or low night-time population are major factors affecting Twitter use indices and hence the correlations. Future research should consider adding data on land use types and population dynamics to help improve social media use for disaster resilience analysis. Furthermore, employing a multiscale analysis approach can reduce uncertainties involved in analysis and obtain a more thorough understanding of the relationships between Twitter use and geographical and socioeconomic characteristics of the affected communities.
1. Introduction
Disaster resilience describes the ability of a community to bounce back from disaster impacts by resilience building activities. It has increasingly been used for providing support for decision-making during disasters (National Research Council Citation2012; National Academies of Sciences Citation2019). As a major societal challenge, disaster resilience has been studied by numerous researchers from many disciplines, all aiming at addressing the question: how to measure and enhance community resilience to disasters (Cutter, Burton, and Emrich Citation2010; Cai et al. Citation2016; Lam et al. Citation2016; Zou et al. Citation2018; Moreno, Lara, and Torres Citation2019; Mihunov et al. Citation2020).
Given the same type of disaster and threat level, the impact of a disaster on communities varies according to their social and geographical characteristics (Adger et al. Citation2005; Cutter, Burton, and Emrich Citation2010; Lam et al. Citation2015, Citation2016; Cai et al. Citation2016, Citation2018; Li et al. Citation2016; Cui and Li Citation2019; Mihunov and Lam, Citation2020). These social and geographical disparities in resilience capacity are the reason why it is difficult to build long-term resilience for many communities (Lam et al. Citation2015; Li et al. Citation2015Cai et al. Citation2018; Petkova et al. Citation2018; Zou et al. Citation2019). Thus, a better understanding of the factors affecting social-geographical disparities in disaster resilience is essential for reducing the disparities, which in turn will enhance the overall community resilience to disasters.
In the past two decades, the rapid development of social media draws researchers to study potential uses of social media data because of its advantage of providing information in real time. Social media provides an innovative way to observe human attitudes and responses, especially during disasters. Many studies of emergency management and resilience building after disasters have used social media data (Vongkusolkit and Huang Citation2021), including studies of Hurricane Sandy in 2012 (Wang et al. Citation2019; Zou et al. Citation2019), Hurricane Isaac in 2012 (Wang et al. Citation2021), Colorado’s flood in 2013 (Liu et al. Citation2019), California’s drought in 2014 (Tang et al. Citation2015), and Hurricane Harvey in 2017 (Zou et al. Citation2019; Mihunov et al. Citation2020). Their results indicate that social media data are of great help in detecting the status of affected regions, estimating damages, monitoring rescue requests, and improving emergency management. At the same time, these studies have documented clear social and geographical disparities in social media use, with the poor and the rural communities often left behind in their responses to disasters (Wang et al. Citation2021, Citation2019). The implications are that these vulnerable communities do not benefit from using social media as an information source or additional communication channel, potentially making it more difficult for them to recover from a disaster.
Moreover, we found that most previous social media and disasters studies were conducted at national or county-level scales (Jongman et al. Citation2015; Zou et al. Citation2018, Citation2019; Jiang, Li, and Ye Citation2019; Wang et al. Citation2019). Studies that are based on fine spatial scales such as zip code area level analysis are limited. A major shortcoming of coarse spatial-scale analysis is that results describing communities’ resilience characteristics could be too broad to pinpoint areas that need attention for resilience building. Zip code areas, or other types of small areal units, could reveal the social and geographical disparities more accurately, making resilience building effort more efficient and target oriented. For example, a county estimated to have high overall resilience may have very low resilience in one part of the county but very high resilience in another part. A zip code area level study is more likely to detect such variations within a county, which could lead to a better understanding of human responses during disasters. However, like many spatial studies that are influenced by the scale of analysis (Openshaw Citation1984; Lam and Quattrochi Citation1992; Bian and Walsh Citation1993; Lam Citation2012; 2019, Cheng and Adepeju Citation2014), there are challenges and uncertainties involved in studying social media use and disaster resilience at the zip code area level. Two fundamental questions arise: (1) will the relationships between disparities in social media use and disparities in disaster resilience found at the county level in previous studies still hold when the study is conducted at the zip code area level? And (2) what new information or patterns can be revealed using data at the zip code area level?
This paper addresses the above two questions by analysing the social and geographical disparities in Twitter use during Hurricane Sandy at two spatial scales – counties and zip code areas. Hurricane Sandy hit the Northeast US in October 2012, causing widespread damage to several states. Results from this study could provide useful baseline information on the issues and challenges of using social media in emergency management in an early stage of social media era. To address the first question, we pose two hypotheses: (1) Because of the averaging effect at the coarse spatial scale, we hypothesize that correlations between Twitter use indices and community resilience indicators found at the county level in previous studies are higher than the correlations found at the fine-scale (zip code area) level. (2) Similarly, we hypothesize that sentiment scores computed from the tweets, which could represent subjective well-being (Jaidka et al. Citation2020), will correlate positively with community resilience indicators at both scale levels, with the zip code area level analysis exhibiting weaker correlations. In other words, the two hypotheses stipulate that the more resilient a community is, the more Twitter activities and the more positive tweets it has. To address the second question, we will further examine the zip code area level data. We expect that the zip code area level analysis will uncover more details and variations of Twitter use than the county-level analysis, and new patterns could be revealed using data at the zip code area level.
2. Background
2.1 Social media and disaster resilience
Social media is developing rapidly and affecting every aspect of people’s lives. Numerous users can view, share, or exchange information through social media in any place at any time. The footprints left by people on social media can include their locations and timestamps, which make them act as intelligent sensors, collecting useful information about their environment (Earle et al. Citation2012; Mihunov et al. Citation2020; Wang et al. Citation2021; Wang et al. Citation2019; Zou et al. Citation2018; Zou et al. Citation2019). Hence, social media could be used for monitoring and understanding human behaviours and attitudes towards various topics during an event.
In recent years, due to its real-time nature and ease of access, studies of hazardous events, emergency management, and disaster resilience have increasingly utilized social media data. For example, by integrating with satellite images, Twitter data can be used to locate flooding events and identify their impacts quickly because both data sources are in near real time (Jongman et al. Citation2015). However, due to the inherent problems of social media data, such as false information, malicious use, lack of validation, and biased demographic composition of users, using social media data alone for disaster resilience analysis is questionable. Thus, combining with traditional data, such as geographical, socioeconomic, and remote sensing data, will make disaster analysis results more accurate (Madichetty and Muthukumarasamy Citation2020; Mihunov et al. Citation2020; Wang et al. Citation2021, Citation2019).
A critical issue central to the use of social media data in scientific analyses is the persistent social and geographical disparities in social media use and their impacts on disaster resilience. Mihunov et al. (Citation2020) conducted a survey of 195 Twitter users in Houston and surroundings during the 2017 Hurricane Harvey and found that over 80% Twitter users requesting for rescue were better educated, employed, and homeowners. In another study of Twitter use during Hurricane Harvey by Zou et al. (Citation2019), regression analyses between Twitter indices and social-geographical characteristics of 76 counties in Texas and Louisiana show that communities with higher disaster-related Twitter use were communities having better social and geographical conditions. Similarly, in studying Twitter use during Hurricane Sandy, which hit the northeastern US in October 2012, Wang et al. found that physically vulnerable communities had more intense social media use, whereas socially vulnerable communities ‘were digitally left behind’ (Wang et al. Citation2019). A comparative study of Twitter uses during Hurricane Isaac, which hit the southern US in the same year, was conducted. The study calculated the resilience capacity of 146 counties in Louisiana and Mississippi using the Resilience Inference Measurement (RIM) model and compared them with their corresponding Twitter indices. The study concluded that higher resilience-capacity communities tended to have higher Twitter use. Jiang, Li, and Ye (Citation2019) demonstrated further the demographic and socioeconomic biases of Twitter users by modelling the relationships between different demographic/socioeconomic factors and geotagged Twitter users for the entire contiguous US at the county level. They found that counties with more young people, higher education attainment, more urbanized areas, and better economic condition had more Twitter activities. These studies show that social media plays an important and unique role in disaster management, and its biased demographic use affects the resilience of communities. However, since these patterns are usually established using data at the county-level scale or coarser (Tang et al. Citation2015; Liu et al. Citation2019; Moreno, Lara, and Torres Citation2019; Wang et al. Citation2019; Zou et al. Citation2019), it is necessary to examine how studies utilizing social media data at a fine scale will improve our understanding of the relationship between social media use and disaster resilience.
2.2. Spatial scale and uncertainties
Spatial scale is one aspect of scale, which is central to the study of geography and geographic information science (Lam and Quattrochi Citation1992; Lam et al. Citation2004; Lam Citation2019). The other aspect is temporal scale. Numerous studies have attempted to define, explain, and clarify the term ‘scale’, but issues surrounding the concept of scale remain. One major problem is that many studies have found that answers to the same question vary when the analysis scale changes, creating uncertainties of the findings and ambiguities in decision-making based on the findings (Bian and Walsh Citation1993; Chen, Stow, and Gong Citation2004; Kwan Citation2012; Lam et al. Citation2018). Lam (Citation2012) discussed the uncertainty problem in health risk assessment studies, which are caused by the data scale, methods of analysis which is also dependent on the data scale, interpretation of the findings, and people’s reactions to the findings. Several methods relevant to health risk assessment were suggested to help mitigate the problem of scale and uncertainties, including the need to compare studies conducted at multiple scales, which could help in revealing the uncertainties involved in the analysis and providing a more thorough understanding of the research problem at hand.
Few studies in the disaster and resilience field have focused on the spatial scale issue. Battersby, Hodgson, and Wang (Citation2012) applied cognitive-science experimental methods to evaluate the performance of individuals’ interpretation of hurricane-related residential structural damage maps made using different spatial scales. They found that 1.5 m is the threshold for the coarsest resolution image interpretation. To assist disaster response and recovery, Kruse et al. (Citation2012) studied the effects of spatial resolution of the Airborne Visible/Infrared Imaging Spectrometer (AVIRIS) data on the mapping capability of surface materials such as buildings, roads, and other infrastructure. They also used WorldView-2 (WV-2) 8-band multispectral data with a similar spatial resolution to determine the effects of spectral resolution. They found that not only high spatial resolution decreases mapping error, but also spatial resolution is more critical than spectral resolution for urban mapping. These studies again indicate that conducting analyses at multiple scales could help reveal the uncertainties involved and provide a better understanding of the phenomenon at hand, which is the emphasis of this study.
3. Data and method
3.1. Hurricane sandy
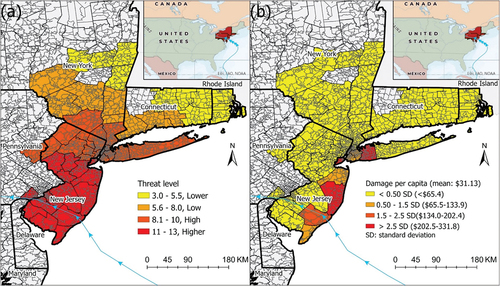
This study analyses the disaster-related Twitter use patterns during Hurricane Sandy by correlating their Twitter use indices with the community resilience indicators in the impacted areas in the states of New York, Connecticut, Pennsylvania, New Jersey, and Delaware at two spatial scales – county and zip code area scales. Hurricane Sandy was one of the most devastating natural disasters that hit the US since Hurricane Katrina in 2005 (Blake et al. Citation2013). It originated south of Jamaica and was named a tropical storm on 22 October 2012. Sandy made the landfall as a post-tropical cyclone near Brigantine, New Jersey, with 130 km/h maximum sustained winds on 29 October 2012. Then it moved north-west inland, through New Jersey, Delaware, and Pennsylvania, and dissipated over Ohio on 2 November 2012. According to the Tropical Cyclone Report from NOAA (Citation2012), Sandy drove a catastrophic storm surge into the northeastern US and caused $71.4 billion in economic damage. Due to the huge economic damage, the US Department of Homeland Security’s Federal Emergency Management Agency (FEMA) contributed more than $25.5 billion to the post-disaster recovery and reconstruction in New York and New Jersey (FEMA Citation2017). This study includes only those counties and their zip code areas that have damage statistics, and this leads to a study area of 53 counties and 1,350 zip code areas. Further, eight non-residential zip code areas had zero population, and they were removed, leaving 1,342 zip code areas for the study ().
Figure 1. (a) Hurricane threat level and (b) damage per 1000 people during Hurricane Sandy in the affected 53 counties and 1342 zip code areas in the north-eastern US.
3.2. Twitter data collection and index calculation
FEMA delineated emergency management into four phases – preparedness, response, recovery, and mitigation. The first three are short periods, whereas mitigation is a long period (FEMA Citation2006). Using this emergency management framework, we collected Twitter use data from 23 October 2012, when Hurricane Sandy was formed, to 12 November 2012, approximately 2 weeks when it dissipated, using two keywords, ‘Hurricane’ and ‘Sandy’. The three phases were defined as: preparedness (Oct 23–28, 2012), response (Oct 29–31, 2012), and recovery (Nov 1–12, 2012). This full Twitter dataset was purchased from Gnip Inc., a social media aggregation company affiliated with Twitter. The dataset has 16,319,060 records (tweets) in total in JavaScript Object Notation (JSON) format. Each tweet includes its time, content, user profile information, possible location information such as x-y coordinates, and place name. To avoid geocoding errors (Wang et al. Citation2021), we used the geotagged tweets only, which contain x-y coordinates. This leads to a dataset of 54,208 tweets for the county level (0.33% of the total) and 48,856 tweets (0.30% of the total) for the zip code area level for subsequent analysis. A Python script was created to parse, classify, and store the Twitter records into a Mongo database.
We computed two Twitter indices, including Tweet Ratio (TR) and Sentiment Score (SE), for each areal unit in each phase and for the whole period. TR is the average daily number of tweets per 10,000 population in a county or zip code area within a phase (EquationEquation 1(1)
(1) ).
Previous studies have shown that indices similar to TR are associated with socioeconomic and geographical conditions of communities (Zou et al. Citation2018, Citation2019), the level of Twitter activity (Jongman et al. Citation2015; Shan et al. Citation2019), and reflection of public awareness (Earle, Bowden, and Guy Citation2012; Almatar et al. Citation2020). SE is the average sentiment scores of geotagged tweets in an areal unit within a phase. Sentiment analysis of tweet content has been used to indicate real-time attitude from the public towards events (Hutto and Gilbert Citation2014; Pourebrahim et al. Citation2019; Zou et al. Citation2018, Citation2019). To verify the hypothesis that communities of higher resilience capacity generally have more positive Twitter response during disasters, we used VADER (Valence Aware Dictionary for sEntiment Reasoner), a commonly used lexicon and rule-based Python package, to assign a SE for each tweet (Hutto and Gilbert Citation2014). The score ranges from −1 (most negative) to 1 (most positive).
3.3. Geographical, damage, and socioeconomic data
In addition to the Twitter data, we collected hurricane damage data from FEMA, as well as disaster-related geographical and socioeconomic data from various sources (). Geographical data include four variables: distance to the hurricane track, distance to the landfall location, distance to the coastline, and the level of threat derived from hurricane’s windspeed. Hurricane track with wind speed data was accessed from the International Best Track Archive for Climate Stewardship project at the National Center for Atmospheric Research (NCAR) website (Schreck et al. Citation2021). The other three indicators were derived by the author(s). We used the kernel density method in ArcGIS to generate a threat density surface based on the hurricane track location and wind speed (Knapp et al. Citation2010), the method of which has been used successfully for hurricane intensity modelling (Knowles and Leitner Citation2007; Lam et al. Citation2014, Citation2015). The grid size used was 30 m × 30 m, and the bandwidth (search radius) of 390 km was defined based on the extent of Hurricane Sandy at its landfall (NOAA Citation2012). The hurricane threat level for each areal unit was then generated using the zonal statistics method ().
Table 1. Geographical, damage and socioeconomic variables.
Hurricane economic damage data was retrieved from OpenFEMA Data Sets at the FEMA website (FEMA Citation2021). We used the Housing Assistance Program Data – Owners and Renters, which is under the FEMA Individual Assistance (IA) programs. We added both owners and renters assistance amounts for each zip code area and also aggregated them into counties. The economic damage data reflect the level of damage in a community and could be used to verify the resilience capacity of the communities (Lam et al. Citation2016). After tabulation, we found 1,350 zip code areas in five states have economic damage data, and after removing eight zip code areas that had no population, we had 1,342 zip code areas included in our study. We then divided the damage per 1,000 people for all the areal units using the 2010 population figures ().
Ten socioeconomic indicators of 2010 from the US Census were selected and collected for each zip code area and county in the study (). These ten indicators were found to be representative for the resilience capacity of communities in previous disaster resilience studies (Cutter, Burton, and Emrich Citation2010; Cai et al. Citation2016; Lam et al. Citation2016). These predictors can be used to test if social and geographical disparities in Twitter use exist during disasters because they represent the socioeconomic condition of communities.
3.4. Analysis methods
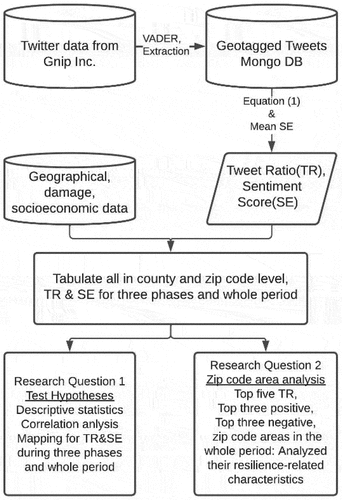
summarizes the workflow of the study. For the Twitter data obtained from Gnip Inc., we used VADER to compute the sentiment score of all tweets. Then, we extracted tweets with geotags. We used ArcGIS Pro to tabulate the geotagged tweets into counties and zip code areas. We calculated the Tweet Ratio for each areal unit using EquationEquation (1)(1)
(1) and computed their respective average sentiment scores. For the geographical variables (including threat level, distance to coast, distance to track and distance to landfall), we used ArcGIS Pro kernel density and distance proximity tools to create the surfaces and then tabulated the values according to respective areal units. To address the first research question and test the two hypotheses, we first compared the descriptive statistics including the coefficient of variation for all the variables at the two scales. Then, we compared the Pearson product-moment correlation coefficients between Twitter indices (TR and SE) and the geographical, damage, and socioeconomic variables. We mapped the TR and SE during the three phases and the whole period to provide further visual analysis. To address the second research question, we extracted zip code areas that had top five Tweet Ratios to show whether analysis of Twitter use at a fine scale can uncover new information that county-level analysis cannot. We also analysed zip code areas with top three positive or negative sentiment scores to provide further information.
Figure 2. Workflow of methodology.
4. Results
4.1. Spatial – temporal patterns of tweet ratio and sentiment score
shows the total number of tweets daily (including tweets without geotags), and shows the number of geotagged tweets in each of the three phases in the entire Twitter data set and in the study area, respectively. The total number of tweets in thousands per day was used to indicate the general trend of public awareness towards Hurricane Sandy on Twitter through the three phases. The total number of tweets ranged from 47,717 to 3,980,589 daily, with an average value of 728,265 during the whole period. The highest number was on 29 October 2012, right around the landfall of Hurricane Sandy. From Oct 23 to 28, 2012, prior to the landfall in the US, the level of Twitter activity was low, even after its huge impacts on the Caribbean region. During Oct 29–31, 2012, Hurricane Sandy made the landfall and headed inland, which generated extensive discussion on Twitter. In about 2 weeks, the intensity of discussion dissipated along with the Hurricane and returned to the same level as 23 October 2012. The temporal variation analysis shows that the number of tweets changed with the level of threat of Hurricane Sandy; the higher the threat, the more related tweets people send.
Figure 3. Daily numbers of total Hurricane Sandy tweet (including tweets without geotags, grey dash lines separate emergency response phases).
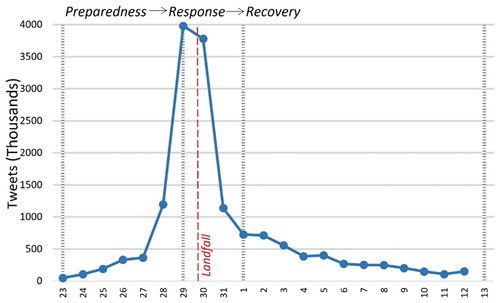
Table 2. Number of geotagged tweets and all tweets in each phase during Hurricane Sandy.
4.1.1. Spatial – temporal patterns of tweet ratio
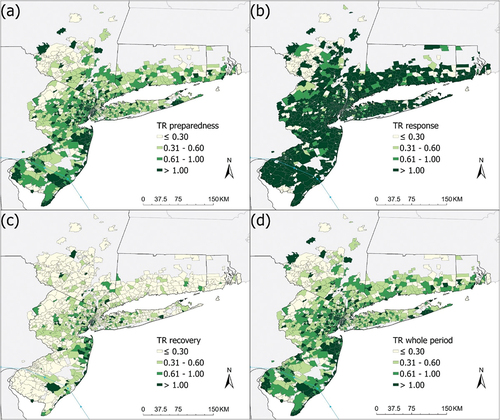
map the Tweet Ratio (TR) patterns of the three phases and the whole period at the county and the zip code area levels. In general, county-level maps show a more general spatial pattern and are easier to visualize the trend. Counties near the hurricane landfall in New Jersey had higher TR in the preparedness phase. In the response phase, TR reached its highest level for all counties, which is expected. Under the effect of the hurricane, people were asking for all kinds of information, such as infrastructure conditions, hurricane track and impacts, and so on. In the recovery phase, Twitter activity decreased sharply, with only a few counties having high TR, and they are located near the boundaries of New Jersey, New York, and Borough of Long Island. The overall TR trend of all phases at the zip code level is similar to that of the county level. However, the spatial patterns at the zip code level are much more fragmented and harder to generalize. This also means that by examining the spatial patterns at the zip code area level, we could potentially uncover new information that the county-level analysis could not offer.
Figure 4. Tweet Ratio (TR) mapped at the county level during (a) preparedness, (b) response, (c) recovery phases and (d) the whole period. For example, counties of >1.0 have at least 1 tweet per 10,000 people per day.
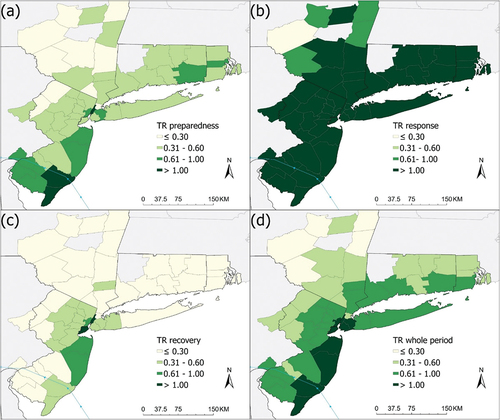
Figure 5. Tweet Ratio (TR) mapped at the zip code area level during (a) preparedness, (b) response, (c) recovery phases and (d) the whole period. For example, zip code areas of >1.0 have at least 1 tweet per 10,000 people per day.
4.1.2. Spatial – temporal patterns of sentiment score
The spatial patterns of Sentiment Score (SE) at the two scales are shown in . Some zip code areas had missing values due to their low tweet count. Also, individual tweets may have a very high negative or a very high positive score (−1.0 to 1.0), but when averaged into areal units, the ranges of SEs are much smaller because of the averaging effect. For example, SEs for the whole period at the county level ranged from −0.13 to 0.14, whereas at the zip code area level, −0.88 to 0.82, a much larger range (see below). In general, shows that more counties had positive sentiment during the preparedness and recovery phases than the response phase, presumably because people suffered more from power/water outage, traffic on the road, and building damage during the response phase. Like TR, SEs fluctuated spatially and had more extreme values at the zip code area level.
Figure 6. Average sentiment scores (SE) of tweets by county during (a) preparedness, (b) response, (c) recovery phases and (d) the whole period. Generally, scores below −0.1 indicate negative sentiment whereas scores above 0.1, positive sentiment. The interval −0.1 to 0.1 indicates mixed sentiment.
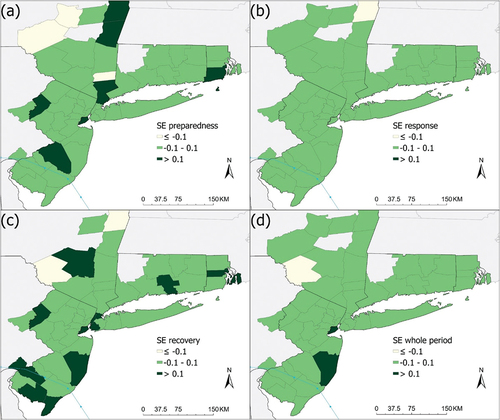
Figure 7. Average sentiment scores (SE) of tweets by zip code area during (a) preparedness, (b) response, (c) recovery phases and (d) the whole period. Generally, scores below −0.1 indicate negative sentiment whereas scores above 0.1, positive sentiment. The interval −0.1 to 0.1 indicates mixed sentiment.
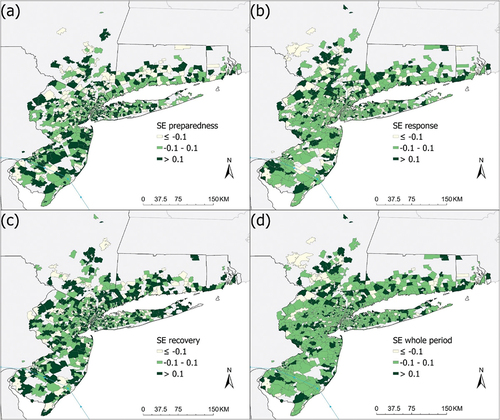
Table 3. The top five negative and positive Sandy-related tweets from all geotagged tweets.
Table 4. Descriptive statistics of Twitter indices and geographical, damage and socioeconomic variables at both county and zip code area levels.
We list the top five negative and positive sentiment tweets of all 158,345 geotagged tweets (). The most negative tweets used words such as ‘bad’, ‘hate’, ‘dumb’, ‘cursing’, and expletives replaced as ‘<EXPL>’, whereas tweets with words like ‘good’, ‘blessing’, ‘pray’, ‘safe’, ‘peace’, ‘happy’, ‘great’, ‘nice’, and no expletives will yield a high positive score. In general, negative tweets mentioned the damages, bad weather, power outage, and effects on personal health, whereas positive tweets discussed good wishes to the victims and relief after the hurricane, and they were most likely from non-affected users.
4.2. Descriptive statistics comparison
lists the descriptive statistics of all the variables at the county level and zip code area levels. By comparing the minimums, many more variables at the zip code area level had zero or smaller values than that of the county level. Similarly, the maximums of all variables at the zip code area level, except Distance to Coastline, were larger than the maximums at the county level. For example, the maximum county-level Tweet Ratio (TR) during the response phase was 15.53 tweets per 10,000 people per day, compared with a ratio of 543.48 at the zip code area level. From the coefficient of variation, which is a useful descriptive statistic to show the dispersion of the variable relative to its mean, we can observe that at the zip code area level all variables, except the four geographical variables, had higher variations than those at the county level. Moreover, the differences in the coefficients of variation between the two scales were far more extreme for the Twitter variables than for the Census variables, suggesting a more serious disparity and fluctuation in Twitter use among the zip code areas. For instance, the coefficient of variation for TR during the recovery phase at the zip code area level was 13.55, compared with a value of 1.07 at the county level. Thus, fine-grained spatial scale data show more extreme values and variations, which also implies that details are lost at coarse spatial scales due to averaging.
4.3. Correlation analyses comparison
Pearson product-moment correlation coefficients between Twitter indices (Tweet Ratio and Sentiment Score) and the geographical, damage, and socioeconomic variables were computed to test the first hypothesis. lists the correlations of both scales.
Table 5. Tweet indices correlations at county and zip code area levels.
4.3.1. Correlation between tweet ratio and resilience at county level
At the county level, all the geographical variables correlated with all four TRs significantly. The correlations between TRs and geographical variables at the county level were strongest in the preparedness phase, and then they declined slightly through the response phase but increased back in the recovery phase. The trend of changing correlations between TR and geographical variables reflects the changing roles of geographical variables in affecting Twitter use through the phases. In the preparedness phase, communities close to the landfall location and coastline were at high risk of impacts from the hurricane. Thus, people in these communities are expected to have more awareness of the disaster threat (Kent and Capello Citation2013; Zou et al. Citation2019). In the latter two phases, damages had been caused, the role of geographical variables in predicting Twitter activities started to weaken along with the dissipating hurricane.
Significant correlations between Tweet Ratio and Damage per Capita were found only in the preparedness and the recovery phases, suggesting that Twitter were used as a platform to communicate issues related to the damage before and after the storm but not during the storm. Surprisingly, only four socioeconomic predictors were found to correlate significantly with all four TRs, including a negative correlation with ‘% mobile home’; and positive correlations with ‘% housing units no telephone service available’, ‘% housing units with no vehicles available’, and ‘% housing units in urban area’. The variable ‘% population 17 to 29 years old’ also had positive but weaker correlations with TRs in the response phase and the whole period. These correlations suggest that counties with a higher percentage of mobile home generally had a lower Tweet Ratio, whereas counties that were more urbanized, had more young people, and fewer vehicle- or traditional telephone-dependent households tweeted more during Hurricane Sandy.
4.3.2. Correlation between tweet ratio and resilience at zip code area level
Unlike the results found at the county level, at the zip code area level there were no significant correlations between Tweet Ratio and all the geographical, and damage variables. An exception was a weak negative correlation (−0.08**) between TR_response and Dis_coastline. On the other hand, six socioeconomic variables were found to correlate significantly with all the TRs when the data was tabulated at the zip code area level. Of the six variables, four of them had the same correlation patterns as that of the county level, including positive correlations with ‘% housing units with no telephone service available’, ‘% housing units with no vehicles available’, and ‘% population 17 to 29 years old’, but a negative correlation with ‘% mobile home’. Intriguingly, the variable ‘% housing units in urban area’ was found to be positively correlated with all the TRs at the county level but the correlations were negative at the zip code area level. The other two significant correlations were: a positive correlation with ‘unemployment rate’ but a negative correlation with ‘% female-headed households’. In addition, weak but significant positive correlations were found with ‘median household income’ in the recovery phase. In summary, these results generally agree with the findings from the literature that urban, young, and higher-income people often tweet more (Jiang, Li, and Ye Citation2019; Kent and Capello Citation2013; Li, Goodchild, and Xu Citation2013; Sloan et al. Citation2015; Zou et al. Citation2018, Citation2019).
These correlation results suggest two points. First, the zip code area-level analysis reveals more significant predictors than the county-level analysis, implying that using fine spatial scale data could help uncover more detailed information. Second, the correlation coefficients yielded with the zip code area level data were lower than that of the county level, most likely due to the averaging effect at the coarse scale. Thus, our first hypothesis – correlations between Twitter Ratio and community resilience indicators found at the county level are higher than the correlations found at the fine-scale (zip code area) level – is confirmed.
4.3.3. Correlation between sentiment score and resilience at county level
Correlation analysis results of SE were more varied and mixed, though the results seem to indicate that communities with better socioeconomic conditions were associated with more positive sentiment. Better socioeconomic conditions are associated with better resilience capacity, and in this study, they generally mean lower ‘% female-headed households’, lower ‘unemployment rate’, lower ‘% families below poverty level’, higher ‘median household income’, higher ‘% people enrolled in college or graduate school’, and so on (Cai et al. Citation2018; Cutter, Burton, and Emrich Citation2010; Lam et al. Citation2016). However, there are special cases in areas like New York City. For example, public transportation is very convenient in the region, therefore communities with low ‘% housing units with no vehicles available’ does not necessarily imply a low socioeconomic condition of the communities.
At the county level, significant correlations were found between SE in the recovery phase and all geographical and damage variables, indicating that the closer the county to the landfall location or to the coast, as well as the higher the threat and the damage the county sustained, the more positive was the sentiment. These results seem to be counter intuitive. A possible explanation is that areas with high damage could lead to more encouraging messages, leading to more positive sentiment. For the socioeconomic variables, ‘% mobile home’ was negatively correlated with SE, whereas ‘% housing units in urban area’ was positively correlated for all phases. In addition, counties that had more people enrolled in college or graduate school had more positive sentiment, whereas counties that had higher unemployment rate had more negative sentiment.
4.3.4. Correlation between sentiment score and resilience at zip code area level
At the zip code area level, significant but weak correlations were found only between SE for the whole period and ‘damage per capita’ (0.086**), ‘unemployment rate’ (−0.113**), ‘% female-headed households’ (−0.086**), and ‘% housing units in urban area’ (−0.064*). Thus, the hypothesis – which states that sentiment scores computed from the tweets will correlate positively with the community resilience indicators at both scale levels, with the zip code area level analysis exhibiting weaker correlations – is confirmed. The weak correlations at the zip code area level could be due to a number of factors that were not considered and were less likely to be included at the county level, such as the land use (e.g. commercial vs. residential) characteristics of the zip code area, which is discussed in the next section.
4.4. Analysis of selected zip code areas
4.4.1. Zip code areas with top five tweet ratios
To address the second research question (that zip code area level analysis will reveal more details of Twitter use and new information could be obtained), we retrieved the top five zip code areas in terms of Tweet Ratio for the whole period and analysed their geographical and socioeconomic characteristics (). In addition, lists the characteristics of top three positive and top three negative zip code areas for comparison. Data on the racial majority and socioeconomic class were added to help with the interpretation (source: https://www.zipdatamaps.com/).
Table 6. Socioeconomic characteristics of zip code areas with top five Tweet Ratios and top three positive and negative sentiment scores.
Zip code 11,430, named Jamaica, NY, had the top Tweet Ratio of 443. It is where the John F Kennedy International Airport is located. It had only about 184 residents with a racial majority of black and has been classified as a Middle class. Understandably, locations such as airports would garner high Twitter activities than a typical residential area. This new information could not be observed if the analysis were conducted only at the county level. Similarly, zip code areas 10,119, 10,018, and 10,036 are all in Manhattan, NY. The areas include abundant commercial and tourist attractions: zip code 10,119 has Madison Square Garden, One Pennsylvania Plaza, and lots of companies; zip code 10,018 is Garment district and has Hyatt Place New York City/Times Square; and zip code 10,036 is adjacent to 10,018 and has part of Times Square and landmark skyscrapers (https://www.google.com/maps). The fifth one, zip code 11,360, called Bayside NY, is near LaGuardia Airport and consists of large residential area (e.g. Bay Terrace), shopping centres, golf course, and a hospital. All five zip code areas, except zip code 10,119 which has no classification, have been classified as Middle class. These zip code areas contain numerous tourist attraction sites, which have high day-time population and are likely to generate a lot of tweets. Also, according to the socioeconomic variables used in this study, these zip code areas had good resilience capacity. For example, zip code area 10,018 had low values in ‘unemployment rate’”,% female-headed households”, ‘mobile home’ (zero value), ‘% housing units with no telephone service available’, and ‘% families below poverty level’, but high values in ‘median household income’, ‘% population 17 to 29 years old’, ‘% people enrolled in college or graduate school’, and ‘% housing units in urban area’ (100%). All these variables suggest that 10018 had good resilience capacity.
4.4.2. Zip code areas with top three positive and negative sentiment scores
Regarding SE, all the zip code areas that had more than 10 tweets were included in the analysis. The top three positive sentiment zip code areas have been classified as Middle to Upper Middle classes, whereas the top three negative zip code areas are considered as Middle to Lower Middle classes (). An examination of their socioeconomic variables indicates that the three most positive sentiment zip code areas had better resilience capacity than the three with the most negative sentiment, which further supports our hypothesis that communities of better resilience capacity have more positive tweets.
We list in the top five SE tweets from each of the six zip code areas that had the most positive and the most negative sentiment to show that tweets retrieved from within a zip code area can reveal useful information on the response and recovery. In general, more extreme-value sentiment tweets were sent during the response and recovery phases. The content of positive tweets included sending good wishes, positive attitude for rebuilding, confidence in hurricane preparation, actions of organizational or personal facilities that help victims, appreciation of getting power and water back, and so on. The negative tweets mentioned dangerous flood condition, frustration with power outage, fatalities, property damage, school closures, and so on. The tweets aligned closely to the timeline of events unfolding during Hurricane Sandy. For example, in zip code area 11,697, a tweet was sent on Oct 28, ‘Sandy (and sandy) preparations in Breezy Point NY. That 5 foot berm looks like it would stop a hurricane right? <LINK>’, which was about the preparation for Hurricane Sandy. On November 2, a tweet was sent to request for help: ‘<USER> Please help us repair our homes in Breezy Point! We can’t do this alone! Spread the word & donate! TY! <LINK>’. On November 11, two tweets were sent: ‘Joy: it’s having faith that this will be a home again (day 112 11/5) #sandy @ Breezy Point Beach <LINK>’, and ‘EHS is in #NYC helping our #BREEZYPOINT friend recovering from #SANDY <LINK>’, which indicate that Breezy Point started rebuilding, and they were making good progress. These kinds of details would not be easily observed at the county level, and these information should help in future topic modelling or AI applications.
Table 7. Top five positive and negative tweets in top three positive and negative zip code areas.
5. Discussion
The two hypotheses were tested and confirmed in this study, and the second question has been addressed. However, as in many social media studies, there are limitations and interpretation of the results must be made with caution. We outline below some key points that could help in future research.
First, we excluded tweets without geotag (x-y coordinates) to avoid the problem of incorporating tweets with inaccurate locational information when they are derived from geocoding of the user’s profile. Since some users only provide broad locations for their addresses in their profiles like a county, a state, or even a country, the geocoding method will assign the tweets to the centre of the region, generating very inaccurate locational data and seriously affecting the analysis results (Wang et al. Citation2021). Moreover, there are biases with geotagged tweets (Jiang, Li, and Ye Citation2019; Malik et al. Citation2015; Tsou, Zhang, and Jung Citation2017). Improving the profile locational information to help increase the accuracy of geocoded tweets will make more data available for more reliable analyses.
Second, this study used only ‘Sandy’ and ‘Hurricane’ as keywords to extract related tweets, which were designed to cover a wide range of tweets. However, this method might cause an underestimated number of tweets during the recovery phase, leading to a lower Tweet Ratio. For example, people may use ‘power outage’ and/or ‘water outage’ to indicate their situations or to ask for help. The use of different keywords to retrieve Twitter data remains one of the key issues in Twitter use analysis because using different keywords may lead to different samples, making comparison across space and time more difficult. An alternative could be that similar keywords could be used in similar disaster events to enable comparability. Another alternative is to use locational boundaries to extract all tweets within the boundaries instead of using keywords. Furthermore, we note that using the keyword ‘Sandy’ might lead to tweets that refer to the name of a person but not Hurricane Sandy. However, since we retrieved the data with a limited time frame when Hurricane Sandy was active, this could limit the possibility of retrieving tweets on Sandy that are not related to Hurricane Sandy.
Third, while a fine-scale analysis would generate more targeted information to assist in emergency management, the quantitative modelling of fine-scale data often faces major obstacles. For example, Li (Citation2013) applied the Resilience Inference Measurement (RIM) model to calculate the resilience capacity in Louisiana at both the county and the zip code area levels. The study found that the accuracy of the model dropped 13.6% from the county level study to the zip code area level study, which could be because fine-scale study tends to have more missing values and variations in the dataset, making model building more challenging.
Fourth, although with the above-mentioned limitations, the zip code area level study has revealed Twitter use anomalies, such as zip code areas having very high Tweet Ratio were the ones that have commercial establishments, transportation hubs, and tourist attraction sites. These zip code areas often have high day-time population but low night-time population, the latter of which is what the Census data is based on. These land use and day-time population factors have seldom been considered in social media and disaster resilience analyses. Future research could include these data layers in the analysis to develop more accurate modelling tools for emergency management.
Fifth, to examine if the tweets might have been dominated by a few Twitter users, which is a common geotagged tweets bias (Malik et al. Citation2015; Tsou, Zhang, and Jung Citation2017; Jiang, Li, and Ye Citation2019), we calculated the mean and the median of user tweeting frequency during the whole period by zip code area, which were 2.33 and 2.11 tweets per user, respectively. The number of tweets of the top five accounts in the study area for the whole period were 177, 141, 123, 113, and 104. They were active users having different backgrounds, including a comedian, a lawyer, a local news media, an unknown, and a newspaper editor, respectively. We browsed through their tweets and confirmed that their tweets were of contents such as discussing the impacts of Sandy, calling for donations of disaster relief, and so on. In general, people send tweets more frequently during disasters (Niles et al. Citation2019). Developing a method to distinguishing the type of user accounts (such as organization, media, or individual) in the analysis will help increase the accuracy of the analysis results.
6. Conclusion
This study analysed Twitter activities in affected five states during Hurricane Sandy from Oct 23 to 12 November 2012, at both the county and the zip code area levels. Two hypotheses were tested and confirmed. The two hypotheses stipulate that the more resilient a community to natural hazards, the more Twitter activities and the more positive tweets it has, but the strength of correlations between Twitter Ratio and community resilience indicators is weaker at the zip code area level. Further analysis of the zip code area level data shows that zip code areas with high Tweet Ratio are generally major transportation hubs with high commercial and tourist activities but low night-time population. Future research should consider adding land use types and population dynamics in the study to help improve the analysis and modelling efforts.
Findings from this study have important implications. First, Twitter indices (Tweet Ratio and Sentiment Score) computed at the two scales in this study can provide baseline information for studies of other hurricanes. Second, a fine-grained study can help stakeholders in identifying problem areas and developing targeted strategies more efficiently. Some zip code areas within a county could have very high negative or positive sentiments but because of the averaging effect at coarse scales, they could not be detected, and thus ignored in emergency management. Third, this study only used geotagged tweets, which is a limitation. Future research should explore new algorithms such as deep-learning methods to extract more locational data to increase the accuracy of the analysis. Finally, this study shows that by conducting and comparing the results conducted at multiple scales, we can obtain a better understanding of the relationships between Twitter use and the geographical and socioeconomic conditions of the affected communities. Thus, whenever possible, a multiscale analysis should be undertaken to help reduce uncertainties and gain a more thorough understanding of the studied phenomenon.
Acknowledgements
We acknowledge Mongo database, Python, and its open-source packages for the creation of programming code for Twitter data processing. We also would like to thank all the anonymous reviewers for their comments and suggestions.
Disclosure statement
No potential conflict of interest was reported by the authors.
Data availability statement
Samples of the Twitter data during Hurricane Sandy can be accessed at the LSU Interdisciplinary Computation & Analysis of Resilience (ICAR) website: https://icar.lsu.edu/datasets/index.html.
Additional information
Funding
References
- Adger, W. N., T. P. Hughes, C. Folke, S. R. Carpenter, and J. Rockström. 2005. “Social-Ecological Resilience to Coastal Disasters.” Science 309 (5737): 1036–1039. doi:10.1126/science.1112122.
- Almatar, G. M., H. S. Alazmi, L. Li, and E. A. Fox. 2020. “Applying GIS and Text Mining Methods to Twitter Data to Explore the Spatiotemporal Patterns of Topics of Interest in Kuwait.” ISPRS International Journal of Geo-Information 9 (12): 702. doi:10.3390/ijgi9120702.
- Battersby, S. E., M. E. Hodgson, and J. Wang. 2012. “Spatial Resolution Imagery Requirements for Identifying Structure Damage in a Hurricane Disaster.” Photogrammetric Engineering & Remote Sensing 78 (6): 625–635. doi:10.14358/PERS.78.6.625.
- Bian, L., and S. J. Walsh. 1993. “Scale Dependencies of Vegetation and Topography in a Mountainous Environment of Montana.” The Professional Geographer 45 (1): 1–11. doi:10.1111/j.0033-0124.1993.00001.x.
- Blake, E. S., T. B. Kimberlain, R. J. Berg, J. P. Cangialosi, and J. L. Beven II. 2013. Tropical Cyclone Report: Hurricane Sandy (al182012). National Hurricane Center: National Oceanic and Atmospheric Administration, National Hurricane Center 22–29 October 2012 No. AL182012
- Cai, H., N. S. N. Lam, Y. Qiang, L. Zou, R. M. Correll, and V. Mihunov. 2018. “A Synthesis of Disaster Resilience Measurement Methods and Indices.” International Journal of Disaster Risk Reduction 31: 844–855. doi:10.1016/j.ijdrr.2018.07.015.
- Cai, H., N. S. N. Lam, L. Zou, Y. Qiang, and K. Li. 2016. “Assessing Community Resilience to Coastal Hazards in the Lower Mississippi River Basin.” Water 8 (2): 46. doi:10.3390/w8020046.
- Cheng, T., and M. Adepeju. 2014. “Modifiable Temporal Unit Problem (MTUP) and Its Effect on Space-Time Cluster Detection.” Plos One 9 (6): e100465. doi:10.1371/journal.pone.0100465.
- Chen, D., D. A. Stow, and P. Gong. 2004. “Examining the Effect of Spatial Resolution and Texture Window Size on Classification Accuracy: An Urban Environment Case.” International Journal of Remote Sensing 25 (11): 2177–2192. doi:10.1080/01431160310001618464.
- Cui, P., and D. Li. 2019. “Measuring the Disaster Resilience of an Urban Community Using ANP-FCE Method from the Perspective of Capitals.” Social Science Quarterly 100 (6): 2059–2077. doi:10.1111/ssqu.12699.
- Cutter, S. L., C. G. Burton, and C. T. Emrich. 2010. “Disaster Resilience Indicators for Benchmarking Baseline Conditions.” Journal of Homeland Security and Emergency Management 7 (1). doi:10.2202/1547-7355.1732.
- Earle, P. S., D. C. Bowden, and M. Guy. 2012. “Twitter Earthquake Detection: Earthquake Monitoring in a Social World.” Annals of Geophysics 54 (6). doi:10.4401/ag-5364.
- Federal Emergency Management Agency (FEMA). 2006. Principles of Emergency Management: Independent Study Manual [online]. Homeland Security Digital Library, Accessed 13 Feb 2021. https://www.hsdl.org/?abstract&did=
- Federal Emergency Management Agency (FEMA). 2017. Remembering Sandy Five Years Later, Accessed 5 May 2021. https://www.fema.gov/press-release/20210318/remembering-sandy-five-years-later
- Federal Emergency Management Agency (FEMA). 2021. “OpenFema Data Sets” Accessed 5 May 2021. https://www.fema.gov/about/openfema/data-sets
- Hutto, C., and E. Gilbert. 2014. “VADER: A Parsimonious Rule-Based Model for Sentiment Analysis of Social Media Text.” Proceedings of the International AAAI Conference on Web and Social Media, 8(1), 216-225.
- Jaidka, K., S. Giorgi, H. A. Schwartz, M. L. Kern, L. H. Ungar, and J. C. Eichstaedt. 2020. “Estimating Geographic Subjective Well-Being from Twitter: A Comparison of Dictionary and Data-Driven Language Methods.” Proceedings of the National Academy of Sciences 117 (19): 10165–10171. doi:10.1073/pnas.1906364117.
- Jiang, Y., Z. Li, and X. Ye. 2019. “Understanding Demographic and Socioeconomic Biases of Geotagged Twitter Users at the County Level.” Cartography and Geographic Information Science 46 (3): 228–242. doi:10.1080/15230406.2018.1434834.
- Jongman, B., J. Wagemaker, B. R. Romero, and E. C. De Perez. 2015. “Early Flood Detection for Rapid Humanitarian Response: Harnessing Near Real-Time Satellite and Twitter Signals.” ISPRS International Journal of Geo-Information 4 (4): 2246–2266. doi:10.3390/ijgi4042246.
- Kent, J. D., and H. T. Capello Jr. 2013. “Spatial Patterns and Demographic Indicators of Effective Social Media Content During the Horsethief Canyon Fire of 2012.” Cartography and Geographic Information Science 40 (2): 78–89. doi:10.1080/15230406.2013.776727.
- Knapp, K. R., M. C. Kruk, D. H. Levinson, H. J. Diamond, and C. J. Neumann. 2010. “The International Best Track Archive for Climate Stewardship (IBTrAcs): Unifying Tropical Cyclone Data.” Bulletin of the American Meteorological Society 91 (3): 363–376. doi:10.1175/2009BAMS2755.1.
- Knowles, J. T., and M. Leitner. 2007. “Visual Representations of the Spatial Relationship Between Bermuda High Strengths and Hurricane Tracks.” Cartographic Perspectives 56: 37–51. doi:10.14714/CP56.316.
- Kruse, F. A., C. C. Clasen, A. M. Kim, and S. C. Carlisle. 2012. “Effects of Spatial and Spectral Resolution on Remote Sensing for Disaster Response.” Presented at the 2012 IEEE International Geoscience and Remote Sensing Symposium, Munich, Germany, 7086–7089.
- Kwan, M. P. 2012. “The Uncertain Geographic Context Problem.” Annals of the Association of American Geographers 102 (5): 958–968. doi:10.1080/00045608.2012.687349.
- Lam, N. S. N. 2012. “Geospatial Methods for Reducing Uncertainties in Environmental Health Risk Assessment: Challenges and Opportunities.” Annals of the Association of American Geographers 102 (5): 942–950. doi:10.1080/00045608.2012.674900.
- Lam, N. 2019. “Resolution.” Geographic Information Science & Technology Body of Knowledge. https://gistbok.ucgis.org/bok-topics/resolution
- Lam, N. S. N., H. Arenas, P. L. Brito, and K. B. Liu. 2014. “Assessment of Vulnerability and Adaptive Capacity to Coastal Hazards in the Caribbean Region.” Journal of Coastal Research 70: 473–478. doi:10.2112/SI70-080.1.
- Lam, N. S. N., W. Cheng, L. Zou, and H. Cai. 2018. “Effects of Landscape Fragmentation on Land Loss.” Remote sensing of environment 209: 253–262. doi:10.1016/j.rse.2017.12.034.
- Lam, N. S. N., C. David, Q. Dale, B. Daniel, and M. Robert. 2004. “Scale.” In A Research Agenda for Geographic Information Science edited by Robert B. McMaster 7 E. Lynn Usery, 93–128. Boca Raton: CRC Press.
- Lam, N. S. N., Y. Qiang, H. Arenas, P. Brito, and K. Liu. 2015. “Mapping and Assessing Coastal Resilience in the Caribbean Region.” Cartography and Geographic Information Science 42 (4): 315–322. doi:10.1080/15230406.2015.1040999.
- Lam, N. S. N., and D. A. Quattrochi. 1992. “On the Issues of Scale, Resolution, and Fractal Analysis in the Mapping Sciences.” The Professional Geographer 44 (1): 88–98. doi:10.1111/j.0033-0124.1992.00088.x.
- Lam, N. S. N., M. Reams, K. Li, C. Li, and L. P. Mata. 2016. “Measuring Community Resilience to Coastal Hazards Along the Northern Gulf of Mexico.” Natural Hazards Review 17 (1): 04015013. doi:10.1061/(ASCE)NH.1527-6996.0000193.
- Li, C. 2013. “Community resilience to coastal hazards: an analysis of two geographical scales in Louisiana.” Master thesis, Louisiana State University.
- Li, L., M. F. Goodchild, and B. Xu. 2013. “Spatial, Temporal, and Socioeconomic Patterns in the Use of Twitter and Flickr.” Cartography and Geographic Information Science 40 (2): 61–77. doi:10.1080/15230406.2013.777139.
- Li, X., N. S. N. Lam, Y. Qiang, K. Li, L. Yin, S. Liu, and W. Zheng. 2016. “Measuring County Resilience After the 2008 Wenchuan Earthquake.” International Journal of Disaster Risk Science 7 (4): 393–412. doi:10.1007/s13753-016-0109-2.
- Li, K., N. S. N. Lam, Y. Qiang, L. Zou, and H. Cai. 2015. “A Cyberinfrastructure for Community Resilience Assessment and Visualization.” Cartography and Geographic Information Science 42 (sup1): 34–39. doi:10.1080/15230406.2015.1060113.
- Liu, X., B. Kar, C. Zhang, and D. M. Cochran. 2019. “Assessing Relevance of Tweets for Risk Communication.” International Journal of Digital Earth 12 (7): 781–801. doi:10.1080/17538947.2018.1480670.
- Madichetty, S., and S. Muthukumarasamy. 2020. “Classifying Informative and Non-Informative Tweets from the Twitter by Adapting Image Features During Disaster.” Multimedia Tools and Applications 79 (39–40): 28901–28923. doi:10.1007/s11042-020-09343-1.
- Malik, M., H. Lamba, C. Nakos, and J. Pfeffer. 2015. “Population Bias in Geotagged Tweets.” Proceedings of the International AAAI Conference on Web and Social Media 9 (4): 18–27. doi:10.1609/icwsm.v9i4.14688.
- Mihunov, V. V., and N. S. N. Lam. 2020. “Modeling the Dynamics of Drought Resilience in South-Central United States Using a Bayesian Network.” Applied Geography 120: 102224. doi:10.1016/j.apgeog.2020.102224.
- Mihunov, V. V., N. S. N. Lam, L. Zou, Z. Wang, and K. Wang. 2020. “Use of Twitter in Disaster Rescue: Lessons Learned from Hurricane Harvey.” International Journal of Digital Earth 13 (12): 1454–1466. doi:10.1080/17538947.2020.1729879.
- Moreno, J., A. Lara, and M. Torres. 2019. “Community Resilience in Response to the 2010 Tsunami in Chile: The Survival of a Small-Scale Fishing Community.” International Journal of Disaster Risk Reduction 33: 376–384. doi:10.1016/j.ijdrr.2018.10.024.
- National Academies of Sciences, Engineering, and Medicine. 2019. Building and Measuring Community Resilience: Actions for Communities and the Gulf Research Program. Washington, DC: The National Academies Press. doi:10.17226/25383.
- National Oceanic and Atmospheric Administration (NOAA). 2012. “Hurricane SANDY” National Hurricane Center, NOAA. Accessed September 22, 2017. http://www.nhc.noaa.gov/archive/2012/al18/al182012.public.029.shtml?
- National Research Council. 2012. Disaster Resilience: A National Imperative. Washington, DC: The National Academies Press. doi:10.17226/13457.
- Niles, M. T., B. F. Emery, A. J. Reagan, P. S. Dodds, and C. M. Danforth. 2019. “Social Media Usage Patterns During Natural Hazards.” Plos One 14 (2): e0210484. doi:10.1371/journal.pone.0210484.
- Openshaw, S. 1984. “Ecological Fallacies and the Analysis of Areal Census Data.” Environment and Planning A: Economy and Space 16 (1): 17–31. doi:10.1068/a160017.
- Petkova, E. P., J. Beedasy, E. J. Oh, J. J. Sury, E. M. Sehnert, W. -Y. Tsai, and M. J. Reilly. 2018. “Long-Term Recovery from Hurricane Sandy: Evidence from a Survey in New York City.” Disaster Medicine and Public Health Preparedness 12 (2): 172–175. doi:10.1017/dmp.2017.57.
- Pourebrahim, N., S. Sultana, J. Edwards, A. Gochanour, and S. Mohanty. 2019. “Understanding Communication Dynamics on Twitter During Natural Disasters: A Case Study of Hurricane Sandy.” International Journal of Disaster Risk Reduction 37: 101176. doi:10.1016/j.ijdrr.2019.101176.
- Schreck, C., and National Center for Atmospheric Research Staff (Eds). “Last Modified 06 Nov 2013. “The Climate Data Guide: IBTrAcs: Tropical Cyclone Best Track Data” Accessed 1 April 2021. https://climatedataguide.ucar.edu/climate-data/ibtracs-tropical-cyclone-best-track-data
- Shan, S., F. Zhao, Y. Wei, and M. Liu. 2019. “Disaster Management 2.0: A Real-Time Disaster Damage Assessment Model Based on Mobile Social Media Data—a Case Study of Weibo (Chinese Twitter).” Safety Science 115: 393–413. doi:10.1016/j.ssci.2019.02.029.
- Sloan, L., J. Morgan, P. Burnap, and M. Williams. 2015. “Who Tweets? Deriving the Demographic Characteristics of Age, Occupation and Social Class from Twitter User Meta-Data.” Plos One 10 (3): e0115545. doi:10.1371/journal.pone.0115545.
- Tang, Z., L. Zhang, F. Xu, and H. Vo. 2015. “Examining the Role of Social Media in California’s Drought Risk Management in 2014.” Natural Hazards 79 (1): 171–193. doi:10.1007/s11069-015-1835-2.
- Tsou, M. H., H. Zhang, and C. T. Jung, 2017. Identifying Data Noises, User Biases, and System Errors in Geo-Tagged Twitter Messages ( Tweets). arXiv:1712.02433.
- Vongkusolkit, J., and Q. Huang. 2021. “Situational Awareness Extraction: A Comprehensive Review of Social Media Data Classification During Natural Hazards.” Annals of GIS 27 (1): 5–28. doi:10.1080/19475683.2020.1817146.
- Wang, Z., N. S. N. Lam, N. Obradovich, and X. Ye. 2019. “Are Vulnerable Communities Digitally Left Behind in Social Responses to Natural Disasters? Evidence from Hurricane Sandy with Twitter Data.” Applied Geography 108: 1–8. doi:10.1016/j.apgeog.2019.05.001.
- Wang, K., N. S. N. Lam, L. Zou, and V. Mihunov. 2021. “Twitter Use in Hurricane Isaac and Its Implications for Disaster Resilience.” ISPRS International Journal of Geo-Information 10 (3): 116. doi:10.3390/ijgi10030116.
- Zou, L., N. S. N. Lam, H. Cai, and Y. Qiang. 2018. “Mining Twitter Data for Improved Understanding of Disaster Resilience.” Annals of the American Association of Geographers 0 (0): 1–20.
- Zou, L., N. S. N. Lam, S. Shams, H. Cai, M. A. Meyer, S. Yang, K. Lee, S. J. Park, and M. A. Reams. 2019. “Social and Geographical Disparities in Twitter Use During Hurricane Harvey.” International Journal of Digital Earth 12 (11): 1300–1318. doi:10.1080/17538947.2018.1545878.