
 ?Mathematical formulae have been encoded as MathML and are displayed in this HTML version using MathJax in order to improve their display. Uncheck the box to turn MathJax off. This feature requires Javascript. Click on a formula to zoom.
ABSTRACT
Hospital bypass behaviours (i.e. people go to faraway hospitals instead of close ones) of Emergency General Surgery (EGS) patients may cause treatment delays and worsened health outcomes. This study aimed to find the associations between EGS bypass behaviours and spatial access to EGS services as well as other factors at the individual level and ZIP Code Tabulation Area (ZCTA) level in California. We used a gravity model to calculate spatial access to EGS services at the ZCTA level. A Bayesian hierarchical spatial model was used to access associated variables of EGS bypass while accounting for spatial autocorrelation. Results show that better spatial access to EGS hospitals was associated with lower likelihood of EGS bypass. Other factors such as rural–urban status, health insurance type and race/ethnicity were also related to EGS bypass behaviours. Besides, people with similar EGS bypass behaviours seemed to cluster together due to spatial effect. Our results have important implications for EGS resource allocation, utilization and EGS disparity alleviation.
1. Introduction
Emergency General Surgery (EGS) represents a heterogeneous group of surgical conditions that require ‘emergent surgical evaluation (operative or non-operative) for diseases within the realm of general surgery as defined by the American Board of Surgery’ (Shafi et al. Citation2013). This includes conditions such as appendicitis, diverticulitis and bowel obstruction. There are nearly 3 million patients in the United States admitted with an EGS condition annually, exceeding other public health problems, such as newly diagnosed cancers or new onset diabetes (Becher et al. Citation2018). Moreover, EGS represents a high-risk patient population with up to eight times higher mortality compared to patients who undergo similar elective operations (Scott et al. Citation2018). The high burden of disease and mortality rate suggests an urgent need for improving EGS health care services.
Many severe EGS conditions are time-sensitive and cause severe infection or haemorrhage. Delayed treatment of EGS conditions could worsen outcomes (Buck et al. Citation2013) or even result in unexpected deaths (Derlet and Richards Citation2002). While presenting to the nearest hospital might ensure severely ill patients receive surgical evaluation and resuscitation as soon as possible, many patients choose to go to more distant hospitals. Prior investigations of hospital bypass have shown a relationship between bypass and increased mortality with sepsis (Mohr et al. Citation2017) but bypass behaviour has not yet been evaluated for surgical diseases.
Furthermore, the relationship between access to medical services and bypass for emergent surgical disease remains unclear. Access to medical services is defined as the ease of obtaining healthcare services that can bring about the best possible health outcome (National Academies of Sciences Citation2018) and can be classified into spatial and non-spatial access based on how the accessibility is influenced by spatial factors (e.g. spatial location) or non-spatial factors (e.g. socioeconomic status) (Aday and Andersen Citation1974). Ensuring adequate spatial access to EGS services is crucial for EGS patients since they need immediate treatment. Although some studies on bypass behaviours used the number of specialists (Ona et al. Citation2016) or travel time (Kahabuka et al. Citation2011) to represent patients’ spatial access to hospital, these measures were inadequate in capturing all the critical aspects of spatial access.
In this paper, we sought to evaluate the associations between EGS bypass behaviours and patient level and Zip code tabulation area (ZCTA) level factors, with a special focus on the effect of spatial access to EGS services. We also explored the presence of spatial effects due to neighbouring relationships between each pair of ZCTAs for EGS bypass behaviours. Our study area is California, which represents a geographically large state with diverse population.
2. Methodology
2.1 Data
Multiple data sources were used for this study, including the American Hospital Association (AHA) 2015 Annual Survey Database, the California Office of Statewide Health Planning and Development (OSHPD) Inpatient Discharge Data (PDD) between 2014 and October 2015, American Community Survey (ACS) 2013–2017 five-year average dataset, and geospatial data for the state of California. The AHA database was used to identify EGS hospitals and their characteristics such as geographic location and surgical capacity. In order to identify EGS hospitals, we first selected all non-federal general hospitals with at least 10 inpatient surgeries per year (n = 308), then excluded limited service hospitals (n = 7) and those without an emergency department or general surgery service (n = 18) (McCrum et al. Citation2020; Wan et al. Citation2021). The process identified a total of 283 EGS hospitals in California. We geocoded these hospitals based on their latitude and longitude coordinates. Surgery capacity of each hospital was represented by the 2015 inpatient surgical volume of each institution. We conducted sensitivity analyses by using two other criteria of EGS hospitals (i.e. inpatient surgical volume > = 275 which is the first quartile of inpatient operations nationally; and hospitals with advanced clinical resources including ICU beds, advanced gastroenterology services and advanced imaging capabilities). The results are similar among all three criteria. The results of the other two models are in the supplemental document.
The California Inpatient Discharge Data contains all administrative claims data of all inpatient hospitalizations. We identified all adult patients with a non-elective admission for a primary diagnosis of one of nine common EGS conditions, with severity grading scales defined by the American Association for the Surgery of Trauma (AAST): appendicitis, cholecystitis, diverticulitis, abdominal hernia, acute pancreatitis, intestinal obstruction, gastroduodenal ulcer disease with perforation or haemorrhage, soft tissue infection and mesenteric ischaemia (Ogola, Haider, and Shafi Citation2017; Utter et al. Citation2015). In 2014, the American Association for the Surgery of Trauma (AAST) published an anatomic grading scale for common EGS diseases based on clinical assessment, imaging, operative findings and pathologic criteria (Shafi et al. Citation2013; Tominaga et al. Citation2016). Utter et al. (Utter et al. Citation2015) subsequently demonstrated the feasibility of mapping these anatomic grading scales to ICD-9-CM and ICD-10-CM diagnosis codes using both primary and secondary codes, which are commonly used to identify EGS patient populations using administrative claims databases. Scott et al. (Scott et al. Citation2020) then dichotomized the resulting categories into ‘more complex’ vs ‘less complex’ disease, which were associated with in-hospital mortality, complications and length of stay (2021). The codes we used to identify complex vs non-complex disease are those published by Scott et al. We also conducted a sensitivity analysis using only patients with complex conditions. The results are similar to the original model and can be found in the supplemental document. To minimize the influence of multiple visits to a specific hospital by the same patient, we excluded records for which the patient ID and hospital ID were the same to a previous record. Race/ethnicity were categorized as non-Hispanic White, non-Hispanic Black, Hispanic, Asian, Native American/American Indian, and ‘other’ using standardized OSHPD coding. Other patient characteristics obtained from the inpatient discharge dataset included age, sex, primary expected payer (Medicare, Medi-Cal/Medicaid, private insurance, self-pay, and ‘other’) and home zip code. Patient zip code was linked with ACS data to obtain ZCTA level socio-demographic variables. Poverty rate was used to represent the socioeconomic status of ZCTAs. Rural/urban status of ZCTAs were defined following the instruction of the Federal Office of Rural Health Policy (Citation2021).
We removed records for which the patient ZCTA could not be located in the ZCTA dataset (n = 97) and whose site of admission was not directly from home (n = 22,767). All transfers were excluded because ZCTA level variables were calculated according to patients’ residence ZCTAs. After these exclusions, a total number of 440,522 records were left for subsequent analyses.
2.2 Measures
Travel Time Calculation. Shortest travel time between a patient’s ZCTA and an EGS hospital was calculated using the Network Analyst in ArcMap based on street network data and speed limit information. For each patient, we calculated travel times to the nearest EGS hospital and to the admitting EGS hospital. The origin was set to the population-weighted centroid of the residence ZCTA based on census block-level population, a practice that has been adopted by previous studies (Mohr et al. Citation2017; Wan et al. Citation2012, Citation2013). The destination was the precise geographic location of the EGS hospital.
Bypass Definition. We defined a hospital visit as bypass if the travel time to the admitting hospital is at least 15 min longer than the travel time to the closest hospital. We used this marginal time difference instead of a strict bypass criterion (e.g. the patient skipped the nearest hospital) because a marginal difference can offset inaccuracies brought about by using ZCTA centroids to approximate patient home locations. 15 minutes is about the average half of the time travelling through a zip code in California. We conducted sensitivity analyses by using 20 min and 25 min separately. The results were similar to the original model and could be found in the supplemental document.
Spatial Access Calculation. We used an enhanced 2-step floating catchment area (E2SFCA) method (Luo and Qi Citation2009), a widely used spatial access model, to measure spatial access to EGS hospitals for each ZCTA. E2SFCA calculates spatial access by accounting for hospital capacity, population demand, and travel cost between population site and hospitals, therefore revealing more comprehensive information on the spatial access than travel time or physician-population ratios. E2SFCA works in two steps. In the first step, it generates a 60-min driving zone around each medical site j, divides the zone into four contiguous zones (e.g. 0–10 min, 10–20 min, 20–30 min, 30–60 min), searches all population sites (i.e. ZCTA centroids) within each zone, and calculates a supply–demand ratio for j by
where is the surgical capacity (i.e. the annual volume of inpatient surgical operations) of hospital j,
is the population size of the kth ZCTA within the catchment,
is the travel cost between j and k,
is the rth sub-zone, and
is a distance-based weight for
. We used the Gaussian function (i.e.
where d represents the travel time and
represents an impedance parameter) to calculate
.
The second step of E2SFCA generates a 60-min driving zone around each ZCTA centroid i, divides the zone into four contiguous zones (e.g. 0–10 min, 10–20 min, 20–30 min, 30–60 min), and calculates a weighted sum of the supply–demand ratios by
where is the spatial access index for population site i,
is the supply-to-demand ratio (calculated in step 1) of hospital k that falls inside the catchment, and
is the travel time between k and i.
is the same distance-based weight calculated in step 1. After calculating the spatial access index (i.e.
) for all ZCTAs, the spatial access index value was normalized by the average value of all ZCTAs to overcome uncertainties caused by model parameters. The normalized value, named spatial access ratio (SPAR), was used to represent each ZCTA’s spatial access to EGS hospitals. Simply put, SPAR can be interpreted as a weighted supply-to-demand ratio of EGS services for a local population. More details and justifications of the calculation process can be found in Wan et al. (Citation2012). SPAR has been used in various studies to measure spatial access to medical services (Donohoe et al. Citation2016, Citation2016; Lin et al. Citation2018; Wan et al. Citation2012, Citation2012, Citation2013; Wan, Zou, and Sternberg Citation2012), including EGS (McCrum et al. Citation2020; Wan et al. Citation2021).
Covariates. Covariates associated with bypass behaviour were identified based on findings of previous studies on similar topics (Kahabuka et al. Citation2011; Ona et al. Citation2016; Radcliff et al. Citation2003; Sanders et al. Citation2015). Specifically, we used age, race/ethnicity, sex, inpatient surgical volume of the admitting hospital, health insurance type, and disease complexity to capture individual characteristics. Complex diseases correspond to high-severity disease by AAST grading scale, or the presence of severe sepsis or septic shock (Scott et al. Citation2020). ZCTA level factors include SPAR, poverty rate, and rural/urban status.
2.3. Statistical analysis
Statistical analyses were composed of two parts: a descriptive analysis of the data and a regression analysis for assessing the association between multi-level factors and EGS bypass behaviours. In the descriptive analysis, continuous variables (i.e. age, admitting hospital inpatient surgical volume, SPAR, and poverty rate) were categorized into quartiles to calculate the number of bypass and total patients in each quartile but were kept the continuous form in the correlation significance test and subsequent regression analysis. Logistic regression was used to test the correlation between continuous variables and EGS bypass, while chi-square test was applied between categorical variables and EGS bypass.
Most of previous studies on health service bypass behaviours used logistic regression (Mohr et al. Citation2017; Ona et al. Citation2016; Sanders et al. Citation2015) to explore associations, but they failed to consider the hierarchical structure of the data (i.e. individuals nested within local areas). In our study, we first tested a random effect model with independent and identically distributed Gaussian random intercept but found a significant pattern of spatial autocorrelation among the values of the random intercept (i.e. Moran’s I being 0.09; p < 0.01; results available upon request). Therefore, we used the Besag, York and Mollié (BYM2) model (Simpson et al. Citation2017), a hierarchical spatial model to account for the spatial autocorrelation within the random intercept. Specifically, this model includes a structured area-specific random effect, which models spatial dependency between areas and an unstructured component, which accounts for the uncorrelated noise. The spatial random effect component has a conditional autoregressive (CAR) distribution, which is used to smooth out spatial variation by defining the neighbouring relationships of the data. The BYM2 model can be written as:
where is the log odds of bypass,
represents parameter matrix,
is the covariate matrix (e.g. SPAR, rural-urban status, race/ethnicity, etc.).
is the overall intercept (i.e. the mean odds of bypass for all individuals in all ZCTAs).
is the non-spatial component, while
is the spatial term.
) is the mixing parameter, which determines the proportion of marginal variance explained by the spatial and non-spatial component separately. An increased value of
will blend in more variability explained by the spatial component
. The precision parameter
controls the contribution of the weighted sum of
and
to the marginal variance. The prior for
is defined by the probability statement
, while the prior for
is defined as
. Following previous studies (Franco Villoria, Massimo, and Håvard Citation2018; Moraga Citation2019; Simpson et al. Citation2017; Teng et al. Citation2020), we used
as
and 0.01 as
for the precision parameter
, and used the default values of
and
for the mixing parameter
.
After running the BYM2 model (available from the R-INLA R package (Rue, Martino, and Chopin Citation2009)), we separated the spatial component from the non-spatial component and mapped them to find the spatial patterns of EGS bypass behaviours at the ZCTA level (Teng et al. Citation2020). Global Moran’s I was also tested for both the spatial and non-spatial components. Gabriel Graph was used to assign neighbouring relationships to each of the ZCTA.
3. Results
The results of the descriptive analysis are shown in . All patient and ZCTA level variables were highly correlated with EGS bypass except for sex. We noted that the bypass rate decreased drastically with the increase of SPAR. Patients with private insurance had the highest bypass rate among all insurance types. Non-Hispanic White individuals and Native Americans both had high bypass rates. Rural patients, which account for about 10% of EGS admissions, had more than twice the bypass rate of those from urban areas.
Table 1. Descriptive Analysis of Covariates of EGS bypass behaviours.
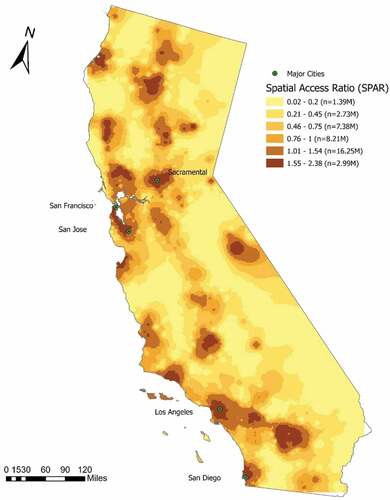
Spatial access in California measured by SPAR is shown in . Categories of SPAR values were classified according to Jenks natural breaks classification method. Greater values of SPAR indicate better spatial access to EGS hospitals. SPAR larger than 1 suggests higher-than-state-average spatial access and vice versa. SPAR less than 0.75 (the lowest three categories) were considered as low spatial access to EGS hospitals. There were 2.99 million (7.67%) of people in the category of the best spatial access (SPAR >1.54) to EGS hospitals among all the population. 11.5 million (29.5%) of people had low spatial access (SPAR <0.75), with 1.39 million (3.56%) in the lowest category. In general, metropolitan areas tended to have high spatial access to EGS hospitals. Areas along state highways had better spatial access to EGS hospitals. A distinct north–south pattern of high spatial access along the Interstate 5 can be seen from the map. Also, residents living in rural California had marked reductions with respect to spatial access to EGS hospitals.
Figure 1. Spatial Access Ratio (SPAR) to EGS services in California, 2014–2016 (Note: SPAR values were first calculated for CBG centroids and then interpolated to the entire state using an inverse distance weighting method; SPAR values were categorized using the Jenks natural breaks method with minor revisions, greater values of SPAR denote better spatial access).
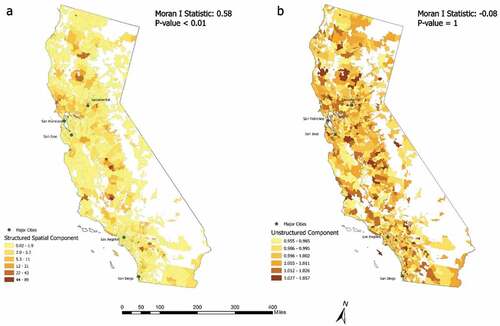
shows the exponential mean of the structured spatial component (i.e. spatial random effect) and unstructured component (i.e. non-spatial random effect) of the BYM2 model. The structured and unstructured component calculated the mean likelihood of bypass for ZCTAs under spatial and non-spatial effects separately. In both maps, ZCTAs with higher values (in darker colours) indicated that people from these areas were more likely to bypass than those from areas with lower values (in lighter colours). A clear spatial clustering can be identified from the distribution of the structured spatial component (Moran’s I: 0.58, p value <0.01). As can be seen from , holding all the individual and ZCTA level variables constant, ‘bypassers’ were more likely to reside in adjacent areas due to the spatial effect. A north–south pattern of ‘bypassers’ could be identified from the figure. Those ‘bypassers’ were mostly distributed along highly connected networks such as the state highways, had relatively low spatial access to EGS hospitals, but were closer to regions with high spatial access. For example, people from areas immediately outside of the metropolitan cities had dense road networks but relatively low spatial access to EGS hospitals compared to their neighbouring metropolitan areas. These people were more likely to bypass than those from inner metropolitan cities with advanced spatial access to EGS hospitals or rural areas, which were far away from major road networks. shows that no spatial autocorrelation (Moran’s I: −0.08, p value: 1) existed after accounting for spatial dependency by the structured spatial component.
Figure 2. Exponential mean of the structured spatial component (a: the likelihood of bypass due to spatial effect by neighboring relationships; larger values mean higher likelihood of bypass) and unstructured component (b: the likelihood of bypass due to non-spatial effect; larger values means higher probability of bypass) of the BYM2 model.
shows the results of the BYM2 model. Specifically, SPAR was an important factor to explain EGS bypass behaviours with an odds ratio of 0.52 (95% posterior interval: 0.47–0.56). The increase of SPAR was associated with decreased odds of bypass. Rural–urban status was also a critical indicator of EGS bypass (odds ratio: 2.18, 95% posterior interval: 1.75–2.72). Patients from rural areas were much more likely to bypass than their urban counterparts. The odds ratio for poverty rate was 0.97 with a 95% posterior interval of 0.91–1.02, suggesting that poverty rate did not have too much influence on EGS bypass after adjusting for spatial access and rural/urban status. For individual-level variables, the mean odds of bypass (i.e. overall intercept of the BYM2 model) for all individuals in all ZCTAs was 0.17. Females were less likely to bypass than males, and odds of bypass decreased with increasing age. In terms of health insurance type, Medi-Cal/Medicaid-covered patients had the lowest likelihood of bypass, while those enrolled in private insurance had the highest likelihood of bypass. Non-Hispanic Black individuals were more likely to bypass than non-Hispanic White individuals, while Hispanic patients and other minority groups were less likely to bypass than non-Hispanic White patients. Patients with complex diseases also had a higher odds of bypass than those with noncomplex diseases. Finally, patients were more likely to bypass to a hospital with larger inpatient surgical volume.
Table 2. Results of the BYM2 model.
4. Discussion
Emergency general surgery constitutes a group of surgical diseases that are time sensitive and require urgent surgical evaluation. Many are also resource-intensive, requiring emergent surgical intervention, intensive care admission or additional life-saving procedures. Optimal patient care therefore depends on reliable access to surgically capable hospitals. In this study, we examined the relationship between spatial access to EGS services and EGS bypass behaviours in California. We found that high spatial access, rural residence, private insurance and complex disease were associated with increased odds of bypass, while increasing age, Medicaid/public insurance and Hispanic ethnicity were all associated with decreased odds of bypass. Our findings suggest vulnerable patient populations, including minority groups and those who use public insurance depend on nearby hospitals for access to emergency surgical care. To our knowledge, this is the first study to analyse hospital bypass behaviours of EGS patients in the United States.
Over the past decade, there has been growing recognition of the need to develop high-quality systems for EGS care to ensure patients are treated at hospitals with appropriate resources while minimizing delays in care. Retrospective studies using claims data have shown that patients with high-risk EGS conditions whose predicted mortality is expected to exceed 4% experience lower odds of mortality at high-volume hospitals (Becher et al. Citation2020; Ogola et al. Citation2018; Ogola, Haider, and Shafi Citation2017). A simulation-based study of EGS regionalization (Becher et al. Citation2020), where patients at lower-volume, high-mortality hospitals were ‘re-routed’ to higher-volume, lower mortality hospitals show an approximately 10% mortality benefit. These studies speak to the importance of developing appropriate triage systems for patients diagnosed with EGS diseases to ensure treatment at appropriate, high-quality hospitals – similar to robust systems that have developed for traumatic injury, myocardial infarction and stroke. However, opportunities for pre-hospital triage in EGS patients are often limited, and patients present to emergency departments via personal transport and often with generalized symptoms such as ‘abdominal pain’ and without a clear diagnosis. Community and rural hospitals not only act as a point of diagnosis for EGS but also initial opportunity for intervention (e.g. volume resuscitation, initiation of antibiotics, etc.). Understanding patterns of hospital bypass is therefore critical to the design of more effective systems for the diagnosis, triage and treatment of EGS disease.
In this study, we used a gravity-based model to calculate spatial access to EGS hospitals since it incorporates hospital capacity, population demand and travel cost. For surgical specialities such as EGS which requires immediate treatment, operating rooms and ICU beds, considering accessibility only as travel time or number of physicians would be insufficient. A previous study has found that using travel time alone may underestimate socioeconomic disparities in spatial access to EGS and using SPAR could help address this problem (Wan et al. Citation2021). SPAR was used in other studies for the analysis of spatial access to primary care providers, colorectal cancer services, late-stage breast cancer healthcare services, etc. (Donohoe et al. Citation2016, Citation2016; Lin et al. Citation2018; Wan et al. Citation2012, Citation2012, Citation2013; Wan, Zou, and Sternberg Citation2012; Wang et al. Citation2008)
Our results found a significant association between spatial access and EGS bypass behaviours. With an odds ratio of 0.52 (much less than 1), spatial access is critical with respect to EGS bypass behaviours. Higher spatial access indicated better local EGS resources (e.g. larger EGS service capacities, better service qualities, etc.) and less time for travelling to EGS hospitals. Therefore, patients from areas with high SPAR values tended to choose the local hospitals. On the other hand, areas with low spatial access may have crowded EGS facilities or low service quality; therefore, patients from those areas were more likely to bypass. In a cohort study of severe sepsis patients in rural areas, Mohr et al. found rural ‘bypassers’, who generally experienced low spatial access to healthcare, had 5.6% higher risk of mortality than those who initially visited the local emergency department (Mohr et al. Citation2017). Another study found that nearly one-third of California residents have limited or poor access to EGS hospitals (McCrum et al. Citation2020). Further work could be done to determine the associations between spatial access to EGS services, EGS bypassing behaviours, and EGS outcomes among rural patients in California. Regardless, understanding current bypass patterns is needed to develop systems that better serve rural EGS patients.
We found that rural–urban status is a critical factor for EGS bypass behaviours. Rural patients were much more likely to bypass than their urban counterparts. Sufficient health care resources in rural areas could save lives, reduce excessive expenses, and bring better health outcomes. However, healthcare resources were not evenly distributed across regions, especially between rural and urban areas. According to the Rural Report of American Hospital Association (Association Citation2019), rural hospitals face challenges such as low patient volume, geographic isolation, workforce shortages, limited access to essential services, ageing infrastructure, etc. The high likelihood of bypass among rural patients might be largely due to these disadvantages of rural hospitals. Rural hospitals serve as economic anchors, providing both direct employment opportunities and indirect economic reinforcements. Nevertheless, rural hospital closures have increased significantly in recent years, leading to delayed health care service for rural patients (Wishner et al. Citation2016). Therefore, it is necessary to direct more and better quality of EGS services to rural residents.
The distribution of structural spatial component (i.e. ) showed that EGS bypass behaviours was indeed influenced by spatial effect due to the neighbouring relationships of the ZCTAs. The results of indicated that people who were more likely to bypass were clustered together and lived along highly connected networks, with relatively low SPAR values but were immediately outside of large metropolitan areas, which have high spatial access to EGS hospitals. This finding suggests that shifting EGS resources outwards metropolitan areas may help deliver care to the-most-likely ‘bypassers’ and alleviate pressure on the EGS services in metropolitan areas, therefore improving EGS outcomes. Holding all the variables (e.g. spatial access to EGS hospitals, insurance type, etc.) constant, this distribution of EGS bypass likelihood was purely due to spatial effect. Spatially adjacent areas tended to have similar culture, socioeconomic condition, geographic characteristics, etc. People living in adjacent areas thus might have similar habits for choosing hospitals and similar satisfaction level of local EGS services. Future studies should also consider the spatial effect in hospital bypass behaviours.
With regards to individual-level variables, our results indicated that patients with private insurance were the most likely to bypass, while Medi-Cal/Medicaid patients were the least likely to bypass, compared with other insurance types. According to Emergency Medical Treatment and Labor Act (Lipton, Hooper, and Bookman Citation2018), all hospitals in California that offer emergency care must treat and stabilize patients who present with an emergency regardless of their insurance status. While patients should not experience limitations on where they receive emergency care, they may make decisions based on where they perceive they will be better received, or where they have established care relationships in the past. The increased likelihood of bypass in patients with private insurance may reflect preference to receive care at hospitals in-network, potentially with lower co-payments. Medi-Cal/Medicaid patients might have experienced discrimination due to their insurance status for non-emergent care (Attanasio and Hardeman Citation2019; Wisniewski et al. Citation2021) and bypass closer hospitals in favour of those in-network for their type of insurance.
We also found Hispanic and other minority groups were less likely to bypass EGS services than non-Hispanic White patients, while non-Hispanic Black patients were more likely to bypass than their non-Hispanic White counterparts. Prior studies of colorectal cancer patients in California suggested both Black and Hispanic patients were more likely to bypass high-volume hospitals nearby than their White counterparts (Huang et al. Citation2015). Besides, high surgical volume has been shown to be closely associated with surgical quality (mortality) overall and in EGS (Birkmeyer et al. Citation2002; Ogola, Haider, and Shafi Citation2017). As a result, the estimates for admitting hospital inpatient surgical volume indicated that individuals were more likely to bypass for higher-volume and higher-quality hospitals.
A study of residents of Ontario who were older than 65 years of age showed that about 32% of the non-complicated EGS patients were brought to hospitals by an ambulance, while 53% of the complicated cases used the ambulance (McIsaac et al. Citation2017). The transportation pattern of EGS patients could be influenced by both self decision-making and the prehospital triage system. Although directing EGS patients, especially those with high-risk conditions, to high-volume hospitals would reduce mortality rate (Baimas-George et al. Citation2022; Becher et al. Citation2020; Ogola et al. Citation2018), in addition, Baimas-George et al. suggested that low-risk patients could also benefit from being directed to community hospitals (Baimas-George et al. Citation2022). In our sensitivity analysis, we found that patients with a complicated condition were more likely to bypass for a higher volume hospital than their non-complex counterparts. This requires a better triage system to meet the needs of the population. However, simply directing high-risk patients to a faraway higher-level hospital is not a ‘cure-all’ in EGS regionalization. Factors such as the increased travel costs for patients under emergent conditions, the willingness of patients for a longer travel time, and the overburden of the tertiary centres should all be considered (Beecher, O’Leary, and McLaughlin Citation2015; Fong et al. Citation2021).
Our study has several limitations. First, since we did not have detailed address information for each patient, we had to approximate their addresses by using ZCTA centroids and assume that all individuals within a ZCTA would have the same travel time to a hospital. This is a common practice when patient zip code is the only geographical identifier (Lin et al. Citation2018; McCrum et al. Citation2020; Wan et al. Citation2021). Although we used the marginal travel time of 15 min in bypass definition to offset this uncertainty, the results could still be slightly influenced. Secondly, like other spatial access measures, the calculation of SPAR did not differentiate between individuals with and without vehicles, or other transportation means such as public transit. It is not unusual for individuals living in metropolitan areas to rely on public transportation for accessing EGS services. In that case, their potential spatial access could be overestimated. Finally, this study does not investigate the effect of hospital bypass on patient outcomes, and further work will be needed to determine optimal triage studies for rural EGS patients.
5. Conclusions
In conclusion, we found that the increase of spatial access to EGS hospitals was related to reduced likelihood of bypass. We also found associations between EGS bypass behaviours and factors such as rural–urban status, health insurance type, race/ethnicity, and hospital quality. Besides, spatial effects existed in EGS hospital bypass behaviours with a clear clustering of ‘bypassers’. Our results have important implications for future EGS studies.
Supplemental Material
Download MS Word (38.8 KB)Disclosure statement
No potential conflict of interest was reported by the author(s).
Supplementary Material
Supplemental data for this article can be accessed online at https://doi.org/10.1080/19475683.2023.2165546.
Additional information
Funding
References
- Aday, L. A., and R. Andersen. 1974. “A Framework for the Study of Access to Medical Care.” Health Services Research 9 (3): 208.
- American Hospital Association. 2019. Challenges Facing Rural Communities and the Roadmap to Ensure Local Access to High-Quality, Affordable Care. Chicago (IL).
- Attanasio, L. B., and R. R. Hardeman. 2019. “Declined Care and Discrimination During the Childbirth Hospitalization.” Social Science & Medicine 232: 270–277. doi:10.1016/j.socscimed.2019.05.008.
- Baimas-George, M., L. Schiffern, H. Yang, L. Paton, S. Barbat, B. Matthews, and C. E. Reinke. 2022. “Emergency General Surgery Transfer to Lower Acuity Facility: The Role of Right-Sizing Care in Emergency General Surgery Regionalization.” The Journal of Trauma and Acute Care Surgery 92 (1): 38–43. doi:10.1097/TA.0000000000003435.
- Becher, R. D., K. A. Davis, M. F. Rotondo, and R. Coimbra. 2018. “Ongoing Evolution of Emergency General Surgery as a Surgical Subspecialty.” Journal of the American College of Surgeons 226 (2): 194–200. doi:10.1016/j.jamcollsurg.2017.10.014.
- Becher, R. D., M. P. DeWane, N. Sukumar, M. J. Stolar, T. M. Gill, A. A. Maung, K. M. Schuster, and K. A. Davis. 2020. “Hospital Volume and Operative Mortality for General Surgery Operations Performed Emergently in Adults.” Annals of Surgery 272 (2): 288. doi:10.1097/SLA.0000000000003232.
- Becher, R. D., N. Sukumar, M. P. DeWane, T. M. Gill, A. A. Maung, K. M. Schuster, M. J. Stolar, and K. A. Davis. 2020. “Regionalization of Emergency General Surgery Operations: A Simulation Study.” The Journal of Trauma and Acute Care Surgery 88 (3): 366. doi:10.1097/TA.0000000000002543.
- Beecher, S., D. O’Leary, and R. McLaughlin. 2015. “Increased Risk Environment for Emergency General Surgery in the Context of Regionalization and Specialization.” International Journal of Surgery 21: 112–114. doi:10.1016/j.ijsu.2015.06.070.
- Birkmeyer, J. D., A. E. Siewers, E. V. Finlayson, T. A. Stukel, F. L. Lucas, I. Batista, H. G. Welch, and D. E. Wennberg. 2002. “Hospital Volume and Surgical Mortality in the United States.” The New England Journal of Medicine 346 (15): 1128–1137. doi:10.1056/NEJMsa012337.
- Buck, D., M. Vester‐andersen, M. Møller, and D. C. R. O. E. Surgery. 2013. “Surgical Delay is a Critical Determinant of Survival in Perforated Peptic Ulcer.” The British Journal of Surgery 100 (8): 1045–1049. doi:10.1002/bjs.9175.
- Defining rural population. (2021). Retrieved from https://www.hrsa.gov/rural-health/about-us/definition/index.html
- Derlet, R. W., and J. R. Richards. 2002. “Emergency Department Overcrowding in Florida, New York, and Texas.” Southern Medical Journal 95 (8): 846–850. doi:10.1097/00007611-200295080-00013.
- Donohoe, J., V. Marshall, X. Tan, F. T. Camacho, R. Anderson, and R. Balkrishnan. 2016. “Evaluating and Comparing Methods for Measuring Spatial Access to Mammography Centers in Appalachia.” Health Services & Outcomes Research Methodology 16 (1–2): 22–40. doi:10.1007/s10742-016-0143-y.
- Donohoe, J., V. Marshall, X. Tan, F. T. Camacho, R. T. Anderson, and R. Balkrishnan. 2016. “Spatial Access to Primary Care Providers in Appalachia: Evaluating Current Methodology.” Journal of Primary Care & Community Health 7 (3): 149–158. doi:10.1177/2150131916632554.
- Fong, Z. V., D. A. Hashimoto, G. Jin, A. B. Haynes, N. Perez, M. Qadan, C. R. Ferrone, et al. 2021. “Simulated Volume-Based Regionalization of Complex Procedures: Impact on Spatial Access to Care.” Annals of Surgery 274 (2): 312. doi:10.1097/SLA.0000000000003574.
- Franco Villoria, M., V. Massimo, and R. Håvard. 2018. “Bayesian Varying Coefficient Models Using PC Priors.” Electronic Journal of Statistics 13 (2). doi:10.1214/19-EJS1653.
- Huang, L. C., T. B. Tran, Y. Ma, J. V. Ngo, and K. F. Rhoads. 2015. “What Factors Influence Minority Use of High Volume Hospitals for Colorectal Cancer Care.” Diseases of the Colon and Rectum 58 (5): 526. doi:10.1097/DCR.0000000000000353.
- Kahabuka, C., G. Kvåle, K. M. Moland, and S. G. Hinderaker. 2011. “Why Caretakers Bypass Primary Health Care Facilities for Child Care-A Case from Rural Tanzania.” BMC Health Services Research 11 (1): 1–10. doi:10.1186/1472-6963-11-315.
- Lin, Y., N. Wan, S. Sheets, X. Gong, and A. Davies. 2018. “A Multi-Modal Relative Spatial Access Assessment Approach to Measure Spatial Accessibility to Primary Care Providers.” International Journal of Health Geographics 17 (1): 1–22. doi:10.1186/s12942-018-0153-9.
- Lipton, M. S., L. Hooper, and P. Bookman (2018). EMTALA — A Guide to Patient Anti-Dumping Laws. https://www.calhospital.org/sites/main/files/file-attachments/emtala_2018_webpreview.pdf
- Luo, W., and Y. Qi. 2009. “An Enhanced Two-Step Floating Catchment Area (E2SFCA) Method for Measuring Spatial Accessibility to Primary Care Physicians.” Health & Place 15 (4): 1100–1107. doi:10.1016/j.healthplace.2009.06.002.
- McCrum, M. L., N. Wan, S. Lizotte, J. Han, T. Varghese, and R. Nirula. 2020. “Use of the Spatial Access Ratio to Measure Geospatial Access to Emergency Surgical Services in California.” medRxiv 90 (5): 853–860. doi:10.1097/TA.0000000000003087.
- McIsaac, D. I., H. Moloo, G. L. Bryson, and C. van Walraven. 2017. “The Association of Frailty with Outcomes and Resource Use After Emergency General Surgery: A Population-Based Cohort Study.” Anesthesia & Analgesia 124 (5): 1653–1661. doi:10.1213/ANE.0000000000001960.
- Mohr, N. M., K. K. Harland, D. M. Shane, A. Ahmed, B. M. Fuller, M. M. Ward, and J. C. Torner. 2017. “Rural Patients with Severe Sepsis or Septic Shock Who Bypass Rural Hospitals Have Increased Mortality: An Instrumental Variables Approach.” Critical care medicine 45 (1): 85. doi:10.1097/CCM.0000000000002026.
- Moraga, P. 2019. Geospatial Health Data: Modeling and Visualization with R-INLA and Shiny. Chapman and Hall/CRC.
- National Academies of Sciences, E., & Medicine. 2018. Health-Care Utilization as a Proxy in Disability Determination. Washington (DC): National Academies Press (US).
- Ogola, G. O., M. L. Crandall, K. M. Richter, and S. Shafi. 2018. “High-Volume Hospitals are Associated with Lower Mortality Among High-Risk Emergency General Surgery Patients.” The Journal of Trauma and Acute Care Surgery 85 (3): 560–565. doi:10.1097/TA.0000000000001985.
- Ogola, G. O., A. Haider, and S. Shafi. 2017. “Hospitals with Higher Volumes of Emergency General Surgery Patients Achieve Lower Mortality Rates: A Case for Establishing Designated Centers for Emergency General Surgery.” The Journal of Trauma and Acute Care Surgery 82 (3): 497–504. doi:10.1097/TA.0000000000001355.
- Ona, L., J. E. Allen IV, A. F. Davis, C. Director, and X. He. 2016. “Determinants of Bypass Behavior for Critical Access Hospitals (CAHs) in Rural Kentucky.“ CEDIK (Community & Economic Development Initiative of Kentucky).
- Radcliff, T. A., M. Brasure, I. S. Moscovice, and J. T. Stensland. 2003. “Understanding Rural Hospital Bypass Behavior.” The Journal of Rural Health 19 (3): 252–259. doi:10.1111/j.1748-0361.2003.tb00571.x.
- Rue, H., S. Martino, and N. Chopin. 2009. “Approximate Bayesian Inference for Latent Gaussian Models by Using Integrated Nested Laplace Approximations.” Journal of the Royal Statistical Society 71 (2): 319–392. doi:10.1111/j.1467-9868.2008.00700.x.
- Sanders, S. R., L. D. Erickson, V. R. Call, M. L. McKnight, and D. W. Hedges. 2015. “Rural Health Care Bypass Behavior: How Community and Spatial Characteristics Affect Primary Health Care Selection.” The Journal of Rural Health 31 (2): 146–156. doi:10.1111/jrh.12093.
- Scott, J. W., K. Staudenmayer, N. Sangji, Z. Fan, M. Hemmila, and G. Utter. 2020. “Evaluating the Association Between AAST Emergency General Surgery Anatomic Severity Grades and Clinical Outcomes Using National Claims Data.” The Journal of Trauma and Acute Care Surgery 90 (2): 296–304. doi:10.1097/TA.0000000000003030.
- Scott, J. W., T. C. Tsai, P. U. Neiman, G. J. Jurkovich, G. H. Utter, A. H. Haider, A. Salim, and J. M. Havens. 2018. “Lower Emergency General Surgery (EGS) Mortality Among Hospitals with Higher-Quality Trauma Care.” The Journal of Trauma and Acute Care Surgery 84 (3): 433–440. doi:10.1097/TA.0000000000001768.
- Shafi, S., M. B. Aboutanos, S. Agarwal Jr, C. V. Brown, M. Crandall, D. V. Feliciano, O. Guillamondegui, A. Haider, K. Inaba, and T. M. Osler. 2013. “Emergency General Surgery: Definition and Estimated Burden of Disease.” The Journal of Trauma and Acute Care Surgery 74 (4): 1092–1097. doi:10.1097/TA.0b013e31827e1bc7.
- Simpson, D., H. Rue, A. Riebler, T. G. Martins, and S. H. Sørbye. 2017. “Penalising Model Component Complexity: A Principled, Practical Approach to Constructing Priors.” Statistical Science 32 (1): 1–28. doi:10.1214/16-STS576.
- Teng, K.T. -Y., M. Martinez Aviles, M. Ugarte-Ruiz, C. Barcena, A. De La Torre, G. Lopez, M. A. Moreno, L. Dominguez, and J. Alvarez. 2020. “Spatial Trends in Salmonella Infection in Pigs in Spain.” Frontiers in Veterinary Science 7: 345. doi:10.3389/fvets.2020.00345.
- Tominaga, G. T., K. L. Staudenmayer, S. Shafi, K. M. Schuster, S. A. Savage, S. Ross, P. Muskat, et al. 2016. “The American Association for the Surgery of Trauma Grading Scale for 16 Emergency General Surgery Conditions: Disease-Specific Criteria Characterizing Anatomic Severity Grading.” The Journal of Trauma and Acute Care Surgery 81 (3): 593–602. doi:10.1097/TA.0000000000001127.
- Utter, G. H., P. R. Miller, N. T. Mowery, G. T. Tominaga, O. Gunter, T. M. Osler, D. J. Ciesla, et al. 2015. “ICD-9-CM and ICD-10-CM Mapping of the AAST Emergency General Surgery Disease Severity Grading Systems: Conceptual Approach, Limitations, and Recommendations for the Future.” The Journal of Trauma and Acute Care Surgery 78 (5): 1059–1065. doi:10.1097/TA.0000000000000608.
- Wang, F., S. McLafferty, V. Escamilla, and L. Luo. 2008. “Late-Stage Breast Cancer Diagnosis and Health Care Access in Illinois.” The Professional Geographer 60 (1): 54–69. doi:10.1080/00330120701724087.
- Wan, N., M. McCrum, J. Han, S. Lizotte, D. Su, M. Wen, and S. Zeng. 2021. “Measuring Spatial Access to Emergency General Surgery Services: Does the Method Matter?” Health Services & Outcomes Research Methodology 22 (1): 1–17. doi:10.1007/s10742-021-00254-8.
- Wan, N., F. B. Zhan, Y. Lu, and J. P. Tiefenbacher. 2012. “Access to Healthcare and Disparities in Colorectal Cancer Survival in Texas.” Health & Place 18 (2): 321–329. doi:10.1016/j.healthplace.2011.10.007.
- Wan, N., F. B. Zhan, B. Zou, and E. Chow. 2012. “A Relative Spatial Access Assessment Approach for Analyzing Potential Spatial Access to Colorectal Cancer Services in Texas.” Applied Geography 32 (2): 291–299. doi:10.1016/j.apgeog.2011.05.001.
- Wan, N., F. B. Zhan, B. Zou, and J. G. Wilson. 2013. “Spatial Access to Health Care Services and Disparities in Colorectal Cancer Stage at Diagnosis in Texas.” The Professional Geographer 65 (3): 527–541. doi:10.1080/00330124.2012.700502.
- Wan, N., B. Zou, and T. Sternberg. 2012. “A Three-Step Floating Catchment Area Method for Analyzing Spatial Access to Health Services.” International Journal of Geographical Information Science 26 (6): 1073–1089. doi:10.1080/13658816.2011.624987.
- Wishner, J., P. Solleveld, R. Rudowitz, J. Paradise, and L. Antonisse. 2016. “A Look at Rural Hospital Closures and Implications for Access to Care: Three Case Studies.” Kaiser Family Foundation. Internet.
- Wisniewski, J., B. Walker, S. Tinkler, M. Stano, and R. Sharma (2021). Mediators of Discrimination in Primary Care Appointment Access. Economics Letters, 109744.