
 ?Mathematical formulae have been encoded as MathML and are displayed in this HTML version using MathJax in order to improve their display. Uncheck the box to turn MathJax off. This feature requires Javascript. Click on a formula to zoom.
ABSTRACT
Transport data are important for understanding human mobility and urban interactions within a city. As China’s transportation infrastructure continues to grow, more research is needed to analyse the spatial patterns of travel flows and to understand how these patterns change over time. With the development of online car-hailing and ride sharing services, floating car data have become a new resource to facilitate the analysis of human mobility patterns and the interactions of urban mobility within a city. The detection of urban communities based on urban networks is a helpful way to represent urban interactions. However, understanding community changes using online car-hailing data remains an underexplored topic. To this end, this study applies a community detection method to explore community changes over time based on the newly available floating car data (DiDi Chuxing (‘DiDi’)) in Chengdu, China. We applied undirected graphs to examine the spatial distribution of DiDi usage and the spatial patterns of travel distance. In addition, we explored the spatial-temporal variations of the communities at the taxi zone level using Blondel’s iterative algorithm, a modularity optimization approach. Results suggest that: 1) taxi zones on the south and west sides of Chengdu have more average daily trips compared to those in other areas; 2) residential taxi zones in the northeast area have a long median travel distance, indicating people living in those areas travel longer distances; and 3) the detected community structures change at different times. These findings provide valuable information for urban planning and location-based services in Chengdu.
1. Introduction
Understanding human mobility and interactions between people in a city provides useful information for transportation planning (Tu et al. Citation2016), tourism management (Ahas et al. Citation2007), public health decision-making (Wesolowski et al. Citation2012), and social studies (Sun et al. Citation2013). Many types of big geodata are used in human mobility studies, such as call detailed records (CDRs) (González, Hidalgo, and Barabási Citation2008), global positioning system (GPS) data (Zheng et al. Citation2008), smart card data (Liu et al. Citation2009; Zhang et al. Citation2018), and social media check-ins (Cheng et al. Citation2011). For example, to analyse individual human mobility patterns, González, Hidalgo, and Barabási (Citation2008) used 100,000 anonymized mobile phone user trajectories by tracking their positions for a six-month period, whereas Zheng et al. (Citation2008) used the GPS logs collected by 65 individuals over a 10-month period. Liu et al. (Citation2009) studied the regularity of spatial-temporal mobility patterns extracted from smart card transactions in public transportation. To assess human mobility patterns, Cheng et al. (Citation2011) analysed the spatial, temporal, social, and textual aspects of 22 million check-ins with geo-tags from various online services, such as Foursquare, Twitter, Gowalla, Echofon, Gravity, and TwitBird, among others.
One way to represent urban interactions is to detect urban communities based on networks. There are different types of networks, such as road traffic networks, social networks, and protein interaction networks, in various scientific fields. In urban networks, community structure is an important feature that divides the network nodes into groups. The nodes within the same group are tightly connected, and the nodes within different groups are loosely connected (Girvan and Newman Citation2002). Identifying communities is crucial in many fields since it can help reveal popular topics in an information network or cyber-communities in a social network (Blondel et al. Citation2008). In addition, identifying communities can help explore and interpret patterns embedded in physical and cyberspace networks (Gao et al. Citation2013; Kang et al. Citation2013; Yu, Guan, and Chen Citation2019; Zhang et al. Citation2018).
In urban studies, tracking the changes in community structures is important for understanding the dynamics of human movement and gaining information on population dynamics. Previous studies have detected urban communities in various applications. For example, urban community results can provide information to help plan transportation and urban infrastructure through daily mobile phone and taxicab usage (Kang et al. Citation2013). It can also help extract the aggregated hourly patterns of land using a transport flow system (Yu, Guan, and Chen Citation2019). Another application example is using community patterns to uncover the hidden spatial structures embedded in public transit and taxi usage (Zhang et al. Citation2018). However, those studies had limited data with a short time period, either only a day (Yu, Guan, and Chen Citation2019) or a week (Kang et al. Citation2013; Zhang et al. Citation2018). The use of limited data may not be able to track the changes of community structure in a representative way.
As China’s transportation infrastructure continues to grow, more research is needed that collects transportation data over a longer period of time to analyse the spatial patterns of travel flows, as well as to understand how these patterns change over time. However, there are some challenges in achieving this goal, such as limited data sources and the inefficiency of analysing highly dynamic datasets. With the development of online car-hailing and ride sharing services, floating car data have become a new resource to facilitate the analysis of human mobility patterns and the interactions of urban mobility within a city. However, the use of newly emerging rideshare data to understand the change of community structures is still underexplored.
To fill this research gap and meet the urgent need, this study uses two-months of highly dynamic floating car data from a popular rideshare service in China (DiDi Chuxing (‘DiDi’)) to understand the short-term changes of community structures in Chengdu, a vibrant city in southwest China. To address the challenges mentioned above, we adopted the community detection method because it is especially useful for identifying the changes in traffic flows across time and space with limited data sources (Yu, Guan, and Chen Citation2019). In addition, community detection provides a feasible way to explore the highly dynamic and fast-evolving transportation infrastructures in developing countries like China.
The research questions of this study are twofold: 1) Methodologically, can floating car data effectively capture urban community structures and their changes over time? and 2) Empirically, based on a case study, how and why did community structures change in Chengdu in October and November 2016? To answer the research questions, we first examined the spatial characteristics of DiDi trips, such as the distributions of average daily trips and travel distances. Then, we explored the short-term spatial and temporal changes of community structures using newly emerging floating car data.
2. Related work
2.1 Taxi trajectory analysis
Many studies have used floating car data in various applications, such as:
Analyse trajectory patterns and points of interest (POIs) (Wang et al. Citation2020; Yue et al. Citation2009; Zhang et al. Citation2020). For example, taxi GPS trajectory data and POI records were used to discover the spatial-temporal pattern of urban dynamics in Beijing (Wang et al. Citation2020).
Extract urban clusters and urban rhythms (Kong et al. Citation2018; Liao et al. Citation2019; Zhao et al. Citation2020; Zhou et al. Citation2019). Urban clusters and rhythms have been explored in many studies. For example, Zhou et al. (Citation2019) modelled the drop-off activity intensities in areas of interest through spatiotemporal clustering. To reveal the urban rhythm, Kong et al. (Citation2018) simulated urban mobility and urban functional areas. Zhao et al. (Citation2020) analysed cab drivers’ behaviours to measure the activity intensities in different traffic analysis zones. Other researchers explored urban rhythm by examining and visualizing passengers’ travel behaviours (Liao et al. Citation2019).
Model urban interactions (Cui et al. Citation2016; Liu et al. Citation2017). When it comes to modelling urban interactions, some studies focused on measuring the traffic flow interactions in urban road systems (Liu et al. Citation2017) or addressing the accessibility problem in transportation systems (Cui et al. Citation2016).
However, very few studies have examined the structure and formation of urban communities using taxi trajectory data (Zhang et al. Citation2018; Yu, Guan, and Chen Citation2019), or how this structure changes over time. One study by Zhang et al. (Citation2018) explored the communities in Singapore using both taxi GPS trajectory data and public transit data. It also compared the differences between the two data sources. Nevertheless, there are limited studies exploring the change of communities across time based on taxi GPS trajectories (Yu, Guan, and Chen Citation2019). Yu, Guan, and Chen (Citation2019) studied the spatial community pattern variations across time and separated the time into four periods: morning rush hour, noon rush hour, evening rush hour, and midnight. However, the data used in their study was limited to 24 hours. To analyse the formation of communities and their variations across time in a longer time scale, this study uses two-months (October 2016 and November 2016) of taxi trajectory data and separates them into weekdays and weekend days.
2.2 Community detection methods
There are several ways to detect communities in cities. Two popular community detection methods are graph partitioning and hierarchical clustering (Gao et al. Citation2013). In graph partitioning, a network graph is divided into non-overlapping groups. For example, Kernighan and Lin (Citation1970) presented a heuristic method for partitioning arbitrary graphs to minimize the sum of costs on all edges. Newman (Citation2013) adapted the Laplacian spectral partitioning method to identify communities using computer-generated and real-world networks. In hierarchical clustering, there is a hierarchical structure of clusters of nodes, and nodes within each cluster are more connected than nodes in different clusters. For instance, Li et al. (Citation2019) applied the hierarchical clustering algorithm to community detection based on the edge-weighted similarity in social network data. Chen et al. (Citation2021) proposed a variable granularity hierarchical clustering method to construct a hierarchical structure of networks on humans, dolphins, and books about U.S. politics. Among those two categories of methods, the hierarchical clustering method is widely used for non-overlapping community detection. The modularity optimization approach was often used to deal with overlapping nodes in hierarchical clustering (Newman Citation2004; Chen et al. Citation2021). Thus, we also apply the modularity optimization approach in this study to detect non-overlapping communities.
One of the most popular modularity optimization approaches for community detection is the Newman modularity maximization method (Newman Citation2004). Newman and Girvan (Citation2004) proposed the modularity metric method to evaluate the quality of dividing networks into communities. However, the modularity metric method has some limitations, such as the high time complexity and the limited application of this algorithm to real-world situations. This is because the use of this algorithm is restricted to networks of at most a few thousand vertices with current hardware. In contrast, the vertices can be more than a few thousand in the real world, such as in social media networks. Alternative algorithms have been developed to overcome these shortcomings, such as the fast greedy hierarchical agglomeration algorithm (Clauset, Newman, and Moore Citation2004). Another widely used modularity approach in community detection methods is the iterative algorithm proposed by Blondel et al. (Citation2008). For our study, we used the iterative algorithm to detect the community for two reasons. First, this algorithm is easy to use, and the outcome is unsupervised. Second, the algorithm is efficient and able to deal with large volumes of data.
3. Study area and data
With the rapid development of mobile phone payments and the benefits of the shared economy, DiDi has become a popular ride-sharing platform in China. The trajectory data from DiDi taxis make it possible to detect physical communities in Chinese cities since DiDi has more users than other ride-sharing services, including YongChe, Cao Cao, Ucar, and ShouYue. With the emergence of online car-hailing, this type of data can provide a new source to analyse urban interactions.
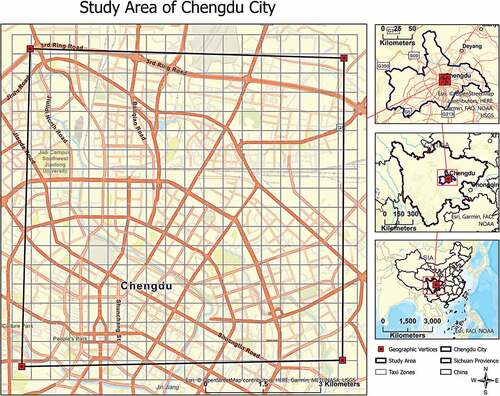
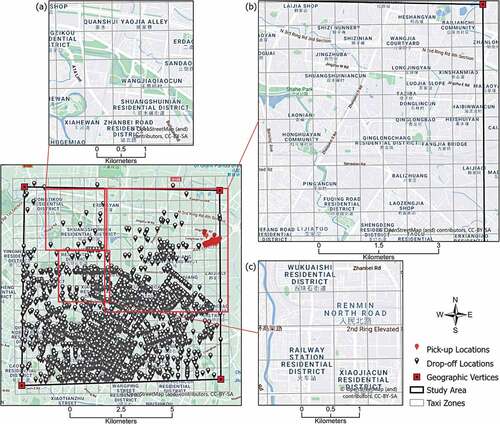
The trajectory data set for the study area in Chengdu, China was obtained from the GAIA Open Dataset (DiDi Chuxing Citation2020). Due to data availability, the study area only focused on the 65 km2 central area of Chengdu (). In this research, we use two months of trajectory data, from October 2016 and November 2016. The trajectory data include the driver ID, order ID, timestamp, longitude, and latitude information. The collection interval of the tracked points is 2 to 4 seconds. The ride start time, ride stop time, and pick-up and drop-off locations (longitudes and latitudes) were extracted for each record based on the sorted time stamp. The total number of cleaned records was over 10,000,000 for both October and November. Further, 324 grids (each square 500 metres long) were generated to represent the taxi zones in the study area, as shown in . These grids were used as the nodes in community detection analysis.
Figure 1. Study area. The resolution of this map is 300 dpi, which applies to all other colour maps.
4. Methodology
The analysis workflow is shown in . To explore the urban interactions in Chengdu, China, we first examined the spatial distribution of DiDi usage, including average daily trips and travel distances, to better understand the service radius of DiDi and the range of human movement in different parts of the city at the taxi zone level. Then, we detected the communities to reveal the spatial and temporal changes of the community structures.
Figure 2. Analytical framework for this study.
4.1 Data preprocessing
We used undirected graphs to explore the spatial distribution of DiDi usages because we are interested in the number of average daily trips and the spatial pattern of travel distance at the taxi zone level instead of the directed graphs that focus on directions between origins and destinations. The trips were aggregated as incoming (drop-off) trips and outgoing (pick-up) trips in each taxi zone for weekdays and weekend days, respectively. For example, the average daily trips for weekday incoming trips were calculated by the sum of total incoming trips on weekdays divided by the number of weekdays. In addition, we used the median travel distance to identify the spatial patterns of travel distances at different times (i.e. weekdays and weekend days, October and November). We also calculated the median travel distance for both incoming and outgoing trips at the taxi zone level. Then, we mapped the median travel distance values to compare the variations between different time stamps.
4.2 Spatial and temporal difference of communities
As discussed in Section 2.2, we used the iterative algorithm proposed by Blondel et al. (Citation2008) to detect the communities in October 2016 and November 2016. We calculated weekday and weekend communities separately. After data cleaning, we examined the spatial and temporal differences of the detected communities between those two months. Modularity was used as a criterion in the optimization process. The formula that we used to calculate the modularity is shown below:
Here, Q represents the modularity, m is the total number of trips. is the average daily trips between taxi zone
and taxi zone
, and
and
are the average daily trips between taxi zones
and
. If taxi zones
and
belong to the same community, the value of
will be 1; otherwise
is 0.
The first phase of the iterative algorithm is modularity optimization. First, it assigns each node with a different community, then it calculates and obtains the maximum modularity for each node by moving it from its current community to another. This process runs iteratively and repeatedly until there are no more changes to the node. The second phase is community aggregation, where it builds a new network of communities whose nodes are found from the first phase. The weight of the links between new nodes is the sum of the weight of the links between nodes within two communities (inter-community). There is also a self-loop for the weight when the links between nodes are in the same community (intra-community). The iterative process for those two phases stops when the maximum modularity of each node is obtained without any more change on node partition.
In this study, the taxi zones were considered the nodes in the algorithm. The commute between the taxi zone pairs formed the edges in the constructed community networks, and the number of trips between taxi zones were the edge weights.
5. Results and discussion
5.1 Spatial distribution of DiDi usage
show the spatial distribution of average daily DiDi trips for weekdays and weekend days in October and November. Similar patterns can be seen in different trip categories (for incoming and outgoing, weekdays and weekend days, October and November), that taxi zones on the south and west sides had more daily trips than those on the north and east sides of the study area. For October, taxi zones on the west and south edges of the study area had more outgoing average daily trips than incoming average daily trips (). As shown in , those taxi zones towards the south and west sides had more average daily trips that were either in the downtown area of Chengdu (within the second road ring) or close to university campuses. For example, the University of Electronic Science and Technology of China (Jiulidi Campus) and Southwest Jiaotong University (Jiuli Campus) were places with more human movement (). The holiday effect may be one possible explanation for taxi zones in the south and west edge areas to have more outgoing trips than incoming trips in October. There is the national holiday (the National Day of China) from October 1 to October 7, when many Chinese people take vacations. Those taxi zones with more outgoing trips were in residential areas and areas with many hotels. These taxi zones were not too far away from many tourist destinations, such as the Chengdu Yongling Museum () and the Culture Park (). People who lived in those taxi zones could go out during the holiday break by visiting the museums or parks.
Figure 3. Average daily didi usage in October: (a) Outgoing trips on weekdays; (b) Incoming trips on weekdays; (c) Outgoing trips on weekend days; and (d) Incoming trips on weekend days.
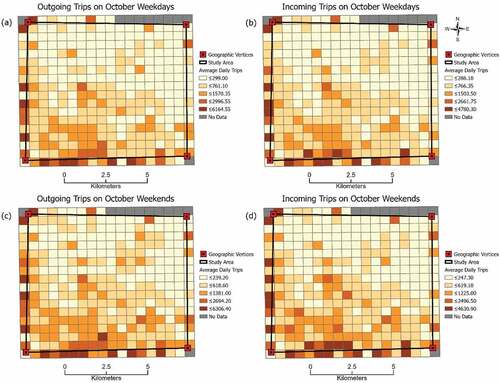
Figure 4. Average daily didi usage in November: (a) Outgoing trips on weekdays; (b) Incoming trips on weekdays; (c) Outgoing trips on weekend days; and (d) Incoming trips on weekend days.
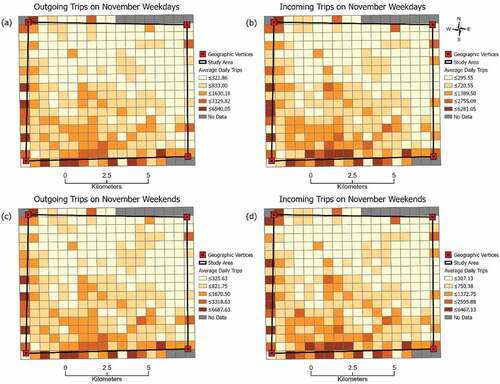
Figure 5. Absolute differences between outgoing and incoming trips in October: (a) Weekdays; and (b) Weekend days.
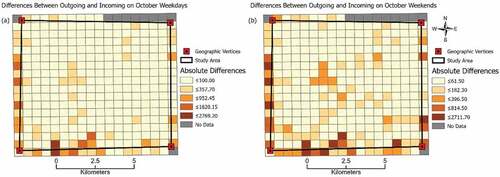
Figure 6. Absolute differences for incoming trips between November and October: (a) Weekdays; and (b) Weekend days.
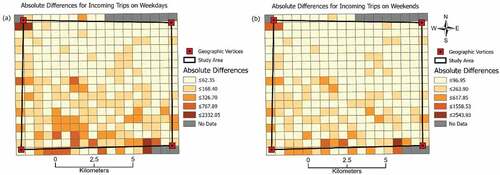
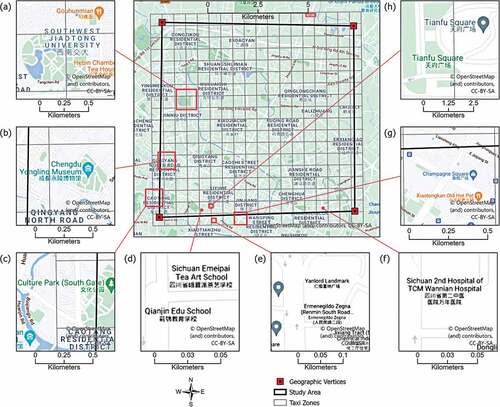
Figure 7. Base map for didi usage analysis: (a) Southwest jiaotong university; (b) Chengdu yongling museum; (c) Culture park; (d) qianjin edu school; (e) Yanlord landmark plaza; (f) Sichuan 2nd hospital of tcm wannian hospital; (g) Champagne square; and (h) Tianfu square.
In November, compared to October, there was an increase of daily average incoming trips for both weekdays and weekend days on the west and south edges of the study area (). Possible reasons for this change are the decreased impact from a national holiday and the points of interest towards the west and south edges of the study area. Areas with increased average daily incoming trips were essential locations, such as schools and workplaces on weekdays and entertainment locations on weekend days. Taxi zones with increased average daily incoming trips encompass schools, plazas, hospitals, and squares, or were close to museums and parks, such as Qianjin Edu School (), Yanlord Landmark Plaza (), Sichuan 2nd Hospital of TCM Wannian Hospital (), Champagne Square (), Tianfu Square (), etc. In October, under the influence of a national holiday, people were less likely to go to schools or hospitals. However, in November, without the effect of the holiday, people were more likely to go back to their regular points of interest (e.g. schools, hospitals, and plazas) for daily activities.
Overall, taxi zones with more average daily trips were the areas with more urban infrastructure, such as downtown areas or areas with high density of POIs (e.g. schools). This finding is consistent with the results in previous studies that downtown areas normally have highly clustered taxicab trips (Kang et al. Citation2013; Zhang et al. Citation2018), although the study areas are different. The holiday effect and the distribution of points of interest are possible reasons that affect the average daily trips in this study area. Previous studies found that holidays affect population mobility patterns and dynamics at multiple spatial and temporal scales (Wang et al. Citation2017; Li et al. Citation2020; Lai et al. Citation2022). For example, more long-distance travel happens during holidays within a city (Wang et al. Citation2017). Tourism destinations attract more visitors during national holidays, so the average number of inter-city trips during national holidays is significantly higher than regular workdays (Li et al. Citation2020). The spatiotemporal patterns of urban mobility changes during public and school holidays at the global scale (Lai et al. Citation2022). Those findings supported our conclusion that national holidays can be one of the possible reasons that affect the average daily trips in this study area.
illustrate the median travel distance for each taxi zone in October and November, respectively. For different types of trip categories (incoming and outgoing, weekdays and weekend days, October and November), there was also a similar pattern that taxi zones in the northeast study area had a higher median travel distance than taxi zones in the west and south areas. Compared to trips on October weekdays and incoming trips on October weekend days, the median travel distance for outgoing trips increased substantially in the eight taxi zones in the northeast area. This pattern indicates that people who lived in those eight taxi zones had a large range of outgoing movement during weekend days in October.
Figure 8. Median Travel Distance for each Taxi Zone in October: (a) Outgoing Trips on Weekdays; (b) Incoming Trips on Weekdays; (c)outgoing Trips on Weekend Days; and (d) Incoming Trips on Weekend Days.
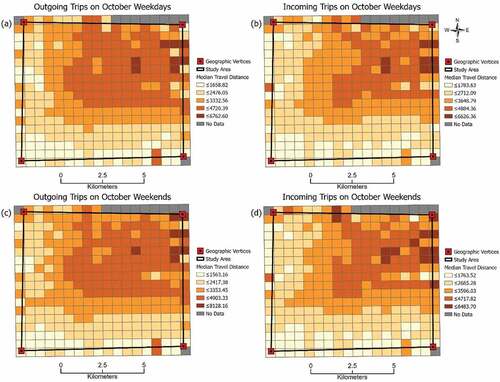
Figure 9. Median travel distance for each taxi zone in November: (a) Outgoing trips on weekdays; (b) Incoming trips on weekdays; (c) Outgoing trips on weekend days; and (d) Incoming trips on weekend days.
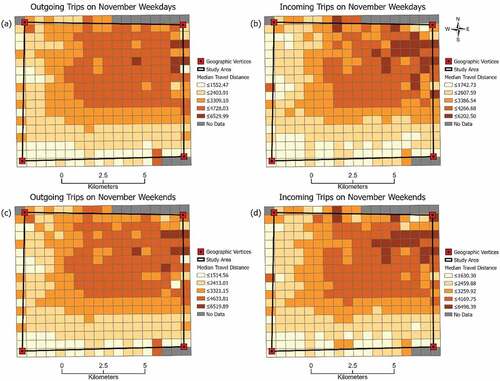
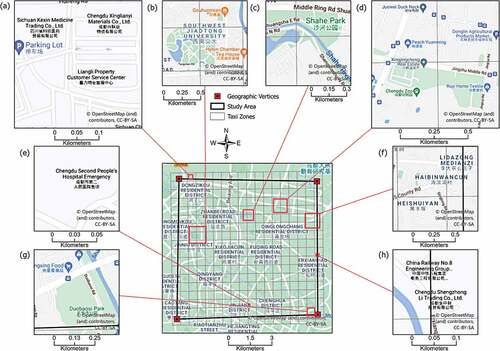
As shown in , taxi zones in the northeast area, which have higher median travel distances, are mainly located in residential areas, such as residential communities and villages (). This is different from the results in Zhang et al. (Citation2018), which showed a smooth variation of travel distances for taxi trips over space. The median travel distance of taxi trips in Singapore is consistent with the distance from the pickup zones to the central city. In other words, taxi zones closer to the central city had relatively shorter trips in Singapore. In this study, because Chengdu is a monocentric city, job opportunities are mostly located in the city centre, which attracts a large amount of people commuting to and from the city centre. People living in the northeast area who need to go to the city centre (the southwest area) have a large range of human movement that can result in higher median travel distance there. However, Singapore has been developing towards a polycentric urban area (Han Citation2005), which can explain the differences of the findings between the two studies.
Figure 10. Base map for geographic variations of travel distance analysis: (a) Wang jia qiao cun, etc.; (b) Hong hua yan community, Wang jia courtyard, etc.; and (c) Wu kuai shi residential district, etc.
Since the residential area on the northeast side takes a large portion of the entire study area, we randomly selected two taxi zones with high median travel distances in different trip categories as an example to examine the range of human movement. Based on the drop-off locations (), people who lived in those two taxi zones had a large range of movement and mainly went to the centre of the city in the southwest corner or the south side of the study area, which is far away from where they lived. It is also interesting to highlight that eight taxi zones had increased median travel distances for outgoing trips on October weekend days, which may be caused by the holiday effect because people living in those taxi zones had a larger range of movement during holidays. In summary, the range of human movement varies within the city based on how far people need to travel in their day-to-day life.
5.2 Community detection based on taxi trips
In this section, we aim to explore how community structures change over time in Chengdu and how grid sizes impact the analytical results. We first explored the spatial and temporal changes of communities between weekdays and weekend days based on a grid size of 500 metres. Then, we conducted further comparative analysis based on different grid sizes to test how grid size affects the spatial and temporal patterns of communities.
5.2.1 Spatial and temporal difference of communities
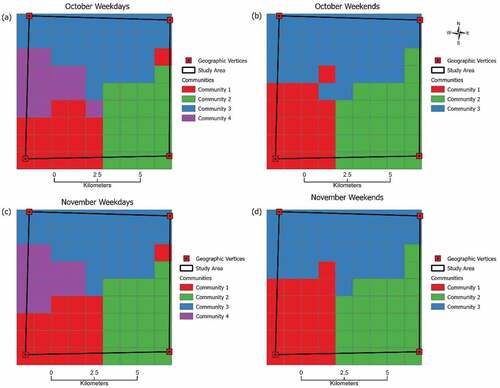
shows the extracted spatial interaction communities at different times based on a grid length of 500 metres. The detected communities were mainly formed by adjacent taxi zones, which is consistent with the results reported by Zhang et al. (Citation2018) that spatially cohesive communities were mainly formed by adjacent districts. However, only one week of taxi GPS trajectories data was used to detect the community for Singapore in the Zhang et al. (Citation2018) study. Because two months of highly accurate floating car data were used to detect the community in our study area, the results are more reliable and representative. There were four detected communities on weekdays for both October and November, and these communities showed very similar patterns.
Figure 11. Spatial interaction communities on different timestamps with cell size of 500 m: (a) October weekdays; (b) October weekend days; (c) November weekdays; and (d) November weekend days.
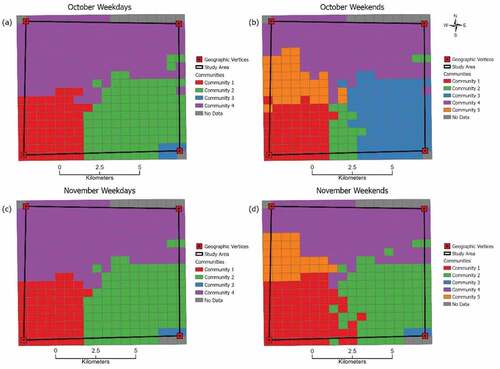
There were a few isolated taxi zones (green colour) on the east side of the study area that belong to community 2 and one taxi zone (purple colour) that belongs to community 4 in October. Those taxi zones were not adjacent to other taxi zones in the same community. As shown in , the distinctive taxi zones (green colour) on the east side of the study area in community 2 were in residential locations (), while community 2 is mainly formed by taxi zones in residential locations, schools, and hospitals. Thus, those distinct taxi zones with residential locations that belong to community 2 were consistent. For October, one distinct taxi zone (purple colour) in community 4 was in an area with companies and residential buildings (). Community 4 was formed by universities, parks, Chengdu Zoo, and shopping malls. For October, people who worked in the companies and lived in the surrounding residential areas (purple colour taxi zone) could go to the shopping malls or zoo during holidays, which caused the purple colour taxi zone to become part of community 4.
Figure 12. Base map for community analysis: (a) Companies; (b) Southwest Jiaotong university; (c) Shahe park; (d) Chengdu zoo, shopping malls; (e) Chengdu second people’s hospital emergency (f) Hai bin wang cun; (g) Duobaosi park and small shops; and (h) Companies.
There was a big difference in the detected communities between weekdays and weekend days for both October and November. Community 4 was separated into two smaller communities during weekend days. This result differs from the previous studies, which showed that the community patterns extracted from taxi data were similar on weekdays and weekend days (Li and Zhang Citation2016; Zhang et al. Citation2018). However, one week of data in Zhang et al. (Citation2018) may not be able to efficiently reveal the changes of communities between weekdays and weekend days. In contrast, different community patterns were detected between weekdays and weekend days for bus networks but not for taxi networks in Li and Zhang (Citation2016).
The change of community patterns between weekdays and weekend days in this study can be explained by the diverse activities during weekend days. School zones and the surrounding areas become smaller communities, such as the areas near Southwest Jiaotong University () and Chengdu Railway Middle School. Chengdu Zoo, shopping malls (), companies (), and parks () also become another smaller community where students can do part-time jobs and seek entertainment during weekend days.
There were changes in community 2 and community 3 during weekend days in October compared to other time periods. In October, a few taxi zones in the middle south of the study area were in community 2, and more taxi zones belonged to community 3 in the southeast of the study area. However, at other times in the two months, only three or five taxi zones on the southeast corner were in community 3, and the majority of the taxi zones belonged to community 2. This finding is similar to the finding in Gao et al. (Citation2013) that one of the cells (with coverage area of a mobile base station) was aggregated into a different community during weekend days. This is because in that cell, there are government buildings showing strong connections with the central business district only on weekdays. This further confirms that land uses and human activities during different time periods can change the structure of communities.
As shown in , those taxi zones that include the Chengdu Second People’s Hospital and surrounding areas () became a small community (community 2). Other taxi zones on the southeast side were merged into another larger community (community 3). On October weekdays and the entire month of November, only five or three taxi zones in the southeast corner became part of community 3, which contained residential locations, Chenghua Aoyuan Plaza, Duobao Temple, Duobaosi Park, and small shops (), etc. Other taxi zones in the southeast area formed community 2.
One possible reason to explain the changes in community 2 and community 3 on October weekend days is the holiday effect. People may be less likely to go to hospitals during holidays for various reasons. Thus, taxi zones with those two big hospitals and small surrounding areas became a community. In addition, community 3 in the southeast corner already contains basic leisure facilities, such as parks. It is understandable that only five or three taxi zones in the southeast corner became a community on October weekdays and the month of November. The results indicate that besides the national holiday effect, diversity of activities during weekend days and the distribution of urban infrastructures within taxi zones also affect the change of community structures.
5.2.2 Impact of grid size
Geographical phenomena are scale sensitive (Chen et al. Citation2019). Spatial scale often has a great impact on the analytical results. Using coarser and finer analysis units may lead to different results. In addition, a single spatial scale often cannot provide a comprehensive view when analysing spatial patterns (Jelinski and Wu Citation1996; Zhang et al. Citation2018). Thus, we generated multi-scale grid sizes to compare the results in this study. We conducted further analysis of community detection based on different grid sizes to test how grid size affects the spatial and temporal patterns of communities. We used a grid size of 1 km (81 grids) and a grid size of 100 m (7,310 grids) to create taxi zones as the nodes in the community detection analysis.
Compared to the results of when using a grid size of 500 m, the communities when the grid size equals 1 km generated a smaller number of communities during October and November weekend days (). The central city, which is the southwest sides of the study area, still formed into one community. However, the southeast side of the study area became one big community without small communities separate from it. The detailed structure of the community with Chengdu Second People’s Hospital on October weekend days and small communities on the southeast corner were detected in the results of the grid size of 500 m, but not in the grid size of 1 km. The northside of the study area aggregated into one community on October and November weekend days (). This is different from the results in the grid size of 500 m where two communities formed in the northside area based on the activities diversity. But the Southwest Jiaotong University and surrounding areas formed a community on October and November weekdays ().
Figure 13. Spatial interaction communities on different timestamps with cell size of 1 km: (a) October weekdays; (b) October weekend days; (c) November weekdays; and (d) November weekend days.
Overall, sparse patterns with a smaller number of communities were detected in the grid size of 1 km compared to the grid size of 500 m. This is because the larger the size of the grids, the more trips counted between taxi zones (edge weights on community detection), which makes it easier to group taxi zones with similar edge weights with large volume of traffic flows into one community. In general, results from the grid size of 1 km cannot provide detailed information of small communities in the southeast corner. In addition, results from the 1 km grid size cannot capture the detailed structure of the community formed by the university campus and surrounding areas in the northwest, as well as the community created by the office buildings in the northeast side of study area during weekend days. This finding can be supported by the study of Yu, Guan, and Chen (Citation2019) that different cell sizes can lead to different community detection results.
When the grid size was 100 m, more than 2,000 taxi zones had no trips start or end in them, so we were unable to detect their communities (Yu, Guan, and Chen (Citation2019), but we could still recognize the overall community patterns (). Similar to the results from the grid size of 500 m, the central city became a community and the southeast side of the study area became another community. In addition, small communities can be detected in the southwest and southeast corners. The taxi zones with Southwest Jiaotong University and working locations such as shopping malls and companies in the northside of the study area were aggregated into different communities.
Figure 14. Spatial interaction communities on different timestamps with cell size of 100 m: (a) October weekdays; (b) October weekend days; (c) November weekdays; and (d) November weekend days.
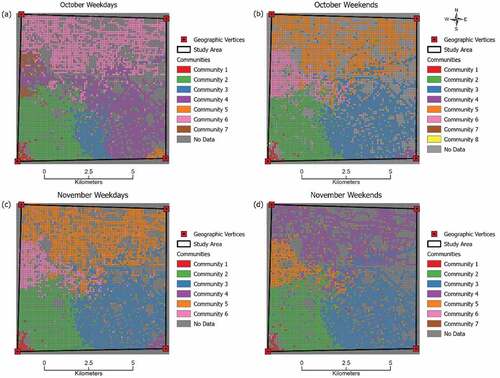
However, the detected communities became disconnected and scattered. For example, various taxi zones (green colour) across the whole study area were in the same community with the central city (). The community formed by Chengdu Second People’s Hospital and surrounding areas on October weekdays (blue colour in ) and the community formed by the Southwest Jiaotong University have lots of disconnected taxi zones distributed in the central city or adjacent communities (pink colour in ).
In addition, a grid size of 100 m can catch finer scale patterns. Some small communities with only two or three taxi zones were detected as a community, such as communities 7 and 8 on October weekend days () and communities 6 and 7 on November weekend days (). Those small communities with only two or three taxi zones are hard to explain. In general, the smaller grid size was able to detect finer scale of communities in the same study area, and the spatial-temporal patterns of communities were slightly different. However, an excessively small grid size does not suit this study because it makes it difficult to detect flows between adjacent grids and nearby grids. This is because people are very unlikely to take a taxi to go 100 m.
Our goal of this study is not to identify the optimal size of the analysis, which can be explored in future studies. We aim to demonstrate that taxi trips can be a valuable resource for detecting urban community changes, and it is obvious that grid sizes may affect the results. The adopted grid size is also related to the spatial scale of the patterns a researcher is interested in. Future studies can decide the grid size based on their data and practical needs.
6. Conclusion
This study focused on analysing urban interactions using location data from a ride-sharing service (DiDi) in Chengdu, China at the taxi zone level. To better understand how and why communities change in different time periods, we analysed the spatial distribution of DiDi trips, the spatial pattern of travel distances, and the spatial-temporal changes of community structures. We achieved the two objectives of this study through four major findings.
First, the results show similar patterns of spatial distribution of DiDi usage across weekdays and weekend days, where taxi zones on the south and west side have more average daily trips compared to the other side of the study area. This finding provides quantitative evidence for understanding the distribution of human mobility in Chengdu. The results can be used to analyse urban-level mobility patterns, such as exploring the spatiotemporal patterns of urban mobility changes, especially in communities of interest. In addition, traditional annual average daily traffic (AADT) data collected from traffic stations and probes primarily focus on traffic counts at individual locations. The results from this research can supplement traditional AADT data and provide valuable input about urban interactions, such as detecting the areas that are most likely to have high volumes of traffic between them.
Second, we found that certain taxi zones have a high median travel distance, which indicates a large range of human movement. The northeast side of the study area is mainly residential, but the southwest study area is the centre of the city with urban structures such as schools, hospitals, museums, parks, plazas, and squares, where people patronize more frequently. As confirmed by , people who live in the residential area on the northeast side mainly go to the southwest side, which is far away from where they live because there are points of interest in the destination areas for their daily needs. Chengdu is currently a monocentric city, so this finding can provide valuable input for urban planners when developing future infrastructure to help release the pressure in the city centre.
Third, the detected communities are mainly formed by adjacent taxi zones, whereas there are disconnected taxi zones that belong to the same community due to urban land use types and the national holiday effect. For example, the small residential taxi zones (green colour) on the east side of the study area belong to community 2 (mainly formed by taxi zones in residential locations, schools, and hospitals), but they are not connected to the rest of the community.
Lastly, we found that there are interesting spatial and temporal changes of community structures at different times. Specifically, in October and November, community 4 splits into two smaller communities during weekend days because of students’ different types of activities, such as attending classes, working at part-time jobs, or spending leisure time at shopping malls or parks. In addition, the diversity of activities during weekend days, the holiday effect, and the availability of urban facilities in taxi zones may affect the spatial-temporal patterns of communities in the study area. Individuals’ travel behaviours, such as school activity on weekdays and entertainment at shopping malls on weekend days, can influence community changes. The results indicate that exploring the spatial and temporal changes of communities at the taxi zone level effectively tracks micro-level activity patterns during special events, such as a national holiday. These results can be used for planning future infrastructure and land uses in the study area.
We found that taxi trips can be a valuable resource for detecting urban community changes, and the grid sizes may affect the results. Large grid sizes can be used to detect patterns with less detailed information, whereas smaller grid sizes make it difficult to detect flows between adjacent grids and nearby grids. Future studies can adopt an appropriate grid size based on the spatial scale of the patterns of interest, nature of the data, and other practical considerations.
This study has several strengths. Methodologically, we demonstrated the effectiveness of using taxi trajectory data to detect short-term community changes. The trajectory data used in this study to generate pick-up and drop-off locations have a high temporal resolution (2 ~ 4 seconds). With higher temporal resolutions, we can observe precise origins and destinations. Empirically, we explored the community structure of a rapidly growing monocentric city in Southwest China. This study focused on short-term changes of community structure using newly emerging online car-hailing data, which is still underexplored. We demonstrated that the trajectory data from ride-sharing trips can provide new sources for analysing urban interactions. The results can provide useful information for urban planning such as detecting areas with a lower level of accessibility, developing future infrastructure, and analysing land use patterns in the study area. More specifically, the detected changes in communities can offer valuable insights when identifying how different urban districts connect and exploring the possibilities of converting a monocentric city into a polycentric one.
There are also some limitations to this study. Because of data accessibility issues, the dataset was collected in 2016, and the study area is limited to a small area, which cannot represent the entire Chengdu city limits. Future studies can use more recent floating car data in a larger study area to track the spatial-temporal changes of urban interactions across the entire metro area of Chengdu. To increase the generalizability of the research results, different types of trajectory data can be added to future studies, such as public transportation data. Additionally, it may be interesting to explore the cultural differences in distance decay effect of trips in various countries, considering that the average cost of taxis is relatively low in China compared to many western countries. A further study on distance decay effect will help us better understand the urban interactions in this study area.
Acknowledgments
The data used for this paper was provided by DiDi Chuxing. Data source: DiDi Chuxing GAIA Open Dataset Initiative (https://gaia.didichuxing.com).
Disclosure statement
No potential conflict of interest was reported by the author(s).
References
- Ahas, R., A. Aasa, Ü. Mark, T. Pae, and A. Kull. 2007. “Seasonal Tourism Spaces in Estonia: Case Study with Mobile Positioning Data.” Tourism Management 28 (3): 898–910. doi:10.1016/j.tourman.2006.05.010.
- Blondel, V. D., J. -L. Guillaume, R. Lambiotte, and E. Lefebvre. 2008. “Fast Unfolding of Communities in Large Networks.” Journal of Statistical Mechanics: Theory and Experiment 2008 (10): 10008. doi:10.1088/1742-5468/2008/10/P10008.
- Chen, L., Y. Gao, D. Zhu, Y. Yuan, and Y. Liu. 2019. “Quantifying the Scale Effect in Geospatial Big Data Using Semi-Variograms.” PLoS One 14 (11): e0225139. doi:10.1371/journal.pone.0225139.
- Cheng, Z., J. Caverlee, K. Lee, and D. Sui. 2011. “Exploring Millions of Footprints in Location Sharing Services.” Proceedings of the International AAAI Conference on Web and Social Media 5 (1): 81–88. doi:10.1609/icwsm.v5i1.14109.
- Chen, J., Y. Li, X. Yang, S. Zhao, and Y. Zhang. 2021. “VGHC: A Variable Granularity Hierarchical Clustering for Community Detection.” Granular Computing 6 (1): 37–46. doi:10.1007/s41066-019-00195-1.
- Clauset, A., M. E. J. Newman, and C. Moore. 2004. “Finding Community Structure in Very Large Networks.” Physical Review E 70 (6): 066111. doi:10.1103/PhysRevE.70.066111.
- Cui, J., F. Liu, D. Janssens, S. An, G. Wets, and M. Cools. 2016. “Detecting Urban Road Network Accessibility Problems Using Taxi GPS Data.” Journal of Transport Geography 51: 147–157. doi:10.1016/j.jtrangeo.2015.12.007.
- DiDi Chuxing. (2020). GAIA open dataset. https://outreach.didichuxing.com/research/opendata/en/
- Gao, S., Y. Liu, Y. Wang, and X. Ma. 2013. “Discovering Spatial Interaction Communities from Mobile Phone Data.” Transactions in GIS 17 (3): 463–481. doi:10.1111/tgis.12042.
- Girvan, M., and M. E. J. Newman. 2002. “Community Structure in Social and Biological Networks.” Proceedings of the National Academy of Sciences 99 (12): 7821–7826. doi:10.1073/pnas.122653799.
- González, M. C., C. A. Hidalgo, and A. -L. Barabási. 2008. “Understanding Individual Human Mobility Patterns.” Nature 453 (7196): 779–782. doi:10.1038/nature06958.
- Han, S. S. 2005. “Polycentric Urban Development and Spatial Clustering of Condominium Property Values: Singapore in the 1990s.” Environment and Planning A: Economy and Space 37 (3): 463–481. doi:10.1068/a3746.
- Jelinski, D. E., and J. Wu. 1996. “The Modifiable Areal Unit Problem and Implications for Landscape Ecology.” Landscape Ecology 11 (3): 129–140. doi:10.1007/BF02447512.
- Kang, C., S. Sobolevsky, Y. Liu, and C. Ratti (2013). Exploring Human Movements in Singapore: A Comparative Analysis Based on Mobile Phone and Taxicab Usages. Proceedings of the 2nd ACM SIGKDD International Workshop on Urban Computing, 1–8. 10.1145/2505821.2505826
- Kernighan, B. W., and S. Lin. 1970. “An Efficient Heuristic Procedure for Partitioning Graphs.” Bell System Technical Journal 49 (2): 291–307. doi:10.1002/j.1538-7305.1970.tb01770.x.
- Kong, X., F. Xia, Z. Ning, A. Rahim, Y. Cai, Z. Gao, and J. Ma. 2018. “Mobility Dataset Generation for Vehicular Social Networks Based on Floating Car Data.” IEEE Transactions on Vehicular Technology 67 (5): 3874–3886. doi:10.1109/TVT.2017.2788441.
- Lai, S., A. Sorichetta, J. Steele, C. W. Ruktanonchai, A. D. Cunningham, G. Rogers, P. Koper, et al. 2022. “Global Holiday Datasets for Understanding Seasonal Human Mobility and Population Dynamics.” Scientific Data 9 (1): 17. doi:10.1038/s41597-022-01120-z.
- Liao, C., C. Chen, Z. Zhang, and H. Xie. 2019. “Understanding and Visualizing Passengers’ Travel Behaviours: A Device-Free Sensing Way Leveraging Taxi Trajectory Data.” Personal and Ubiquitous Computing 26 (3): 491–503. doi:10.1007/s00779-019-01346-6.
- Li, C., J. Bai, W. Zhao, and X. Yang. 2019. “Community Detection Using Hierarchical Clustering Based on Edge-Weighted Similarity in Cloud Environment.” Information Processing & Management 56 (1): 91–109. doi:10.1016/j.ipm.2018.10.004.
- Liu, K., S. Gao, P. Qiu, X. Liu, B. Yan, and F. Lu. 2017. “Road2vec: Measuring Traffic Interactions in Urban Road System from Massive Travel Routes.” ISPRS International Journal of Geo-Information 6 (11): 321. doi:10.3390/ijgi6110321.
- Liu, L., A. Hou, A. Biderman, C. Ratti, and J. Chen (2009). Understanding Individual and Collective Mobility Patterns from Smart Card Records: A Case Study in Shenzhen. 2009 12th International IEEE Conference on Intelligent Transportation Systems, 1–6. 10.1109/ITSC.2009.5309662
- Li, T., J. Wang, J. Huang, and X. Gao. 2020. “Exploring Temporal Heterogeneity in an Intercity Travel Network: A Comparative Study Between Weekdays and Holidays in China.” Journal of Geographical Sciences 30 (12): 1943–1962. doi:10.1007/s11442-020-1821-9.
- Li, J., and W. Zhang (2016). Identifying Spatial Structure of Travel Modes Through Community Detection Method. 2016 IEEE International Conference on Intelligent Transportation Engineering (ICITE), 227–231. 10.1109/ICITE.2016.7581337
- Newman, M. E. J. 2004. “Fast Algorithm for Detecting Community Structure in Networks.” Physical Review E 69 (6): 066133. doi:10.1103/PhysRevE.69.066133.
- Newman, M. E. J. 2013. “Community Detection and Graph Partitioning.” EPL (Europhysics Letters) 103 (2): 28003. doi:10.1209/0295-5075/103/28003.
- Newman, M. E. J., and M. Girvan. 2004. “Finding and Evaluating Community Structure in Networks.” Physical Review E 69 (2): 026113. doi:10.1103/PhysRevE.69.026113.
- Sun, L., K. W. Axhausen, D. -H. Lee, and X. Huang. 2013. “Understanding Metropolitan Patterns of Daily Encounters.” Proceedings of the National Academy of Sciences 110 (34): 13774–13779. doi:10.1073/pnas.1306440110.
- Tu, W., Q. Li, Z. Fang, S. Shaw, B. Zhou, and X. Chang. 2016. “Optimizing the Locations of Electric Taxi Charging Stations: A Spatial–Temporal Demand Coverage Approach.” Transportation Research Part C: Emerging Technologies 65: 172–189. doi:10.1016/j.trc.2015.10.004.
- Wang, W., X. Li, P. Jiao, G. Xu, N. Yuan, and W. Yu. 2017. “Exploring Intracity Taxi Mobility During the Holidays for Location-Based Marketing.” Mobile Information Systems 2017: e6310827. doi:10.1155/2017/6310827.
- Wang, J., J. Wu, Z. Wang, F. Gao, and Z. Xiong. 2020. “Understanding Urban Dynamics via Context-Aware Tensor Factorization with Neighboring Regularization.” IEEE Transactions on Knowledge and Data Engineering 32 (11): 2269–2283. doi:10.1109/TKDE.2019.2915231.
- Wesolowski, A., N. Eagle, A. J. Tatem, D. L. Smith, A. M. Noor, R. W. Snow, and C. O. Buckee. 2012. “Quantifying the Impact of Human Mobility on Malaria.” Science 338 (6104): 267–270. doi:10.1126/science.1223467.
- Yue, Y., Y. Zhuang, Q. Li, and Q. Mao (2009). Mining Time-Dependent Attractive Areas and Movement Patterns from Taxi Trajectory Data. 2009 17th International Conference on Geoinformatics, 1–6. 10.1109/GEOINFORMATICS.2009.5293469
- Yu, W., M. Guan, and Z. Chen. 2019. “Analyzing Spatial Community Pattern of Network Traffic Flow and Its Variations Across Time Based on Taxi GPS Trajectories.” Applied Sciences 9 (10): 2054. doi:10.3390/app9102054.
- Zhang, B., S. Chen, Y. Ma, T. Li, and K. Tang. 2020. “Analysis on Spatiotemporal Urban Mobility Based on Online Car-Hailing Data.” Journal of Transport Geography 82: 102568. doi:10.1016/j.jtrangeo.2019.102568.
- Zhang, X., Y. Xu, W. Tu, and C. Ratti. 2018. “Do Different Datasets Tell the Same Story About Urban Mobility—a Comparative Study of Public Transit and Taxi Usage.” Journal of Transport Geography 70: 78–90. doi:10.1016/j.jtrangeo.2018.05.002.
- Zhang, S., D. Zhu, X. Yao, X. Cheng, H. He, and Y. Liu. 2018. “The Scale Effect on Spatial Interaction Patterns: An Empirical Study Using Taxi O-D Data of Beijing and Shanghai.” IEEE Access 6: 51994–52003. doi:10.1109/ACCESS.2018.2869378.
- Zhao, P., Y. Xu, X. Liu, and M. -P. Kwan. 2020. “Space-Time Dynamics of Cab Drivers’ Stay Behaviors and Their Relationships with Built Environment Characteristics.” Cities 101: 102689. doi:10.1016/j.cities.2020.102689.
- Zheng, Y., Q. Li, Y. Chen, X. Xie, and W. -Y. Ma (2008). Understanding Mobility Based on GPS Data. Proceedings of the 10th International Conference on Ubiquitous Computing - UbiComp ’08, 312. 10.1145/1409635.1409677
- Zhou, T., X. Liu, Z. Qian, H. Chen, and F. Tao. 2019. “Dynamic Update and Monitoring of AOI Entrance via Spatiotemporal Clustering of Drop-Off Points.” Sustainability 11 (23): 6870. doi:10.3390/su11236870.