
 ?Mathematical formulae have been encoded as MathML and are displayed in this HTML version using MathJax in order to improve their display. Uncheck the box to turn MathJax off. This feature requires Javascript. Click on a formula to zoom.
ABSTRACT
Cities are complex and dynamic entities in close proximity of people, implying multi temporal observations to analyse and understand the urban context. At present, open-source data and geospatial intelligence are becoming the important means of exploring, monitoring and predicting urban status of area growth and population increase. In last few decades, unemployment and absence of infrastructures in the rural areas promoted the unplanned and haphazard urbanization across the urban centres in Pakistan. This study focuses on exploring the potential of open-source/freely available datasets for city mapping and monitoring spatially. The study gives a spatial perspective of rapidly growing cities of Pakistan using Google Earth Engine to classify Landsat images over last four decades, and discovers sprawl patterns across cities. The study works out that the built-up area is significantly increasing with population growth over four decades and there is a strong positive correlation between population growth and built-up expansion. Using Open-Source Data (Landsat images and LandScan data), this study has offered a technical solution of Google Earth Engine-supported analysis of statistics and machine learning to spatially monitoring the population change and urban growth of four major Pakistan cities. It is undoubted that our working results will provide the timely and cost-effective information to policymakers, Govt Officials and citizens for more sustainable urbanization.
Introduction
Urbanization is a continuous and dynamic progression remaining a number of people in relatively small areas. This is the process derived through population growth, while population is increasing dramatically from several decades mainly due to migration, urbanization and rushing change in fertility rates raising the need of Urban planning (Citation2021). Urban sprawl creates lots of socio-economic and environmental related challenges both positive and negative (Omwenga Citation2010). Recently, 50% of the world’s population are living in urban areas. This number is expected to be more than a billion by 2025 (Foley et al. Citation2005). Accelerated, poorly managed urbanization leads to inefficient resources and extensive scale agricultural lands deterioration in addition to atmospheric, land and water pollution (Hove, Ngwerume, and Muchemwa Citation2013). Such an increase is a major challenge to low- and middle-income countries in managing population growth and urban sprawl (Pauleit et al. Citation2010).
Frequently unplanned urbanization and fast-growing population struggle to maintain its multisource spatial data, and lack to monitor and understand the city morphology particularly in low- and middle-income countries. On the other hand, spatial information on population growth and urban sprawl has become indispensable for planning and management, and RS & GIS play important role (Lu et al. Citation2019). Conventional methods, such as population census statistics, to quantify urban sprawl are time-consuming. Cost effect cannot be efficacious tools for measuring the urban scenarios. Thus, there is an urgent task to analyse population growth and urbanization spatially, so as to develop integrating plans and mitigating measures.
In this study, supervised pixel-based categorization of remotely sensed images was carried out using Smile (CART) algorithms. The best input image for classification was chosen using a procedure that included band composition, statistical operators, seasonal composition strategies and derived class information (Praticò et al. Citation2021). The study’s primary goal is to identify decisions made about land use, land cover and land management so that it can assess growth policies and their repercussions in Istanbul (Dereli et al. Citation2017).
To develop sustainable cities, understanding based on the in-depth analysis, freely available open-source datasets, imagery, big data analytics with geospatial, and remote-sensing technology offers a huge opportunity to improve the city structure in terms of area expansion and urban growth analysis by helping the government officials and urban planners. Remote sensing is one recognized approach to better characterize and identify major classes of land use and land cover (LULC) and Google Earth Engine (GEE) is used as cloud computation platform (Hashem and Balakrishnan Citation2015; Lu et al. Citation2020). Whereas GIS is a smart tool to integrate and analyse spatial information temporally with its applications to planning and managing urban growth patterns (Lu et al. Citation2019). Rapid population increase, economic development and infrastructure development activities have clearly resulted in the expansion of cities. For sustainable cities, it is essential to monitor and foresee urban growth in terms of settlement planning, transit, landscaping, etc. Currently, geographic information system (GIS) techniques and remote-sensing data, particularly satellite data, allow us to obtain the required data with high spatial, spectral and temporal resolution. The purpose of this study is to identify the land use and land cover (LULC) with the help of freely available data sources (Dereli Citation2018).
By exploring the potential of freely available datasets to understand the spatially heterogeneous landscape dynamics of city, substantially this study is aimed to analyse the urbanization and population growth spatially in four major cities in Pakistan. Landuse distribution and spatial growth pattern with population density dynamically in four cities are explored using different sensor data and high resolution imageries. Certainly, this study is valuable for conducting cost-effective planning in middle-income and rapidly urbanizing cities (Mahboob, Atif, and Iqbal Citation2017).
Materials and methods
Study area
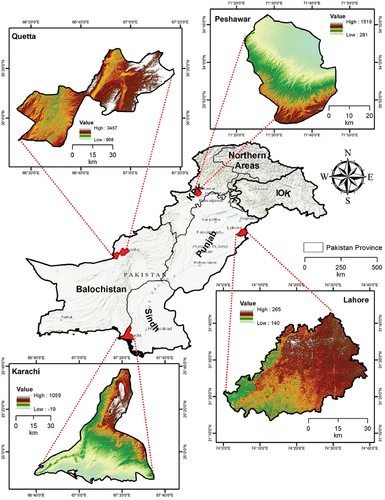
To explore the potential of open-source datasets and tools (refer ), we selected four major provincial capital cities of Pakistan, which are evenly distributed over the whole Pakistan. These cities are rapidly growing urbanizing cities of Pakistan, (Karachi, Lahore, Peshawar and Quetta) (Hamza et al. Citation2021). These four cities are located in different locations in Pakistan but basic urban growth factors are common. We constructed the mathematical model of urban growth from 1990 to 2020 using publicly available data and Landsat images, and visually explored city expansion using Google Earth Engine.
Figure 1. Geographical Representation of Study area (Cities location) (Pakistan Citation2022).
Materials and methods
Driven by various human activities and economic factors, urbanization became a trend in province capitals. These cities, being province capitals, also ranked largest cities in their own provinces, and faces urbanization and various city problems. The past studies related to urban sprawl are theoretical widely in published papers. In this study, GIS and remote-sensing techniques were comprehensively used for change detection and directional aspects of urban growth for a duration of four decades, years starting from 1990 to 2020. It is noteworthy that cloud computation in the Google Earth Engine is carried out to map the most recent and previous urban sprawl extent for the Karachi, Lahore, Peshawar and Quetta Cities (1990, 2000, 2010 and 2020). Data are classified into land cover types with the GEE cloud computation (Lu et al. Citation2020; Xian, Crane, and McMahon Citation2008).
Datasets and sources
In this study, Landsat 5 TM (Thematic Mapper) and Landsat 8 OLI (Operational Land Imager) satellite imagery of 30-metre spatial resolution and population density dataset of LandScan have been used. The satellite imagery has been acquired form USGS (United States Geological Survey) for land cover assessment. We use the datasets and sources as shown in .
Table 1. Datasets and Sources.
Conversion to top of atmosphere (TOA) radiance
We conducted images supervised classification of Landsat I MSS sensor, Landsat V TM sensor, Landsat VII ETM sensors with assistance of Landsat VII and Landsat VIII (Operational Land Imager) sensors real-time raw scenes data. The Landsat satellites are running in polar orbits, and scanning the experimental cities with a repetition overpass of every 16 days. However, for pixel value, digital number (DN) exists originally. These values are measured with the sensor and are integral results of energy transmission along the path of observed objects to satellite sensors. Digital number (DN) are essentially related to the surface reflectance values. Landsat data were converted into Top of Atmosphere (TOA) radiance by rescaling raster image. Conversion to TOA radiance was performed as follows (Baqa et al. Citation2021):
Lλ is representing TOA radiance, ML is known as multiplicative rescaling factor, AL as additive rescaling factor, Qcal is known as the pixel value or digital number (DN).
Conversion to land surface reflectance
With the support of numerical weather forecast data, such NCEP grid data, atmospheric correction is done. As a result, land surface radiance and further land surface reflectance are obtained. Land surface reflectance is considered as the spectral property of land surface, which is used together with other properties to make LULC classification.
Extraction of urban extent and accuracy assessment
Classification of temporal Landsat imagery was performed on the set of pixels. GEE offers several classification algorithms, here Smile CART algorithm was used for supervised classification and further calculating urban extent of these four cities. The temporal images of Landsat TM 5 and Landsat 8 OLI were acquired to compute the urban extent after classification on the google earth engine platform. Training samples, test samples and validation samples were collected independently. For the Smile CART classifier, we collected distinct training sample for each class each year. From 1990 to 2020 each year, 30 sample points have been collected for each class in order to determine the accurate change in LULC class (Tariq et al. Citation2023). Comparing classification results to another reference dataset (or higher-resolution imagery) is an essential component of accuracy assessment. In this study, the accuracy of the classification results was evaluated as compared to ground truth sample points (Tariq and Mumtaz Citation2022). All points were selected at random from categorized imagery and are validated using GEE in 1990, 2000, 2010 and 2020. In particular, we employed 70% of sample points for classification testing and the remaining 30% for classification validation. We specify the system of categories including: 1) Built up, 2) Water body, 3) Barren land and 4) Vegetation (refer ) (Pijanowski et al. Citation2005). Through image classification, classification results of four different years are obtained. The results of classified LULC and calculated spatial extents are summarized in and (Inostroza et al. Citation2019). In addition to identifying changes taken place, the monitoring analysis of LULC is carried out for discovering spatial pattern, areal extent and characteristics. displays the results of the four cities’ 1990–2020 LULC classifications. The accuracy evaluation is given by Kappa coefficient of 0.91 and overall accuracy of 0.93 (Tariq, Yan, and Mumtaz Citation2022; Kafi, Shafri, and Shariff Citation2014).
Figure 2. Spatial Distribution of LULC (Pakistan Citation2022; Qu et al. Citation2021; Chander, Markham, and Helder Citation2009).
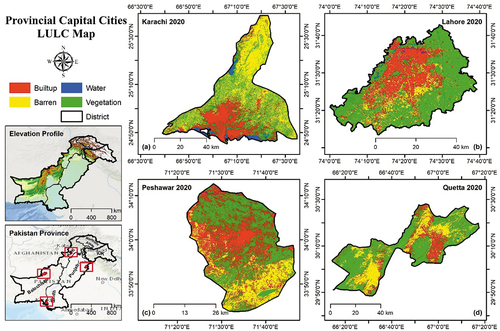
Figure 3. Spatial distribution of urban growth pattern over the period of 1990–2020 (Qu et al. Citation2021; Chander, Markham, and Helder Citation2009).
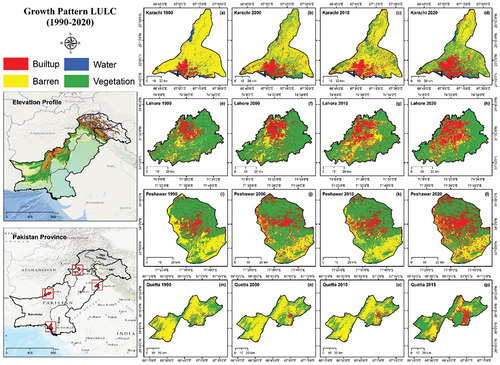
Table 2. Accuracy assessment results for land use land cover in GEE.
Supervised classification of maximum likelihood algorithm was performed for further LULC mapping. Landsat Image and low-level data products, Subset of Area of Interest, and Sampling are prepared. Then, the classification of nearest neighbour algorithm produces a number of land cover classes, such as built-up, vegetation, barren land and water body. In this way, the four-phase images have been classified with reference to the same set of category for urban sprawl estimation (Firozjaei et al. Citation2018). The results of classification showed immense increase in the built-up area of these major cities (Guan et al. Citation2011). The spatial distribution of LULC classes is shown in and the growth change calculation is shown in .
Table 3. Spatial Distribution of land use land cover and areas (sq.Km).
Table 4. Change in Land use Land cover area in percentage (Citation2021).
The results of show highest increase in area and change rate percentage during 2000–2019. Whereas some changes have been seen during 2000–2010.
The quality of GEE analysis results has been evaluated with classification accuracy. Accuracy assessment is the important part of any data classification, in which it compared with another reference dataset or higher resolution imagery (Mondal, Das, and Dolui Citation2015; Maithani Citation2009). In this study, we have used the ground truth sample points for accuracy assessment of classification results. In particular, we have used 70% sample points for classification test and other 30% sample points for ground truth validation. In summary, we observed that the overall classification accuracy is 93% for our observed classes (water body, barren land, built-up, and vegetation) as shown in (Lu et al. Citation2015; Liu et al. Citation2016).
Change detection
Change detection can be determined on the basis of:
Spectral classification of satellite images,
Vectors of radiometric changes and
The band-specific spectral differences with algebraic calculations.
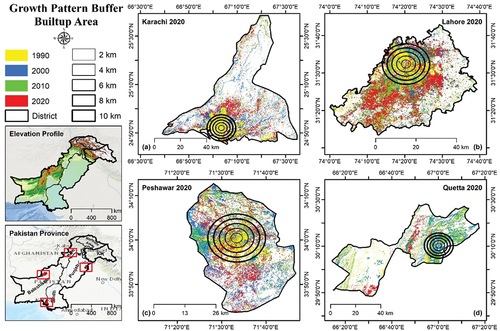
Amongst the widely used set of techniques, the hybrid approach was used for the evaluation of change detection (Shawul and Chakma Citation2019). However, the selection of the technique depends upon many factors, like data availability, data quality and the constraints of time and cost. Through investigation, here we used the radiometric change vector-conversion approach to mapping the built-up extent over four decades (refer ) (Mahar et al. Citation2020).
Results and discussions
Abnormal growth has been identified due to rapid population growth. Population growth act as a catalyst in escalating the urban sprawl. Urban sprawl is complex to precisely calculate and define (Bihamta et al. Citation2015). The urban areas as well as the fringes also effected by the sprawl. For the estimation of urban sprawl, many quantitative studies have been carried out. Integratively using GIS and RS techniques, the temporal analysis and change detection in data domain, together with sprawl analysis and growth analysis in application domain, has been carried out for high-precision results (Dadashpoor and Nateghi Citation2017). The LULC results over the years of 1990, 2000, 2010 and 2020 show that the study area has undergone various changes (Tariq and Shu Citation2020; Kumar, Radhakrishnan, and Mathew Citation2014).
Moreover, the built-up area is increasing over the time of 30 years. During 1990–2020, the built-up area of Karachi is increased 491 Sq. Km, Lahore increased 156 Sq. Km, Peshawar Increased 160 Sq. Km and Quetta increased 356 Sq. Km. We can clearly see the increase in built-up (Mas et al. Citation2014).
Sprawl analysis
Urban planning and urban decision making at the right time is very necessary for living quality, infrastructures, and better services. The hasty increase in the urban sprawl affects agricultural lands and living standards, and leads to the lack of services in the area (Ahmed, Lu, and Ye Citation2008; SHAIKH and GOTOH Citation2006).
The Sprawl analysis of Karachi shows that the built-up is spreading in north and east direction rapidly over agricultural lands for the past few decades. In Lahore, the built-up is increasing in south and east-south direction. In Peshawar, it is increasing in east and west direction, and in Quetta, it is increasing in the north and west-north direction. As the time passes, the sprawl was developing along the road sides linearly (D’Acci Citation2019). Most of the linear patterns of development take place during 2000–2020 (refer ). The sprawl in Lahore is in south direction, which was observed with limited main roads and highways (Schetke et al. Citation2016). Apparently, spatial planning and timely decision making are needed to control the haphazard growth. Predictably, if the same tendency in urban sprawl continues, these cities will expand abnormally and rapidly than before (Rimal et al. Citation2018).
Figure 4. Urbanization in 1990, 2000, 2010, and 2020 (Chander, Markham, and Helder Citation2009). .
Urban sprawl vs population growth
For population density, satellite image-generated LandScan population dataset has been used. The population density over the years of 2000 to 2019 has been calculated through LandScan data (Xian, Crane, and McMahon Citation2008; Rose et al. Citation2020). Also Census details of 1990 and 2017 have been integrated with the LandScan dataset for precise calculations and verification of population density. It is worth mentioning that the LandScan estimation of Population and the Census-based data of these four cities is providing a best match (96.4% accuracy) of population with the Population Census of Pakistan (Jokar Arsanjani et al. Citation2013; Batty Citation2005). The results indicate that, during the period of 2000–2019, the population is escalating in Karachi at the rate of 4.8% per annum, in Lahore at the rate of 3.3% per annum, in Peshawar at the rate of 3.5% per annum and in Quetta at the rate of 5.6% per annum according to the LandScan data. The population density mapping over the years of 2000 and 2019 is shown in also represented in . The census record is helpful for calculating the 1990 growth rate and population density (Sharma and Joshi Citation2013). (Bununu Citation2017).
Figure 5. LandScan population density of 2000 to 2019 (Rose et al. Citation2020).
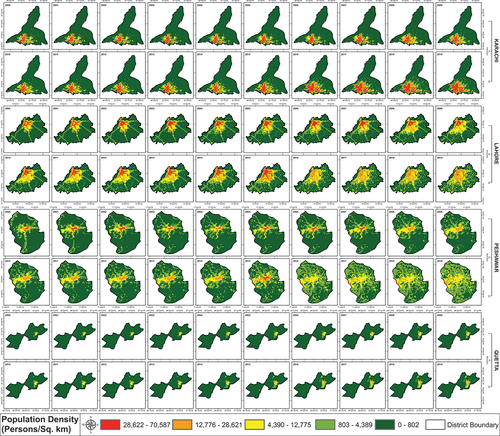
Table 5. Population Growth Pattern from LandScan data 2000–2019 (Rose et al. Citation2020).
Our working methodology was based on change detection, spatial pattern and continuity analysis, and statistical analysis at the grid/cell level. Our findings show that LandScan dataset can be used to accurately estimate the Pakistan population (Calka and Bielecka Citation2019). According to recent studies, LandScan performs the best in terms of spatial accuracy and estimated errors (Yin et al. Citation2021). These results determined that the population is increased highly during 2000–2019 in all four cities (refer ). The concentrated areas of population are those areas where built-up vales are noticed higher and changed. From the above analysis, the existing growth pattern is recognized as linear pattern due to high values change in population density and increased in built-up. However, the future pattern of growth will not be depicted because it largely depends on population density, which is directly or indirectly depended on infrastructure development and creation of services (Bright and Coleman Citation2001; Rose et al. Citation2020).
Table 6. Built-up Area increased in each city with population growth (Citation2021; Rose et al. Citation2020).
Correlation of urban sprawl and population growth
Pakistan has witnessed a massive rural-urban migration trend over the last three decades. Technically, we have made population statistics of LandScan/Census data, and urban growth estimation based on satellite image classification of LULC. Then, we made a correlational analysis of population increase and urban growth, and a lot of useful results are obtained (refer ). Over the last three decades of rapid urbanization, Pakistan cities have lost much agricultural land (farmland) as well as vegetation.
Figure 6. Correlation between LandScan population and Urban Expansion during the time period of 1990 to 2020 (Rose et al. Citation2020; Citation2021).
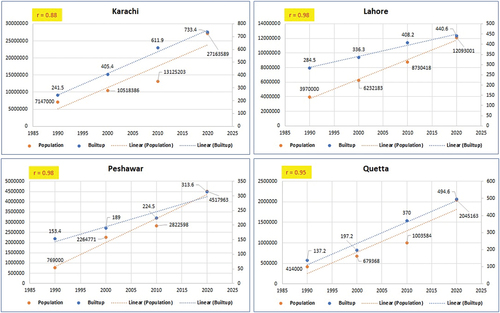
Besides, the relationship between urban sprawl and population change has addressed the issue of energy resources meeting social needs (Mahtta et al. Citation2022). Moreover, the complex relationship between urban sprawl and population change is central to urban sustainable development research (Wang Citation2021). The spatial growth rate and urban compactness index of four cities were calculated out of land use and population data during the time periods of 1990, 2000, 2010 and 2020. The urban growth characteristics, changing population density and their relationship in the four cities were investigated during these four periods (Guo and Wang Citation2022). In general, there exists a strong positive correlation between population growth and urban expansion. In particular, there are Pearson’s r of Karachi 0.88, Lahore 0.98, Peshawar 0.98 and Quetta 0.95 during the time period of 1990 to 2020 (Shang et al. Citation2018).
Concluding remarks
Using Open-Source Data (Landsat images and LandScan data), this study has offered a technical solution of Google Earth Engine-supported analysis of statistics and machine learning to spatially monitoring the population change and urban growth of four major Pakistan cities.
Some substantial findings are obtained. Subsequently, over the last four decades of 1990 to 2020, the built-up area of Karachi has been increased from 241.5 Sq.km to 733.4 Sq.km, whereas 158.2% total population growth rate increased from 2000 to 2019. For Lahore, 284.5 Sq.km to 440.6 Sq.km, whereas 94.0% total population growth rate increased. For Peshawar, 153.3 Sq.km to 313.5 Sq.km, whereas 99.4% total population growth rate increased and for Quetta 137.2 Sq.km to 494.5 Sq.km, whereas 201.0% total population growth rate has increased. The results also correlated with Pearson’s r of Karachi 0.88, Lahore 0.98, Peshawar 0.98 and Quetta 0.95. Between 1990 and 2020 and there is a positive correlation between population growth and urban expansion.
The increase of population and built-up area leads to the decrease of agricultural lands and the shortage of basic services in future. There is a dire need of spatial planning for the high quality of citizen living and the sustainability of urban growth. If timely actions not being taken, as the urban sprawl going in abnormal mode, it will bring side effects to agricultural land utilization and regional economy development.
Author contributions
RWA.: Conceptualization; methodology; software; validation, formal analysis; investigation; HS and RWA.: resources; RWA, AY and HS.: data curation; RWA; writing original draft preparation.; RWA, HS, and AY.: writing review and editing; visualization, RWA.; supervision, HS; project administration, HS.; funding acquisition, HS. All authors have read and agreed to the published version of the manuscript.
Disclosure statement
No potential conflict of interest was reported by the author(s).
Data availability statement
Data will be available upon request to the corresponding author.
Additional information
Funding
References
- Ahmed, Q. I., H. Lu, and S. Ye. 2008. “Urban Transportation and Equity: A Case Study of Beijing and Karachi.” Transportation Research Part A: Policy and Practice 42 (1): 125–139. doi:10.1016/j.tra.2007.06.004.
- Baqa, M. F., F. Chen, L. Lu, S. Qureshi, A. Tariq, S. Wang, L. Jing, S. Hamza, and Q. Li. 2021. “Monitoring and Modeling the Patterns and Trends of Urban Growth Using Urban Sprawl Matrix and CA-Markov Model: A Case Study of Karachi, Pakistan.” Land 10 (7): 700. doi:10.3390/land10070700.
- Batty, M. A. 2005. “Cells, and Cities: New Representational Models for Simulating Multiscale Urban Dynamics.” Environment and Planning A: Economy and Space 37 (8): 1373–1394. doi:10.1068/a3784.
- Bihamta, N., A. Soffianian, S. Fakheran, and M. Gholamalifard. 2015. “Using the SLEUTH Urban Growth Model to Simulate Future Urban Expansion of the Isfahan Metropolitan Area, Iran.” Journal of the Indian Society of Remote Sensing 43 (2): 407–414. doi:10.1007/s12524-014-0402-8.
- Bright, E. A.; P. R. Coleman LandScan 2000 2001.
- Bununu, Y. A. 2017. “Integration of Markov Chain Analysis and Similarity-Weighted Instance-Based Machine Learning Algorithm (SimWeight) to Simulate Urban Expansion.” International Journal of Urban Sciences 21 (2): 217–237. doi:10.1080/12265934.2017.1284607.
- Calka, B., and E. Bielecka. 2019. “Reliability Analysis of LandScan Gridded Population Data. The Case Study of Poland.” ISPRS International Journal of Geo-Information 8 (5): 222. doi:10.3390/ijgi8050222.
- Chander, G., B. L. Markham, and D. L. Helder. 2009. “Summary of Current Radiometric Calibration Coefficients for Landsat MSS, TM, ETM+, and EO-1 ALI Sensors.” Remote sensing of environment 113 (5): 893–903. doi:10.1016/j.rse.2009.01.007.
- D’Acci, L. 2019. “A New Type of Cities for Liveable Futures. Isobenefit Urbanism Morphogenesis.” Journal of environmental management 246: 128–140. doi:10.1016/j.jenvman.2019.05.129.
- Dadashpoor, H., and M. Nateghi. 2017. “Simulating Spatial Pattern of Urban Growth Using GIS-Based SLEUTH Model: A Case Study of Eastern Corridor of Tehran Metropolitan Region, Iran.” Environment, Development and Sustainability 19 (2): 527–547. doi:10.1007/s10668-015-9744-9.
- Dereli, M. 2018. “Monitoring and Prediction of Urban Expansion Using Multilayer Perceptron Neural Network by Remote Sensing and GIS Technologies: A Case Study from Istanbul Metropolitan City.” Fresenius Environmental Bull 27: 9337–9344.
- Dereli, M.; M. Uğur; N. Polat; M. Yalçın Spatio-Temporal Analysis of Urban Expansion Using Remote Sensing Data; 2017;
- Firozjaei, M. K., M. Kiavarz, S. K. Alavipanah, T. Lakes, and S. Qureshi. 2018. “Monitoring and Forecasting Heat Island Intensity Through Multi-Temporal Image Analysis and Cellular Automata-Markov Chain Modelling: A Case of Babol City, Iran.” Ecological indicators 91: 155–170. doi:10.1016/j.ecolind.2018.03.052.
- Foley, J. A., R. DeFries, G. P. Asner, C. Barford, G. Bonan, S. R. Carpenter, F. S. Chapin, et al. 2005. “Global Consequences of Land Use.” Science (80-) 309 (5734): 570–574. doi:10.1126/science.1111772.
- Government of Pakistan. Pakistan Bureau of Statistics Available online: https://www.pbs.gov.pk/(accessed on Nov 13, 2021).
- Guan, D., H. Li, T. Inohae, W. Su, T. Nagaie, and K. Hokao. 2011. “Modeling Urban Land Use Change by the Integration of Cellular Automaton and Markov Model.” Ecological modelling 222 (20–22): 3761–3772. doi:10.1016/j.ecolmodel.2011.09.009.
- Guo, M., and S. Wang. 2022. “Research on Urban Expansion and Population Density Change of an Urban Agglomeration in the Central-Southern Region of Liaoning Province, China.” Complexity 2022: 1–13. doi:10.1155/2022/5327023.
- Hamza, S., I. Khan, L. Lu, H. Liu, F. Burke, S. Nawaz-Ul-Huda, M. F. Baqa, and A. Tariq. 2021. “The Relationship Between Neighborhood Characteristics and Homicide in Karachi, Pakistan.” Sustainability 13 (10): 5520. doi:10.3390/su13105520.
- Hashem, N., and P. Balakrishnan. 2015. “Change Analysis of Land Use/Land Cover and Modelling Urban Growth in Greater Doha, Qatar.” Annals of GIS 21 (3): 233–247. doi:10.1080/19475683.2014.992369.
- Hove, M., E. T. Ngwerume, and C. Muchemwa. 2013. “The Urban Crisis in Sub-Saharan Africa: A Threat to Human Security and Sustainable Development.” Stability: International Journal of Security and Development 2 (1): 7. doi:10.5334/sta.ap.
- Inostroza, L., Z. Hamstead, M. Spyra, and S. Qureshi. 2019. “Beyond Urban–Rural Dichotomies: Measuring Urbanisation Degrees in Central European Landscapes Using the Technomass as an Explicit Indicator.” Ecological indicators 96: 466–476. doi:10.1016/j.ecolind.2018.09.028.
- Jokar Arsanjani, J., M. Helbich, W. Kainz, and A. Darvishi Boloorani. 2013. “Integration of Logistic Regression, Markov Chain and Cellular Automata Models to Simulate Urban Expansion.” International Journal of Applied Earth Observation and Geoinformation 21: 265–275. doi:10.1016/j.jag.2011.12.014.
- Kafi, K. M., H. Z. M. Shafri, and A. B. M. Shariff. 2014. “An Analysis of LULC Change Detection Using Remotely Sensed Data; a Case Study of Bauchi City.” IOP Conference Series: Earth and Environmental Science 20: 012056. doi:10.1088/1755-1315/20/1/012056.
- Kumar, S., N. Radhakrishnan, and S. Mathew. 2014. “Land Use Change Modelling Using a Markov Model and Remote Sensing.” Geomatics, Natural Hazards and Risk 5 (2): 145–156. doi:10.1080/19475705.2013.795502.
- Liu, Y., Q. He, R. Tan, Y. Liu, and C. Yin. 2016. “Modeling Different Urban Growth Patterns Based on the Evolution of Urban Form: A Case Study from Huangpi, Central China.” Applied Geography 66: 109–118. doi:10.1016/j.apgeog.2015.11.012.
- Lu, L., H. Guo, C. Corbane, and Q. Li. 2019. “Urban Sprawl in Provincial Capital Cities in China: Evidence from Multi-Temporal Urban Land Products Using Landsat Data.” Science Bulletin 64 (14): 955–957. doi:10.1016/j.scib.2019.04.036.
- Lu, L., C. Kuenzer, C. Wang, H. Guo, and Q. Li. 2015. “Evaluation of Three MODIS-Derived Vegetation Index Time Series for Dryland Vegetation Dynamics Monitoring.” Remote Sensing 7 (6): 7597–7614. doi:10.3390/rs70607597.
- Lu, L., Q. Weng, H. Guo, S. Feng, and Q. Li. 2019. “Assessment of Urban Environmental Change Using Multi-Source Remote Sensing Time Series (2000–2016): A Comparative Analysis in Selected Megacities in Eurasia.” The Science of the Total Environment 684: 567–577. doi:10.1016/j.scitotenv.2019.05.344.
- Lu, L., Q. Weng, D. Xiao, H. Guo, Q. Li, and W. Hui. 2020. “Spatiotemporal Variation of Surface Urban Heat Islands in Relation to Land Cover Composition and Configuration: A Multi-Scale Case Study of Xi’an, China.” Remote Sensing 12 (17): 2713. doi:10.3390/rs12172713.
- Mahar, G. A., B. Hussain, R. A. Wagan, A. T. Hussain, and S. H. Khan. 2020. “Remote Sensing (RS) Monitoring of Mangroves Plantation Against the Guinness World Record (GWR) of Maximum Plantation in Indus Delta.” Pakistan Journal BotPakistan Journal of Botany 52 (4). doi:10.30848/PJB2020-4(16).
- Mahboob, M. A., I. Atif, and J. Iqbal. 2017. “Remote Sensing and GIS Applications for Assessment of Urban Sprawl in Karachi, Pakistan.” Science, Technology and Development 34 (3): 179–188. doi:10.3923/std.2015.179.188.
- Mahtta, R., M. Fragkias, B. Güneralp, A. Mahendra, M. Reba, E. A. Wentz, and K. C. Seto. 2022. “Urban Land Expansion: The Role of Population and Economic Growth for 300+ Cities.” npj Urban Sustainability 2 (1): 5. doi:10.1038/s42949-022-00048-y.
- Maithani, S. 2009. “A Neural Network Based Urban Growth Model of an Indian City.” Journal of the Indian Society of Remote Sensing 37 (3): 363–376. doi:10.1007/s12524-009-0041-7.
- Mas, J. -F., M. Kolb, M. Paegelow, M. T. Camacho Olmedo, and T. Houet. 2014. “Inductive Pattern-Based Land Use/Cover Change Models: A Comparison of Four Software Packages.” Environmental Modelling & Software 51: 94–111. doi:10.1016/j.envsoft.2013.09.010.
- Mondal, B., D. N. Das, and G. Dolui. 2015. “Modeling Spatial Variation of Explanatory Factors of Urban Expansion of Kolkata: A Geographically Weighted Regression Approach.” Modeling Earth Systems and Environment 1 (4): 29. doi:10.1007/s40808-015-0026-1.
- Omwenga, M. Nairobi-Emerging Metropolitan Region: Development Planning and Management Opportunities and Challenges. In Proceedings of the Nairobi Metropolitan Region; 46th ISOCARP Congress 2010, Kenya. 2010; pp. 1–5.
- Pakistan, G. Political Map of Pakistan Available online: http://surveyofpakistan.gov.pk/(accessed on Jul 3, 2022).
- Pauleit, S., J. Breuste, S. Qureshi, and M. Sauerwein. 2010. “Transformation of Rural-Urban Cultural Landscapes in Europe: Integrating Approaches from Ecological, Socio-Economic and Planning Perspectives.” Landscape Online 20: 1–10. doi:10.3097/LO.201020.
- Pijanowski, B. C., S. Pithadia, B. A. Shellito, and K. Alexandridis. 2005. “Calibrating a Neural Network‐based Urban Change Model for Two Metropolitan Areas of the Upper Midwest of the United States.” International Journal of Geographical Information Science 19 (2): 197–215. doi:10.1080/13658810410001713416.
- Praticò, S., F. Solano, S. Di Fazio, and G. Modica. 2021. “Machine Learning Classification of Mediterranean Forest Habitats in Google Earth Engine Based on Seasonal Sentinel-2 Time-Series and Input Image Composition Optimisation.” Remote Sensing 13 (4): 586. doi:10.3390/rs13040586.
- Qu, L., Z. Chen, M. Li, J. Zhi, and H. Wang. 2021. “Accuracy Improvements to Pixel-Based and Object-Based LULC Classification with Auxiliary Datasets from Google Earth Engine.” Remote Sensing 13 (3): 453. doi:10.3390/rs13030453.
- Rimal, B., L. Zhang, H. Keshtkar, B. Haack, S. Rijal, and P. Zhang. 2018. “Land Use/Land Cover Dynamics and Modeling of Urban Land Expansion by the Integration of Cellular Automata and Markov Chain.” ISPRS International Journal of Geo-Information 7 (4): 154. doi:10.3390/ijgi7040154.
- Rose, A. N.; J. J. McKee; K. M. Sims; E. A. Bright; A. E. Reith; M. L. Urban LandScan 2019 2020.
- Schetke, S., S. Qureshi, S. Lautenbach, and N. Kabisch. 2016. “What Determines the Use of Urban Green Spaces in Highly Urbanized Areas? – Examples from Two Fast Growing Asian Cities.” Urban Forestry & Urban Greening 16: 150–159. doi:10.1016/j.ufug.2016.02.009.
- Shaikh, A. A., and K. Gotoh. 2006. “A Satellite Remote Sensing Evaluation of Urban Land Cover Changes and Its Associated Impacts on Water Resources in Karachi, Pakistan.” Journal of the Japan Society of Photogrammetry and Remote Sensing 45 (6): 41–55. doi:10.4287/jsprs.45.6_41.
- Shang, J., P. Li, L. Li, and Y. Chen. 2018. “The Relationship Between Population Growth and Capital Allocation in Urbanization.” Technological Forecasting and Social Change 135: 249–256. doi:10.1016/j.techfore.2018.04.013.
- Sharma, R., and P. K. Joshi. 2013. “Monitoring Urban Landscape Dynamics Over Delhi (India) Using Remote Sensing (1998–2011) Inputs.” Journal of the Indian Society of Remote Sensing 41 (3): 641–650. doi:10.1007/s12524-012-0248-x.
- Shawul, A. A., and S. Chakma. 2019. “Spatiotemporal Detection of Land Use/Land Cover Change in the Large Basin Using Integrated Approaches of Remote Sensing and GIS in the Upper Awash Basin, Ethiopia.” Environmental Earth Sciences 78 (5): 141. doi:10.1007/s12665-019-8154-y.
- Tariq, A., and F. Mumtaz. 2022. “Modeling Spatio-Temporal Assessment of Land Use Land Cover of Lahore and Its Impact on Land Surface Temperature Using Multi-Spectral Remote Sensing Data.” Environmental Science and Pollution Research. doi:10.1007/s11356-022-23928-3.
- Tariq, A., F. Mumtaz, M. Majeed, and X. Zeng. 2023. “Spatio-Temporal Assessment of Land Use Land Cover Based on Trajectories and Cellular Automata Markov Modelling and Its Impact on Land Surface Temperature of Lahore District Pakistan.” Environmental Monitoring and Assessment 195 (1): 114. doi:10.1007/s10661-022-10738-w.
- Tariq, A., and H. Shu. 2020. “CA-Markov Chain Analysis of Seasonal Land Surface Temperature and Land Use Land Cover Change Using Optical Multi-Temporal Satellite Data of Faisalabad, Pakistan.” Remote SensRemote Sensing 12 (20): 3402. doi:10.3390/rs12203402.
- Tariq, A., J. Yan, and F. Mumtaz. 2022. “Land Change Modeler and CA-Markov Chain Analysis for Land Use Land Cover Change Using Satellite Data of Peshawar, Pakistan.” Physics and Chemistry of the Earth, Parts A/B/C 128: 103286. doi:10.1016/j.pce.2022.103286.
- United Nations Population Fund, UNFPA. Available online: http://goo.gl/NNoUex (accessed on Nov 14, 2021).
- Wang, X. 2021. “Relationship Between Population Urbanization and Urban Sprawl Across Different City Sizes in China.” Environment and Urbanization ASIA 12 (2): 202–219. doi:10.1177/09754253211040196.
- Xian, G., M. Crane, and C. McMahon. 2008. “Quantifying Multi-Temporal Urban Development Characteristics in Las Vegas from Landsat and ASTER Data.” Photogrammetric Engineering & Remote Sensing 74 (4): 473–481. doi:10.14358/PERS.74.4.473.
- Yin, X., P. Li, Z. Feng, Y. Yang, Z. You, and C. Xiao. 2021. “Which Gridded Population Data Product is Better? Evidences from Mainland Southeast Asia (MSEA).” ISPRS International Journal of Geo-Information 10 (10): 681. doi:10.3390/ijgi10100681.