
ABSTRACT
This paper explores the use of digital footprints data to improve on the limited information available on the size and distribution of the residential housing stock in the United Kingdom over the past two decades. We use a subset of a large dataset consisting of the names and addresses of more than one billion individuals dating back to 1997 (LCRs: Linked Consumer Registers) to calibrate property lifecycle information within an authoritative geolocated address and property dataset. We validate the results of our novel calibration method against official estimates by the UK government covering the same period. We further show that our calibration method, based on individual level data, captures a much larger share of the residential housing stock since 1997 than would have been possible with other available data sources. We argue that these housing stock estimates are fundamental to the development of a comprehensive digital footprints data infrastructure that has the potential to significantly enhance population, migration, and other social statistics in the UK. More generally, this study highlights the benefits of using digital footprints data in refining, calibrating, and extending existing datasets.
1. Background
Geographic details are inevitably lost when individual characteristics and built environment attributes are aggregated across areas. Geographic aggregation is the most common form of disclosure control for population data, yet resultant problems of potential ecological fallacy compromise all subsequent analysis (Openshaw Citation1984). As such, reliable geolocated estimates of individual properties and the characteristics of their occupiers are indispensable for obtaining insights into socio-demographic processes at small geographic scales. Previous studies have sought to address these challenges by leveraging digital footprints data (or smart data) – digital data traces created through people’s interactions with consumer-facing organizations (UK Research and Innovation Citation2023). An example of these in the UK is the Linked Consumer Registers (LCRs). These LCRs have been created by re-purposing large lists of individual names and the addresses at which these individuals reside, derived from annually updated electoral registrations and consumer data. These address data have subsequently been geocoded and linked to create a granular UK-wide spatial population dataset, comprising 60–95% of all adults in any given year between 1997 and 2022 (see Lansley, Wen, and Longley Citation2019; Van Dijk and Longley Citation2021; Van Dijk, Lansley, and Longley Citation2021).
The strength of the LCRs lies in their ability to provide a comprehensive time series of observed individuals at specific addresses over time. The granularity of the dataset has proven useful for a wide range of applications, which includes charting processes of demographic change within an inter-generational context (Kandt, Van Dijk, and Longley Citation2020), mapping ethnic segregation (Lan and Longley Citation2022; Lan, Kandt, and Longley Citation2020), modelling patterns of residential mobility (Van Dijk, Lansley, and Longley Citation2021), and quantifying gentrification following redevelopment of social housing estates in London (Reades et al. Citation2022). However, whilst the LCRs capture the large majority of the adult population of the UK, especially in more recent years, not all individuals are captured. One way to improve on the LCRs’ estimates is by integrating microsimulation methods to augment the observational digital footprint data with synthetic observations (see Lomax et al. Citation2022; Wu et al. Citation2022 for recent applications of microsimulation in the UK). Augmenting observational data with synthetic individuals holds potential not only for understanding demographic processes in the UK since 1997 but would also serve as a basis for predicting future population composition and change.
Where augmenting observed population data with synthetic population data hold great promise to improve population statistics, one of the greatest challenges in the UK is the absence of a definitive and exhaustive time-stamped list of residential properties that can be used to identify missing individuals or empty households over time. Official address products, such as those maintained by Royal Mail (Royal Mail Citation2022) and Ordnance Survey (Ordnance Survey Citation2022), primarily focus on keeping their address and property datasets up to date and are less concerned with collecting historic lifecycle information on individual properties. This paper aims to address the historical limitations of these datasets by calibrating them with address data extracted from the LCRs to determine extant properties for every year between 1997 and 2022. The justification for this approach is that if an individual is registered at a certain address in the electoral register in a particular year, the address must have been part of the ‘active’ housing stock at that point in time. We can leverage this information to derive annualized residential building stock estimates for the same period that is covered by the LCRs.
In the following sections, we start by providing an overview of the process of linking addresses from the LCRs to the authoritative Ordnance Survey address product. Subsequently, we outline our methodology for estimating the ‘start’ and ‘end’ dates of individual properties. We then compare the results of our methodology with aggregate government estimates on the size of the residential housing stock. We also assess the completeness of our results using the LCRs by comparing them to results obtained from alternative administrative and consumer data sources. Finally, we discuss how this work lays the groundwork for the development of an individual-level digital footprints data infrastructure.
2. Address matching with authoritative address databases
The accepted practice of linking and curating address-level data such as those derived from administrative and consumer sources is by linking these data to official address products (Lansley, Wen, and Longley Citation2019). In the UK, two such authoritative address products exist. First, the Postcode Address File (PAF) (Royal Mail Citation2022) is maintained by Royal Mail for the purpose of facilitating mail and package deliveries around the country. It purports to be the most up-to-date address database available and currently encompasses more than 30 million postal delivery addresses. Second, there is Ordnance Survey’s AddressBase product range, including the flagship AddressBase Premium (ABP) product (Ordnance Survey Citation2022). The dataset combines Royal Mail’s delivery addresses with additional information collected from Local Authorities and other sources. The key distinction between these two products is that Royal Mail’s dataset is only concerned with current active addresses for the purpose of mail and parcel delivery, while Ordnance Survey’s ABP product also includes limited information on a property’s lifecycle. In this property lifecycle, each property gets assigned a Unique Property Reference Number (UPRN) that acts as a persistent identifier for a property throughout its lifetime. When a property is demolished, the UPRN is retained in the database, albeit marked as inactive.
Linking address records to official address databases is typically accomplished by directly matching text strings to one-another. This process essentially involves the conversion of a textual location into locational coordinates – commonly referred to as geocoding (Chow, Dede-Bamfo, and Dahal Citation2016). However, this task is challenging because of inconsistencies in the ways address strings can be formatted or recorded. For example, the address ‘Flat A, 100 Acacia Avenue’ could be recorded as ‘Flat 1, 100 Acacia Avenue’ or ‘Ground Floor Flat, 100 Acacia Avenue’ across different datasets. Different strategies have been employed to address these challenges and harmonize these inconsistencies, ranging from rule-based approaches and carefully designed heuristics (see, for instance, Chi et al. Citation2021; Harper et al. Citation2021) to probabilistic assignment procedures that involve fuzzy matching strategies (Lan and Longley Citation2020; Lansley, Wen, and Longley Citation2019; Van Dijk and Longley Citation2021). Alternatively, web-based tools can be used, although many of these use proprietary algorithms or are costly to implement. Moreover, these services are also susceptible to the same issues. A comparison by Chow et al. (Citation2016) of eight different web-based geocoding platform showed significant differences in accuracy and matching rates between services.
Although the success of address matching strategies partially depends on the quality and accuracy of the address framework employed vis-à-vis the quality of the address list that is to be matched (e.g. digital footprint data are known to contain a multitude of errors as they are often of unknown provenance), matching rates over 99% have been reported for address data derived from administrative sources (e.g. Harper et al. Citation2021). It should be noted that these matching rates are difficult to verify because of the sheer volume of these datasets: whereas an algorithm may appear successful in matching two address strings, it does not necessarily mean that these address strings refer to the same property. The overall success of the matching process is further contingent upon the underlying motivation and purpose of the subsequent analysis. For instance, if one were to examine residential change at neighbourhood level, inaccuracies in assigning an address string to specific addresses such as ‘100 Acacia Avenue’, ‘Flat 1, 100 Acacia Avenue’, or ‘Flat 2, 100 Acacia Avenue’ are unlikely to affect the results of the analysis because incorrect assignment would not affect the obtained area-level estimates. However, if one aims to incorporate household characteristics alongside property attributes derived from different data sources, accurate assignment is much more fundamental so to avoid associating incorrect property attributes with other household information.
3. Data and matching methods
Given the absence of definitive and reliable time-stamped lists of residential properties in the UK, we rely on two key data sources: (i) Ordnance Survey’s ABP (Ordnance Survey Citation2022), which provides georeferenced addresses and UPRNs of residential properties, and (ii) the LCRs, which offer a timeseries of individuals observed on the public version of the electoral registers supplemented with consumer data. In this section, we will first briefly discuss the content, coverage, and structure of both datasets (Sections 3.1 and 3.2), after which we will outline the assumptions that underpin our proposed building stock imputation method (Section 3.3), followed by a detailed description of the implemented address matching strategy (Section 3.4), and validation approach (Section 3.5).
3.1. AddressBase premium
ABP is regarded as the most comprehensive georeferenced address dataset in Great Britain, comprising both contemporary and historic properties in England, Wales and Scotland. Northern Ireland is covered through a separate product: AddressBase Islands. Together these two data products cover the whole of the United Kingdom.Footnote1 The dataset undergoes regular updates every six weeks, and we use the most recent release available to us (epoch 96). The primary reason for choosing ABP over Royal Mail’s PAF is that ABP contains property lifecycle information, albeit limited and incomplete. Within ABP each property is assigned a UPRN, along with a corresponding ‘start’ date which gives an indication onto when the UPRN became active. Ordnance Survey relies on Local Authority provision of such information which, especially in the early years of our study period, is not reliable and ‘start’ dates typically reflect the date at which the property record was injected into the database (Ordnance Survey Citation2021a). If applicable, an ‘end’ date is also provided, indicating when the record ceases to be current, such as when a property undergoes a change in use, gets demolished, or significantly altered (e.g. in the process of converting a terrace house into two or more individual apartments). Other attributes in ABP reflect the ‘logical status’ of a property: whether it is currently in use, temporary, or whether it is retired as a historical address. presents the count of ‘active’ UPRNs, as suggested by unadjusted ‘start’ date, ‘end’ date and ‘logical status’ for every property in every year between 1997 and 2022. These results strongly contrast the UK government’s estimates which for 1997, for instance, suggest that there were approximately 24,731,000 residential properties in the country (UK Government Citation2022). In addition, especially in the early years of the LCRs, these figures sharply contrast with the count of individual addresses found within them.
Table 1. Active UPRNs in AddressBase Premium (epoch 96) and number of unique addresses found in the LCRs for each year, 1997–2022.
3.2. Linked consumer registers
The LCRs were originally created by linking and integrating several consumer data sources consisting of the names and addresses of adults in the UK to chart population changes during intercensal years (see Lansley, Wen, and Longley Citation2019). Since their initial release, the LCRs have received several updates to improve their accuracy and incorporate more recent data (see Van Dijk and Longley Citation2021). The main source of data to feed into the LCRs are successive copies of the public (‘open’) versions of the electoral register comprising the names and addresses of those individuals who are registered and eligible to vote in a local, regional, and/or national UK election. To be included in the electoral register, an individual must be a British, Irish, or Commonwealth citizen residing in the UK, or a citizen of a European Union (EU) country if they live in the UK. Additionally, individuals must be at least 16 years old. The introduction of individual registration in 2014 meant that attainers had to make their own application to register, rather than being added through a single household form, and as a result the younger demographic is likely to be less well captured since then. Recent analysis by The Electoral Commission (Citation2024) further suggests that registrations differ by tenure and nationality, alongside some regional differences between the nations that make up the United Kingdom.
The full LCR timeseries is created through the linkage and integration of over one billion of these recorded individual names and addresses. Because names with associated addresses are deemed personal data, the processing of the data falls under the public interest derogation for research under Article 89 of the UK General Data Protection Regulation (GDPR). All data is securely kept within a ISO27001 certified Trusted Research Environment that exists to comply with strict information governance standards. Where the exact sources and operation of bias in the LCRs are unknown, published works by Lansley et al. (Citation2019) and Van Dijk et al. (Citation2021) have systematically compared LCR data against Census outputs to better understand and accommodate these issues. There is some evidence that failure to register is more pronounced among members of some ethnic minorities (see: The Electoral Commission Citation2024), but Lan et al. (Citation2020) have shown that there is strong correspondence between LCR coverage of ethnic minority groups and benchmark Census data for 2001 and 2011.
3.3. Imputing the active housing stock over time
Given the substantial inaccuracies in the lifecycle data of residential properties recorded in ABP, as shown in , we propose to use LCR data to infer the existence of properties that have not been identified as active in ABP and use this to calibrate the lifecycle information: if an individual is recorded to reside at a certain address in a particular year, the address must have been part of the active housing stock at that point in time. It should be noted that the list of additional properties we might be able to identify with this method will not be exhaustive for at least two reasons. First, in rare situations residential properties could consist entirely of ineligible non-voters, which would therefore be absent from electoral registers. Second, the coverage of registered voters is near complete only prior to the right to opt-out of the public (‘open’) version of the register in 2003. After 2003 the coverage of the public version has steadily decreased (), although this is compensated by the apparent increased coverage of active ABP records around the same time. For these reasons, we focus our efforts on all unique addresses captured in the first six years of the LCR data (1997–2002)Footnote2 and make the following assumptions:
The vast majority of official properties and addresses in the UK between 1997 and 2022 appear at some point in ABP or the supplementary ABP islands register.Footnote3
The ‘start’ dates of most properties, especially in earlier years of the time series, cannot be reliably discerned from ABP and are best considered as artefacts of the database creation process.Footnote4
The ‘end’ dates; of most properties are considered reliable as they are required for many ABP applications (e.g. a terrace house that is converted into two separate apartments).
When an address captured within the LCRs for a given year successfully matches an address in ABP, the address must have been part of the active housing stock at that point in time because it housed at least one named individual in that particular year.
3.4. Address matching
We use the deterministic address matching algorithm ASSIGN (AddreSS MatchInG to Unique Property Reference Numbers: Harper et al. Citation2021) to link all unique addresses across all years of data found in the LCRs to ABP. This algorithm reports a matching accuracy of up to 99.5%.Footnote5 We specifically select this deterministic algorithm over fuzzy matching approaches due to its ability to address and handle four prevalent challenges, albeit with some post-processing, that may arise during the assignment process. These challenges and our approach to addressing these to calibrate the property lifecycle information are as follows:
3.4.1. Multiple addresses linked to the same property
A UPRN is assigned to a specific property rather than to a specific address, which means that in some cases a UPRN is associated with different address records within ABP due to changes in street names or shifts in land use (such as conversions between residential and commercial properties). This may result in multiple instances of the same UPRN being linked to different address records within ABP. To address this issue and ensure consistency for our purposes, we adopt a method where we consolidate multiple records associated with a single UPRN into a single record and use whichever year is earlier out of the ‘start’ date as captured in ABP or the year in which the address appears within the LCRs for our property lifecycle calibration.
3.4.2. A property has been demolished
When a property is demolished, its UPRN is marked as ‘historic’ and is assigned an ‘end’ date. Because a UPRN is unique to a property and is never re-used, the end date indicates when the property effectively ceased to exist or was significantly altered. In the context of our study, when we come across an address that is recorded in the LCRs and is subsequently matched to a ‘historic’ property in ABP, we compare the year the address was first recorded in the LCR data with the ‘end’ date recorded in ABP to determine the active years of this property and establish its full lifespan.
3.4.3. A property has been converted
When a property is converted, the original building retains its UPRN and is classified as the ‘parent’ property within the ABP dataset. Inside the converted building, individual properties, referred to as ‘children’, are subsequently assigned their own UPRNs. To indicate the parent–child relationship, the record of ‘child’ properties contains the UPRN of their respective parent property. ASSIGN is designed to handle these changes by linking the new children UPRNs to addresses associated with a ‘Secondary Addressable Object’ (e.g. Flat 1 or Flat 2). This approach allows for accurate representation of the converted properties and their relationships within the address matching process. Similarly, when properties merge, the same process is applied to ensure that the UPRNs of the merged properties are appropriately linked and reflect the updated property structure. We here use ASSIGN’s approach to get the most accurate UPRN assignment and available lifecycle information.
3.4.4. A building has been completely redeveloped
ASSIGN does not accommodate the replacement of a demolished building with a new one that retains the same street address. In such cases the UPRN of the original building is updated to ‘historic’ and new UPRNs are assigned to each new property on the site. However, where the new street address string is (almost) identical, ASSIGN matches the street address to the most recent UPRN, overwriting the historic UPRN. This is an issue as the historic UPRN could have been part of the residential building stock in the earlier years of our LCR timeseries. We solve this by creating a UPRN successor lookup table that effectively links retired URPNS to contemporary UPRNs at the same address. We do this by running ASSIGN again for all addresses with a UPRN that has been flagged as retired: when ASSIGN matches the address of a retired UPRN to a more recent UPRN, we add this UPRN pair to a successor lookup table that we use to further calibrate our property lifecycle information.
We proceed by extracting all 66,350,985 unique address strings that are present in any of the years that are covered by the LCRsFootnote6 and subsequently run all address strings through ASSIGN. We only consider addresses in ABP as viable matching candidates if they have been classified as residential, building shell, or are unclassified but can be reached by postal mail. To efficiently process this substantial volume of data, we deploy the algorithm on a high-performance computing node equipped with 32 computing cores. The parallel processing capabilities of these computing cores enable us to simultaneously process multiple address strings, significantly enhancing the efficiency and speed of the matching algorithm.
Following the procedure outlined above, we use the matches obtained from the first six years of the digital footprints LCR data to backfill the residential housing stock and impute ‘start’ dates accordingly (see ; see Appendix for a breakdown of the individual steps, presented in pseudo-code format). Effectively, we compare the lifecycle information that is recorded in the ABP with the earliest occurrence of an address in the LCR. If the occurrence of the address in the LCR precedes the ABP ‘start’ date and the UPRN does not occur in the successor lookup table, we update the ‘start’ date to reflect this
Figure 1. Flow chart depicting the process of residential housing stock imputation with digital footprint data.
3.5. Validation
Although matching rates are difficult to verify due to the volume of the data that we are using, we attempt to assess the success rate of the matching procedure by looking into a small number of randomly chosen London addresses and benchmark these against two different approaches. We first compare the assigned UPRNs of our sampled addresses to another address dataset that is readily geo-referenced: Energy Performance Certificates (EPC: Department for Levelling Up, Housing & Communities Citation2021, Citation2022). We then further run a bespoke fuzzy matching algorithm, based on the Levenshtein distance and other string similarity measures, on the sampled address strings (see Van Dijk and Longley Citation2021). When all three methods (geo-referenced EPC addresses, bespoke fuzzy matching procedure, and ASSIGN method) converge and suggest the same UPRN for a given address, we consider it a successful match. In cases where different methods suggest different UPRNs for a specific address string, we manually examine the results to determine the most probable address candidate. We further scrutinize two randomly selected cases in detail by looking at planning permission from local councils and historic Google Street View images. In a final analysis, we assess the coverage and completeness of our digital footprints data imputations by comparing these estimates to estimates derived from alternative address-level datasets.
4. Housing stock estimates
4.1. Address matching success rates
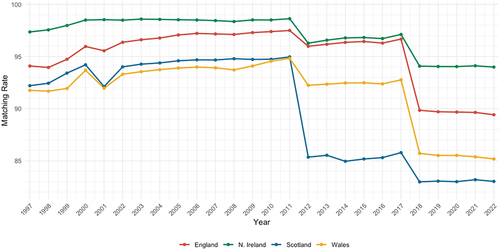
Although we only use the LCR data pertaining to 1997–2002 for the housing stock imputation, for completeness, presents the matching rate of the unique addresses, split out to England, Wales, Scotland and Northern Ireland for every year between 1997 and 2022. These matching rates reflect the successful matching of address strings to entries in ABP and the subsequent assignment of a UPRN, albeit that such a match does not necessarily guarantee accuracy with the ground truth. There are also some noticeable differences in terms of successful matching rates both across different years and amongst the different devolved nations. Several factors are likely to contribute to these discrepancies. First, because the LCR data is sourced from administrative and consumer channels, these are likely to contain errors (as discussed in Lansley, Wen, and Longley Citation2019). Second, as noted earlier, the ASSIGN matching algorithm was primarily developed and optimized for address data captured in England and Wales, potentially resulting in different success rates due to regional differences in the ways addresses are structured, especially in Scotland. Third, notable step changes in matching rates observed in 2012 and 2018 can be attributed to changes in data providers, where data quality and attribution are likely to have caused such disparities, such as the potential of supplementary consumer data records being of poorer data quality (see also Lansley, Wen, and Longley Citation2019).
Figure 2. Matching rate of unique addresses using ASSIGN, 1997–2022.
Because it is not feasible to validate the matching precision for all 66 million addresses, we establish an overall success rate by comparing our optimized ASSIGN procedure to 1,000 randomly selected and readily geo-coded EPC records of London addresses. We further run a fuzzy matching algorithm on these 1,000 addresses for comparison purposes. Among these 1,000 EPC records, all of which were assigned a UPRN by the Department for Levelling Up, Housing and Communities (Citation2021), the fuzzy matching algorithm assigned a UPRN to 912 records, while the optimized ASSIGN methods assigned 991 records to a UPRN. However, only in 757 cases did all three methods suggest the same UPRN. We manually examined the remaining 243 records and found that the fuzzy matching procedure appeared to be correct in 79.7% of the cases, compared to 97% with our optimized ASSIGN approach.Footnote7 From these cases, the main advantage of the (optimized) ASSIGN procedure appears to be that it is much more effective at allocating descriptive Secondary Addressable Objects, such as ‘Ground floor flat’, ‘First floor front flat’, ‘Flat A’, or ‘Flat 1’, to a UPRN. The high quality of matches observed in this sample provides a solid justification for our approach to use digital footprints data for the ABP lifecycle calibration.
4.2. Residential building stock estimates
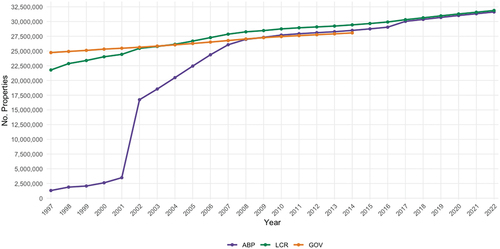
shows the count of ‘active’ residential properties for every year between 1997 and 2022, as per ABP lifecycle data, estimates by the UK Government (UK Government Citation2022), and our digital footprints imputation. In the earlier years, ABP data captures only a portion of the government’s estimates for the corresponding period, whereas our findings demonstrate a significantly closer alignment with these estimates.
Figure 3. Housing stock estimates comparisons between ‘active’ dates derived from AddressBase Premium, official estimates made by the UK government, and our calibration using digital footprint data.
4.3. Validation of successor lookup method
We explore two randomly selected examples to verify whether our methodology can successfully accommodate the challenges identified in Section 3.4 in relation to historic UPRNs. The first example that was identified refers to ‘Leys Court’ in Ruddington where our successor lookup table suggested a UPRN change had occurred. In this case, local planning permission records document that in 2014 30 flats were converted into 21 new flats (Rushcliffe Borough Couincil Citation2014). Because the addresses themselves were re-used, ASSIGN would have linked these addresses to the most recent UPRN – even if the address would occur in the LCR data prior to 2014. Our method successfully dealt with this situation: ‘Leys Court’ addresses found in the LCRs prior to 2014 are assigned different UPRNs than ‘Leys Court’ addresses found in the LCRs post-2014.
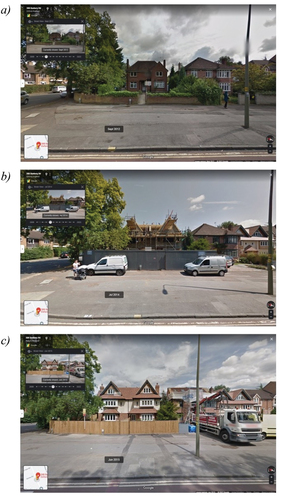
The second example of the effectiveness of the success-lookup methodology is found on ‘388 Banbury Road’ in Oxford. Here, we are not only able to corroborate real-world changes to local planning permission (see Oxford City Council Citation2013), but can also see the changes on historic Google Street View images. The planning permission details the ‘demolition of existing dwelling and erection of a pair of semi-detached (…) dwellings’ in 2013, which can be verified to have taken place throughout 2014 and the new properties completed in 2015 through the Google Street View imagery in . Again, since ASSIGN attributes the most recent UPRN for a given address, earlier LCR records were incorrectly matched. By employing the successor lookup table, it was correctly reassigned to the historic UPRN. The ABP lifecycle further suggested that this UPRN was ‘active’ since 2003, but LCR records suggested that this property already existed in 1998 and the lifecycle information was updated accordingly.
Figure 4. Google Street View imagery of “388 Banbury Road” redevelopment in (a) 2012, (b) 2014, and (c) 2015.
4.4. Comparison with alternative datasets
We finally assess the quality of our imputed housing stock lifecycle data and the underlying assumptions of using digital footprint data to calibrate these by comparing our results to results derived from alternative UK address data products available to us. These include HM Land Registry Price Paid Data (PPD: HM Land Registry Citation2022), which are a near complete record of property sales dating back to 1995, Energy Performance Certificates (EPCs: Department for Levelling Up, Housing & Communities Citation2022), that were made compulsory for properties sold or rented since November 2008, and WhenFresh/Zoopla rental listings (Consumer Data Research Centre Citation2022). We use these data sources as alternative methods of calibrating the ABP property lifecycle information for three areas in England and compare the results.
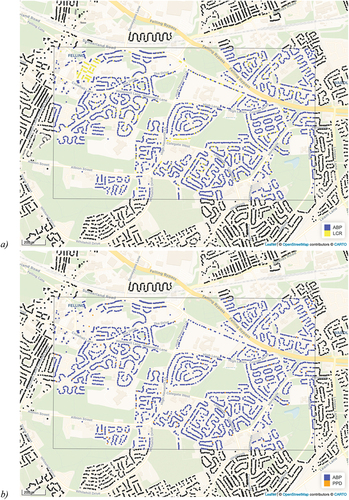
presents a comparison of housing stock estimates in 1997 for the postcode district of NE10, near Newcastle upon Tyne in the northeast of England. show that within this area ABP is generally quite complete, suggesting that 4,331 properties were part of the residential building stock in 1997. However, our imputation suggests that the ABP data does not include all properties: in the north-west of the area several streets have been imputed that were not recorded as being present in 1997. When we use HM Land Registry Price Paid Data to calibrate the 1997 residential property data in the same area, some of the same properties are identified as being part of the housing stock at that point in time that were not recorded as such in ABP – as shown in – but a large number of properties is still missing. This is to be expected as only properties that have been sold are recorded in the PPD, whilst electoral roll registrations capture most of the population and therewith the properties in which they reside.
Figure 5. Estimated residential building stock by combining ABP with (a) the LCR or (b) land registry Price Paid Data. Postcode district NE10 highlighted, 1997.
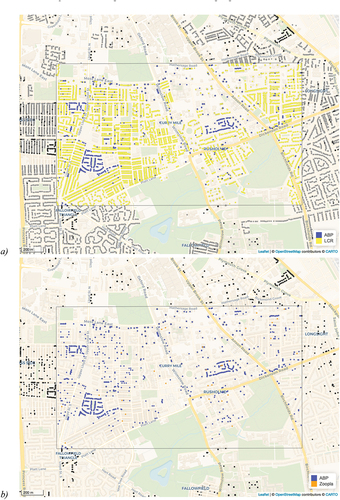
compare the housing stock estimates in the BS21 postcode area, near Bristol in the southwest of England, in 2008, derived from the LCR calibration as well as through issued EPC certificates. Within this area, there is a clear lack of information on the size and distribution of the housing stock when looking at the recorded ABP ‘start’ date entries. In this case, whilst the LCR imputation method are able to identify the presence of 4,204 additional properties, the use of EPCs only yields 101 properties. Because this may be an artefact of the recency of mandatory EPCs, we also include 2015 EPC data (). The results clearly show that, despite using a much more recent year, the vast majority of residential properties is still not identified. This area can be considered a prime example of how digital footprints data can effectively be used to facilitate the calibration of existing authoritative datasets. In a final comparison, we use WhenFresh/Zoopla rental listings to look at the residential housing stock in postcode district M14, in Manchester in the northwest of England. show that, again, there are clear difference in coverage between the ABP, the calibrations of ‘start’ dates using the LCRs, and the calibration of ‘start’ dates using these rental listings.
Figure 6. Estimated residential building stock by combining ABP with (a) the LCRs, (b) 2008 EPC data, and (c) 2015 EPC data. Postcode district BS21 highlighted, 2008.
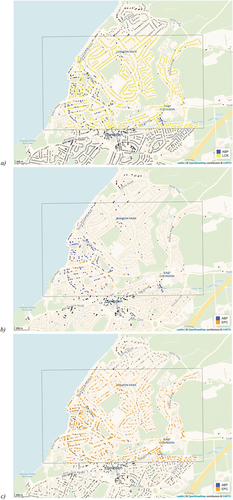
Figure 7. Estimated residential building stock by combining ABP with (a) the LCRs and (b) WhenFresh/Zoopla rental listings. Postcode district M14 highlighted, 2014.
5. Discussion and conclusion
People’s interactions with the world and consumer-facing organizations, mediated by digital devices, create digital footprints data. They can be harnessed to understand and address key research, business and policy questions about our increasingly digital society and these data sources have been gaining increasing attention. In the UK, large investments and initiatives such as Smart Data Research UK and Administrative Data Research UK, for instance, are working towards making available administrative data created by government and public bodies across the UK. Similarly, the Office for National Statistics has expressed a strong interest in using administrative data to produce more frequently updatable and granular population statistics (Office for National Statistics Citation2023). This paper fits within this wider outlook of using and repurposing digital footprint data and using advanced computational methods to address (urban) policy problems (see Kandt and Batty Citation2021; Li, Zhao, and Zhong Citation2022).
This paper specifically set out to use such digital footprint data to calibrate the limited information on the size and extent of the residential housing stock in the United Kingdom from 1997 to present-day. By using a very large datasets containing the names and addresses of over a billion individuals, we are able to reliably assess which residential properties already existed before the widespread adoption of UPRNs. The results further suggest that these near complete registers of voters are able to paint a much richer picture when we apply similar methods on other datasets that contain property address information such as land registry sales data, Energy Performance Certificates, and rental listings.
Notwithstanding the large numbers of properties that we have successfully backfilled, our proposed method will still not capture every single residential property. First, the main source of data to feed into the LCRs are electoral roll registrations and properties in which no one in the household is eligible to vote are not be captured. Second, the address matching process is not without errors and some addresses will not have been successfully geocoded. A possible, albeit partial, solution would be to look at instances where the PPD data, EPC data, rental listings, or other administrative sources can be used to further improve the LCR calibration, for instance, by including properties that the LCRs might have missed into the annualized residential building stock estimates. Another solution could be to leverage alternative data sources, such as aerial or satellite imagery, to further validate and improve the housing stock lifecycle dataset. Given the successes of longitudinal comparisons of remote sensed imagery in detecting changes in urban areas (cf. Deng and Ma Citation2015; Ryznar and Wagner Citation2001), these methods could provide additional means to identify buildings that do not appear in consumer records or existed prior to their availability.
The resulting dataset has several direct applications. First, high quality and granular data on properties – and who might be living in these properties – are essential for catastrophe risk modelling. Spatial resolution significantly impacts the precision of such models (cf. Figueiredo and Martina Citation2016). Second, the dataset can serve as a container for spatial microsimulation approaches. These methods employ attribute-rich individual-level sample data to estimate the characteristics of larger populations. Spatial microsimulation extends this concept by explicitly considering spatial distributions through the incorporation of spatial constraints (Lomax et al. Citation2022). This approach combines the advantages of non-spatial attribute-rich microdata with geographically aggregated data and finds applications in various fields such as population projections, health studies, transport analysis, policy evaluation, and assessments of deprivation and inequality (Wu et al. Citation2022). Third, the integration of microsimulation approaches with observed data offers the potential to create a hybrid population longitudinal cross-section of both observed and synthetic individuals at the property level. Such a comprehensive digital footprints data infrastructure would enable exploration of important policy issues such as ethnic segregation at the sub-neighbourhood level, household overcrowding, energy consumption patterns, and understanding processes of changing socio-economic inequalities.
Data and code accessibility
The individual-level property data and small-area aggregated outputs are accessible for research purposes through the UK Economic and Social Research Council Consumer Data Research Centre (CDRC) upon a successful application (www.cdrc.ac.uk). The CDRC actively creates, supplies, maintains, and delivers data to a diverse range of users engaged in research with big consumer data. Researchers can find details on how to access both the full Residential Property Count Dataset (stable URL: https://data.cdrc.ac.uk/dataset/cdrc-residential-property-counts) and a derivative small-area aggregation (stable URL: https://data.cdrc.ac.uk/dataset/cdrc-residential-property-counts-lsoa-geography) in the CDRC data catalogue.
Acknowledgements
Maps contain © Crown copyright and/or database right 2023 OS, Local Government Information House Limited copyright and database rights 2023, Royal Mail data © Royal Mail copyright and database rights 2022, and © OpenStreetMap contributors. We would like to thank the anonymous reviewers for their constructive feedback and helpful suggestions.
Disclosure statement
No potential conflict of interest was reported by the author(s).
Additional information
Funding
Notes
1. We use the term ABP to refer to the combined AddressBase Premium and AddressBase Island products.
2. Over time, the LCR data have been sourced from various data providers. Notably, data from 1997–2002 were consistently provided by the same supplier before a change occurred in 2003. This consistency serves as another reason for concentrating our analysis on the LCR data pertaining to 1997–2002.
3. ABP is updated every six weeks and derived from several data sources including Local Government’s National Land and Property Gazetteer (NLPG), The One Scotland Gazetteer (OSG), Royal Mail Postcode Address File, Valuation Office Agency, and Ordnance Survey (Ordnance Survey Citation2021b). ABP therefore provides the most comprehensive view of property lifecycles in the UK.
4. Where we try to calibrate ‘start’ dates for properties using available digital footprints data, we are limited to the period to which our data pertains. We therefore do not intend to trace a particular property to the date it was constructed, and the ‘start’ dates that we will define are therefore not necessarily the same as the building’s age.
5. ASSIGN has been developed and optimized for address data captured in England and Wales (Harper et al. Citation2021). While it is still largely applicable to address data in Scotland and Northern Ireland, it should be noted that variations in the structure of address data in these regions may impact performance.
6. These extracted strings originate from the raw electoral roll and consumer data, representing unique address strings but not necessarily unique addresses. A single address may be represented by multiple address strings due to variations in spelling, formatting, or other discrepancies in the data sources.
7. With ASSIGN still being under active development, small variations in matching rates are expected over time with different releases of the software.
References
- Chi, B., A. Dennet, T. Oléron-Evans, and M. Robin, et al. 2021. A New Attribute-Linked Residential Property Price Dataset for England and Wales 2011–2019. Data Collection. Colchester, Essex: UK Data Service.
- Chow, T. E., N. Dede-Bamfo, and K. Dahal. 2016. “Geographic Disparity of Positional Errors and Matching Rate of Residential Addresses Among Geocoding Solutions.” Annals of GIS 22 (1): 29–42. https://doi.org/10.1080/19475683.2015.1085437.
- Consumer Data Research Centre. 2022. “WhenFresh/Zoopla Property Transactions, Rentals and Associated Migration.” Accessed July 6, 2023. https://data.cdrc.ac.uk/dataset/whenfreshzoopla-property-transactions-rentals-and-associated-migration.
- Deng, C., and J. Ma. 2015. “Viewing Urban Decay from the Sky: A Multi-Scale Analysis of Residential Vacancy in a Shrinking U.S. City.” Landscape and Urban Planning 141:88–99. https://doi.org/10.1016/j.landurbplan.2015.05.002.
- Department for Levelling Up, Housing & Communities. 2021. “Energy Performance Certificates Now Include the Unique Property Reference Number (UPRN).” Accessed June 15, 2023. https://news.opendatacommunities.org/energy-performance-certificates-now-include-uprn/.
- Department for Levelling Up, Housing & Communities. 2022. “Energy Performance of Buildings Data: England and Wales.” Accessed November 3, 2022. https://epc.opendatacommunities.org/.
- The Electoral Commission. 2024. “Explore the Data: Who is and isn’t Registered to Vote?” Accessed March 15, 2024. https://www.electoralcommission.org.uk/who-is-registered.
- Figueiredo, R., and M. Martina. 2016. “Using Open Building Data in the Development of Exposure Data Sets for Catastrophe Risk Modelling.” Natural Hazards and Earth System Sciences 16 (2): 417–429. https://doi.org/10.5194/nhess-16-417-2016.
- Harper, G., D. Stables, P. Simon, Z. Ahmed, K. Smith, J. Robson, C. Dezateux. 2021. “Evaluation of the ASSIGN Open-Source Deterministic Address-Matching Algorithm for Allocating Unique Property Reference Numbers to General Practitioner-Recorded Patient Addresses.” International Journal of Population Data Science 6 (1): 1674. https://doi.org/10.23889/ijpds.v6i1.1674.
- HM Land Registry. 2022. “Price Paid Data. Accessed November 3, 2022. https://www.gov.uk/government/statistical-data-sets/price-paid-data-downloads.
- Kandt, J., and M. Batty. 2021. “Smart Cities, Big Data and Urban Policy: Towards Urban Analytics for the Long Run.” Cities 109:102992. https://doi.org/10.1016/j.cities.2020.102992.
- Kandt, J., J. Van Dijk, and P. A. Longley. 2020. “Family Name Origins and Inter-Generational Demographic Change in Great Britain.” Annals of the American Association of Geographers 110 (6): 1726–1742. https://doi.org/10.1080/24694452.2020.1717328.
- Lan, T., J. Kandt, and P. A. Longley. 2020. “Geographic Scales of Residential Segregation in English Cities.” Urban Geography 41 (1): 103–123. https://doi.org/10.1080/02723638.2019.1645554.
- Lan, T., and P. A. Longley. 2020. “Geo-Referencing and Mapping 1901 Census Addresses for England and Wales.” International Journal of Geo-Information 8 (8): 320. https://doi.org/10.3390/ijgi8080320.
- Lan, T., and P. A. Longley. 2022. “An Individual Level Method for Improved Estimation of Ethnic Characteristics.” International Regional Science Review 46 (3): 328–353. https://doi.org/10.1177/01600176221116568.
- Lansley, G., L. Wen, and P. A. Longley. 2019. “Creating a Linked Consumer Register for Granular Demographic Analysis.” Journal of the Royal Statistical Society: Series A (Statistics in Society), 182 (4): 1587–1605. https://doi.org/10.1111/rssa.12476.
- Li, Y., Q. Zhao, and C. Zhong. 2022. “GIS and Urban Data Science.” Annals of GIS 28 (2): 89–92. https://doi.org/10.1080/19475683.2022.2070969.
- Lomax, N., S. A. P, L. Archer, A. Ford, and J. Virgo. 2022. “An Open-Source Model for Projecting Small Area Demographic and Land-Use Change.” Geographical Analysis 54 (3): 599–622. https://doi.org/10.1111/gean.12320.
- Office for National Statistics. 2023. “Improving Our Population, Migration and Social Statistics.” Accessed February 26, 2023. https://www.ons.gov.uk/aboutus/whatwedo/programmesandprojects/censusanddatacollectiontransformationprogramme/futureofpopulationandsocialstatistics/improvingourpopulationmigrationandsocialstatistics.
- Openshaw, S. 1984. “Ecological Fallacies and the Analysis of Areal Census Data.” Environment and Planning A: Economy and Space 16 (1): 17–31. https://doi.org/10.1068/a160017.
- Ordnance Survey. 2021a. AddressBase, AddressBase Core, AddressBase Plus, AddressBase Premium – Overview, Online. https://www.ordnancesurvey.co.uk/documents/product-support/support/addressbase-product-overview.pdf.
- Ordnance Survey. 2021b. “AddressBase Premium – Technical Specification V.2.7. Online. Accessed July 6, 2023. https://www.ordnancesurvey.co.uk/documents/product-support/tech-spec/addressbase-premium-technical-specification.pdf.
- Ordnance Survey. 2022. “AddressBase Premium.” Accessed November 3, 2022. https://www.ordnancesurvey.co.uk/business-government/products/addressbase-premium.
- Oxford City Council. 2013. “Planning – Application Summary 13/01320/FUL.” Accessed June 22, 2023. https://public.oxford.gov.uk/online-applications/applicationDetails.do?keyVal=MNJW2WMFQ9000&activeTab=summary.
- Reades, J., L. Lees, P. Hubbard, and G. Lansley. 2022. “Quantifying State-Led Gentrification in London: Using Linked Consumer and Administrative Records to Trace Displacement from Council Estates.” Environment and Planning A: Economy and Space 55 (4): 810–827. https://doi.org/10.1177/0308518X221135610.
- Royal Mail. 2022. “Postcode Address File.” Accessed November 3, 2022. https://www.poweredbypaf.com/product/paf/.
- Rushcliffe Borough Couincil. 2014. “Planning – Application Summary 13/02361/FUL.” Accessed June 22, 2023. https://planningon-line.rushcliffe.gov.uk/online-applications/applicationDetails.do? keyVal=MX6GBXNL09900&activeTab=summary.
- Ryznar, R., and T. Wagner. 2001. “Using Remotely Sensed Imagery to Detect Urban Change: Viewing Detroit from Space.” Journal of the American Planning Association 67 (3): 327–336. https://doi.org/10.1080/01944360108976239.
- UK Government. 2022. “Live Tables on Dwelling Stock (Including Vacants). Table 101: By Tenure, United Kingdom (Historical Series).” Accessed November 7, 2022. https://www.gov.uk/government/statistical-data-sets/live-tables-on-dwelling-stock-including-vacants.
- UK Research and Innovation. 2023. “Digital Footprints.” Accessd on June 22, 2023. https://www.ukri.org/what-we-offer/browse-our-areas-of-investment-and-support/digitalfootprints/.
- Van Dijk, J., G. Lansley, and P. A. Longley. 2021. “Using Linked Consumer Registers to Estimate Internal Migration in the United Kingdom.” Journal of the Royal Statistical Society: Series A (Statistics in Society) 184 (4): 1452–1474. https://doi.org/10.1111/rssa.12713.
- Van Dijk, J., and P. A. Longley. 2021. “Developing a Data Infrastructure for Bespoke Demographic Analysis.” Proceedings of the 29th Conference of GIS Research UK (GISRUK), Cardiff: Cardiff University.
- Wu, G., A. Heppenstall, P. Meier, R. Purshouse, and N. Lomax. 2022. “A Synthetic Population Dataset for Estimating Small Area Health and Socio-Economic Outcomes in Great Britain.” Scientific Data 9 (1): 19. https://doi.org/10.1038/s41597-022-01124-9.
Appendix
ANALYSIS STEPS:STEP 1 :
## Matching of consumer address strings to an authoritative address database
RUN:
MATCH LCR [ID] to ABP [UPRN] using ASSIGN
END
OUTPUT: LCR with [ID], [UPRN], [YEAR]
STEP 2 :
## Creation of successor lookup table, linking retired (historic) UPRNs to contemporary (active) UPRNs
CREATE new table ABP_SUCCESSOR
RUN:
FILTER ABP WHERE [ACTIVE] = NOT CURRENTLY ACTIVE
EXPORT TO new table ABP_NOTACTIVE
THEN:
MATCH ABP_NOTACTIVE [URPN] to ABP [UPRN] using ASSIGN
IF:
ABP_NOTACTIVE [UPRN] == ABP [UPRN] PASS
IF:
ABP_NOTACTIVE [UPRN] <> ABP [UPRN]
ADD ABP_NOTACTIVE [UPRN] as [HISTORIC UPRN], ABP [UPRN] as [CONTEMPORARY UPRN] to ABP_SUCCESSOR
END
OUTPUT: ABP_SUCCESSOR with [HISTORIC UPRN], [CONTEMPORARY UPRN]
STEP 3 :
## Updating LCR to ABP matches with ABP SUCCESSOR table
RUN:
FOR LCR [YEAR] RANGE IN (1997,2002)
IF:
LCR [UPRN] NOT IN ABP_SUCCESSOR [CONTEMPORARY UPRN] PASS
ELSE IF:
LCR [YEAR] >= ABP_SUCCESSOR [CONTEMPORARY UPRN] [START DATE] PASS
ELSE:
REPLACE LCR [UPRN] with ABP_SUCCESSOR [HISTORIC UPRN]
END
OUTPUT: LCR with [ID], calibrated [UPRN], [YEAR]
STEP 4 :
## Creating residential building stock lifecycle table
RUN:
CREATE new table HOUSINGSTOCK
RUN:
SELECT ABP [UPRN][START DATE], [UPRN][END DATE ADD to HOUSINGSTOCK
THEN:
JOIN HOUSINGSTOCK with LCR ON LCR [UPRN] = HOUSINGSTOCK [UPRN]
IF:
HOUSINGSTOCK [START DATE] < HOUSINGSTOCK [YEAR] PASS
ELSE:
REPLACE HOUSINGSTOCK [START DATE] with HOUSINGSTOCK [YEAR]
END
OUTPUT: HOUSINGSTOCK with [URPN], calibrated [START DATE], [END DATE]