Abstract
The Burmese–Andaman Arc System (BAAS) and the West Sunda Arc (WSA) in NE Indian Ocean are well known for their high seismic hazard and tsunami potentiality. Seismicity is caused by eastward subduction of the Indian plate to intermediate focal depths below the BAAS, but the penetration depth goes even deeper to about 500 km below the WSA. The seismicity map and its correlation to crustal and mantle faults for this extensive plate margin are presented. This is achieved by using frequency–magnitude relationship to select larger (m b ≥ 5.0) and comparatively well-recorded events from the available earthquake catalogue that span for a period of little more than a century (1906–2008). Barely 14% of the events qualify the treatment, and the events so selected are subjected to cluster analysis using a statistical function ‘point density’. The clusters found for the arc demonstrate significant relationship to subduction geometry in their respective areas; 11 out of a total of 13 clusters commonly originate below the fore arc. Earthquakes within the individual clusters have linear fractal geometry consistent with the traces of seismogenic surfaces that actually produce them. Correlation of clusters to seismologic depth sections and the composite results derived from 518 CMT solutions of earthquakes establish a close spatial relationship between the shape and orientation of the clusters with stress axes and regional tectonics. This provides a three-dimensional perspective on the stress distribution within the respective clustered seismic zones. Seismic potentiality for five most conspicuous clusters is also inferred.
1. Introduction
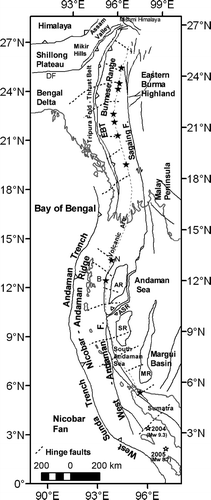
The Burmese–Andaman Arc System (BAAS) and West Sunda Arc (WSA) together constitute a subducting plate margin in the NE Indian Ocean, nearly 2800 km in length, that serves as the tectonic link between the Western Pacific Arc System with the Himalayas. BAAS and the WSA have the following tectonic domains: (1) a northernmost segment of BAAS in Burma where a subduction zone is clearly discernible in a land environment delimited by Eastern Boundary Thrust (EBT); (2) further west, the trench zones of Andaman and WSA where the Indian plate subducts; (3) outer sedimentary ridge of Andaman–Nicobar–Nias Islands in between trench and the arc, followed by a continuous volcanic arc from Sumatra to Burma with active Barren Island volcano and dormant Narcondam in the central part and many dormant volcanoes in Burma; (4) Andaman back-arc spreading ridge (ASR) underlying the Andaman Sea between Alcock Rise (AR) and Sewell Rise (SR) relating to the oblique convergence of the Indian plate at the Asian continental margin in the east; actual spreading occurred through several short leaky-transforms, producing the ‘pull-apart’ Andaman basin in southern half of the BAAS; (5) further south is the intense seismic zone of the WSA with volcanism in Sumatra (). Sixteen hinge faults () across the trend of the arc with fixed western end marked by our earlier study (Dasgupta et al. Citation2003) have delimited the entire study area into several blocks of individual seismic characters.
Figure 1. Tectonic domains in the Burmese–Andaman Arc System (BAAS) and the West Sunda Arc (WSA) in NE Indian Ocean. AR: Alcock Rise; ASR: Andaman Spreading Ridge; B: Barren Island volcano; BS: Belt of Shuppen; DF: Dauki Fault; EBT: Eastern Boundary Thrust; MR: Margui Ridge; N: Narcondam volcano; SR: Sewell Rise. The locations of two great earthquakes from 2004 and 2005 are shown.
The arc is unique in several ways. First is the intense seismic and tsunami hazard potentiality of the arc; the last example was the 2004 Sumatra earthquake. Seismically, the arc is not equally active throughout; a stretch of nearly 800 km between coastal Burma and the Gulf of Martaban is seismically almost passive. Second, 40% of the arc lies within the Burmese mainland where the Indian plate currently subducts to almost 200 km depth. The Neogene tectonics in central Burma is controlled by the India-Indochina oblique convergence, which is in response to a major Miocene regional plate kinematic reorganization (Bertrand and Rangin Citation2003). Third, the ASR underlying the Andaman Sea relates to the oblique convergence of the Indian plate at the Asian continental margin (Curray et al. Citation1979, Mukhopadhyay Citation1984). Fourth, the subduction depth in central Andaman extends to about 220 km depth (Dasgupta et al. Citation2003), but the subduction proceeds to about 500 km depth below the WAS further south. Fifth, the arc houses several active to dormant volcanoes, including the active Barren Island volcano in central Andaman. In the present study, our aim is to search for spatial seismic clusters in the intense seismic zones of the BAAS and WSA, in order to gain an understanding on the relationship of potential seismic clusters to structural elements of the subduction zone. In spite of more than 100 years of instrumental recording in the region (the first seismological observatory in SE Asia was established in Calcutta as early as 1897), a major limitation in the study is the non-uniform status of seismic monitoring for the arc as a whole, in particular, for the lower-magnitude shocks. This is an outcome of the typical geometric orientation of the arc, most of which lies offshore, whose remote islands locate far off from the mainland of SE Asia. These factors introduce inconsistency and incompleteness in any earthquake catalogue, resulting in inherent uncertainty in the search for ‘long-term earthquake clustering’ (Kagan and Jackson Citation1991), no matter what methodology is adopted. Notwithstanding these limitations, we present here an analysis of seismic clusters for the BAAS and WSA, and also investigate their respective stress characters and seismic potentiality.
2 Seismic data treatment and analysis
It is known that similar events occurring close together in space produce spatial clusters; particularly, moderate to large magnitude earthquakes often occur in spatial seismic clusters. A seismic cluster is suspected in a region if it consists of multiple events with a magnitude greater than a threshold value originating within an acceptable time period. Any statistical treatment for cluster analysis essentially therefore depends on the completeness of the earthquake catalogue (Ansari et al. Citation2009). The earthquake catalogue used in the present study (source: ISS, ISC and NEIC-USGS) for the BAAS and WSA consists of a total of 13,057 earthquake records for the period of 1906–2008 covering a rather wide range of magnitude (2.7 to 8.6) with focal depths extending to as deep as 500 km. Both single and cumulative earthquake frequency curves are constructed using the catalogue data. The b-value of earthquakes with m b ≥ 4.0 calculated by the regression method is 1.0382 (). Only 1752 events of magnitude 5.0 and above in the catalogue actually qualify for cluster analysis. Of these, barely 47 seismic events occurred prior to 1964, with a magnitude-frequency break-up as follows: 11 events in the magnitude range of 5.0–5.5, 20 events in the magnitude range 5.6–6.0 and 16 events of magnitude exceeding 6.0. Earthquake frequency in the lower-magnitude range (m b = 5.0–5.5) shows a clear increase postdating 1964 () as a consequence of an increase in the number of monitoring stations. The selected events exhibit a smoother cumulative frequency curve () with a b-value of 0.9731 calculated by the regression method; this is similar to the global average of b-value of 1.0. earthquakes, classified according to their magnitude, are superposed on a generalized tectonic map for the BAAS and WSA ().
Table 1. Earthquakes for the Andaman–Burmese arc classified according to their magnitude and frequency (used for cluster analysis).
Figure 2. Frequency magnitude relationships for: (a) 13,057 events of magnitude m b = 2.7 and above as listed in catalogue, and (b) 1752 events of m b = 5.0 and above. The respective a are b values are given.
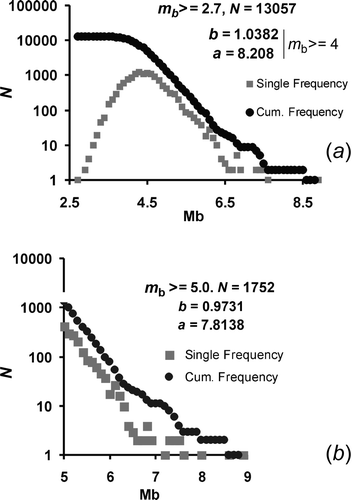
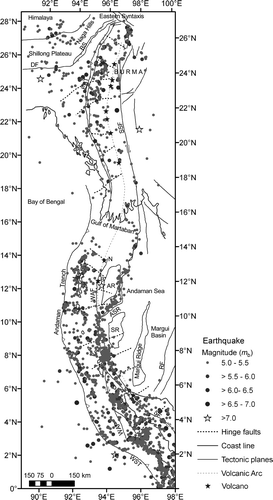
Figure 3. Epicentral map for the Burmese–Andaman and West Sunda Arc, period: 1906–2008. AR: Alcock Rise; ASR: Andaman Spreading Ridge; BS: Belt of Shuppen; DF: Dauki Fault; EBT: Eastern Boundary Thrust; RF: Renong Fault; SF: Semangko Fault; SR: Sewell Rise; SSF: Shan-Sagaing Fault; VA: Volcanic Arc; WAF: WEST Andaman Fault; WST: West Sundra Trench. Tectonic features are adopted after Curray et al. (Citation1982) and Dasgupta et al. (Citation2003).
Though several visual clusters are apparent on the map (), the following spatial statistical functionalities are applied on the dataset in to constrain their configuration and extents:
A point density function is applied to constrain the extent of the clusters. Point density is a classical spatial statistical tool to identify areas where data points are concentrated more or vice versa. To calculate the point density, the distance between the adjacent earthquakes is measured, and a mean distance (∼8 km) is calculated. Half of the mean distance (i.e. 4 km) is taken as the radius of the circular neighbourhood. The point density is then calculated as the total number of earthquake epicentral points that fall within a circular neighbourhood with a specific radius (in this case 4 km) divided by the area of the neighbourhood. A factor resulting from the size of the earthquake is also introduced for deriving the point density value, e.g. 6 points are counted instead 1 for an earthquake of magnitude 6 in the selected neighbourhood. This is done to offer more weight to larger earthquakes in the calculation. The measurement is then carried out in an overlapping grid pattern where the centre of the circle has been moved across the map (both along latitude and longitude) by a sliding distance of 4 km. The calculated point density value is stored in a grid point at the centre of the circle. The resulting values obtained by this sliding grid process have a mean (M) of 0.0027 and standard deviation (SD) of 0.008772. The areas with anomalous point density (value > (M + 2 SD), i.e. 0.020244) have been marked as zones of spatial clusters and shown as closed grey polygons (). This process identifies 13 numbers of spatial clusters of variable sizes with numbers C1 to C13 across the entire study area.
Figure 4. Seismic cluster analysis results for the Burmese–Andaman and West Sunda Arc using data plotted in . In all, 13 clusters (C1–C13) are detected; see text for discussion. 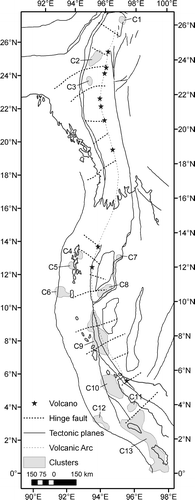 | |||||
Comparative statistics between clustered and non-clustered events presented in show that almost half the population () actually originates within the cluster domains. The figure also illustrates their respective single and cumulative frequency–magnitude relationships. The ‘b’ value calculated by the regression method for the cluster zone is somewhat lower (0.8195) than that for the non-cluster zone (0.9967). However, this apparent increase in b-value is probably attributable to data inhomogeneity, rather than any true significance in data coverage for smaller-magnitude shocks.
Figure 5. Frequency–magnitude distribution and fractal plots for the clustered and non-clustered events; see for their magnitude distribution. 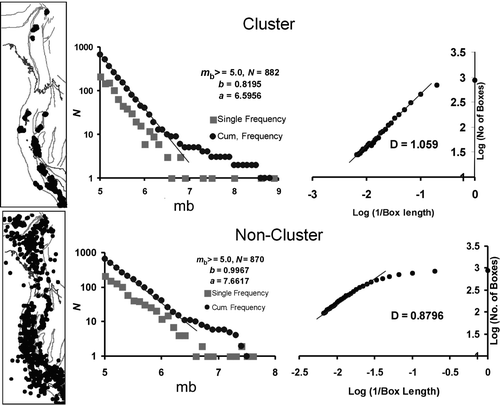 | |||||
The geometric configuration of the clustered and non-clustered earthquakes is further constrained by fractal analysis to understand the cause–effect relationship between the occurrence of seismicity and the underlying processes that produce them. Further, once the fractal or scale-independent nature of occurrence of seismicity is established, the ‘fractal dimension’ gives the exact geometric relationship between the earthquakes points and the underlying causative surfaces. The Box-counting method (Feeder Citation1988) is used to calculate the fractal dimensions. The seismicity points are overlain with a grid of square boxes (pixels), which progressed from the smallest to successively larger boxes by combining the pixels in an up-scale manner (Cheng Citation1999). The numbers of boxes (Nn ) of size ‘rn ’ required to cover data are plotted on a log–log scale as a function of ‘rn ’. To denote the distribution as fractal, ‘Nn ’ with a characteristic linear dimension greater than ‘rn ’ must satisfy the relation Nn = C/Nn D , where ‘C’ is the proportionality constant, and ‘D’ is the fractal dimension. ‘D' is calculated as factor log(Nn +1/Nn )/log(rn /rn +1) (Turcotte 1997). The seismicity data for both clustered and non-clustered domains (the plots of log (Nn ) versus log(1/rn )) give straight lines (right panel in ). These plots indicate that the seismicity of both cases obeys scale-invariant fractal geometry, but the causative processes that generate such geometric configuration are different. The seismicity in a cluster indicates line fractal geometry with fractal dimension 1.059, whereas the non-clustered seismicity designates a point fractal geometry with fractal dimension 0.8796. This also implies that the seismicity points in clusters are arranged to form a linear pattern on the map, analogous to the traces of major seismogenic surfaces represented as a curvilinear line. Strain release by well-connected seismogenic surfaces at depth control the orientation of the clusters. On the contrary, such linear geometry is absent in case of non-clustered earthquakes with fractal dimension (0.8796), which indicates agglomeration of points. The disposition of such point fractals is not directly controlled by any seismogenic surface at depth, instead indicating sporadic strain release. | |||||
3 Discussion on cluster characteristics
3.1 Burmese Arc Clusters
Clusters C1, C2 and C3 are recognized for the Burmese Arc ( and ); these are located in north to north-central Burma in the zones of moderate seismicity. Earthquake parameters of the clusters (earthquake statistics embodied in a cluster, magnitude and depth ranges, length of the major axis) are given in . Of these, cluster C2 is the largest with a maximum number of earthquakes; it is elliptical in shape with a strike length of 130 km, trends north-east and is thus sub-parallel to the local structural orientation of the arc. C1 is a small elliptical cluster in the north of Burma. C3 is a north-trending elliptical cluster located south of C2 in the same structural trend. While C2 and C3 clusters originate from the subducting Indian plate (refer to the corresponding depth sections in and ), cluster C1 is from the overriding Burmese plate (). None of these clusters, however, shows any association with the Burmese Volcanic Arc, which implies their tectonic origin, rather than their volcanic affinity.
Table 2. Earthquake parameters defining the clusters.
Figure 6. (a) Tectonic map with results of CMT solutions for the three clusters, C1–C3, for the Burmese Arc. Digits refer to CMT solutions indexed in . Grey circles are epicentres of earthquakes with m b ≥5. Notice that thrust mechanisms dominate in all three clusters, where the P–T axes are orientated NE–SW and NW–SE directions. Seismological depth sections in BAAS: across the clusters (b) C1, (c) C2 and (d) C3. DF: Dauki Fault; EBT: Eastern Boundary Thrust; SF: Sagaing Fault; VA: Volcanic Arc.
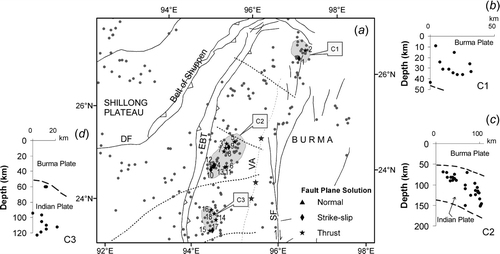
The clusters C1–C3 are separated by lithospheric hinge faults, where subduction penetrates to depths of 150 km at the location of cluster C1 to 200 km at cluster C3, but then diminish to 160 km to the immediate south (Dasgupta et al. Citation2003). The average dip of the Benioff zone below the three clusters ranges from 42° to 50° E (). Most of the Burmese Arc seismic potentiality is therefore expected at these locales where the clusters are seen. Note that the remainder of the Burmese Arc for a distance of 1000 km up to north Andaman (where the next neighbouring clusters C4 and C5 are seen) is a cluster-free region (), as signified by its rather low level of seismicity. This is probably an outcome of passive tectonic process where the hanging lithospheric slab is being dragged northward through the surrounding lithosphere, as postulated by Le Dain et al. (Citation1984). A somewhat analogous ‘low seismic’ region and an example of time-dependent earthquake occurrence are known for the Lower Rhine Embayment (Faenza et al. Citation2007).
3.2 Andaman Arc Clusters
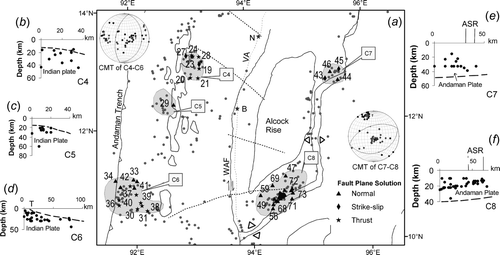
Seismic clusters C4–C9 are located between central and south parts of the Andaman Arc (, and ). As before, the earthquake parameters of the clusters are also indexed in . All of them are shallow depth clusters but contain higher-magnitude shocks (often exceeding m b = 6.0, sometimes as high as m b = 8.0). Clusters C4 and C5 are located over the Andaman fore-arc ( and (c)), whereas cluster C6 is found at the south Andaman trench () (this is similar to cluster C12 seen for the West Sunda Trench; see below). Clusters C7 and C8 are correlated with the ASR (, (e) and (f)). Cluster C9 is the longest of all; it has a strike length of 324 km, contains maximum number of earthquakes and is clearly associated with the West Andaman Fault and its southern continuation to the Semangko Fault in Sumatra ( and (b)). The penetration depth of the subducting Indian plate in central and south Andaman extends from 130 to 220 km, where the dip of the Benioff zone varies from 30° to 45° E (Dasgupta et al. 2003). Such large variations in both the penetration depth and dip angle of the Benioff zone are typical of plate kinematics in the central and southern parts of the Andaman arc.
Figure 7. (a) Tectonic map with results of CMT solutions for clusters C4–C6 below the Andaman fore arc and clusters C7 and C8 below the ASR; see for results of the CMT solutions. Composite CMT is in the inset with grey colour circle for P axes and black circle for T axes. Other symbols are as in . Thrust mechanisms dominate in the Andaman fore arc, while normal mechanisms dominate the ASR. Notice that P–T axes are orientated E–W for the fore arc but N–S for the ASR. Seismological depth sections in BAAS: across the clusters (b) C4, (c) C5, (d) C6, (e) C7 and (f) C8. ASR: Andaman Spreading Ridge; B: Barren Volcano; N: Narcondam; SR: Sewell Rise; VA: Volcanic Arc; WAF: West Andaman Fault.
3.3 West Sunda Arc Clusters
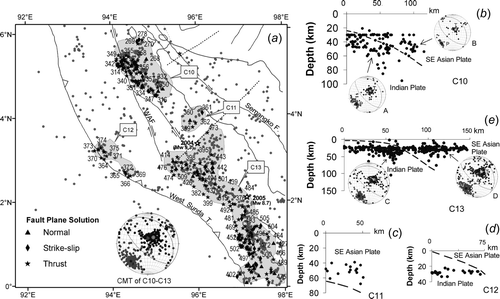
Seismic clusters C10–C13 are seen in offshore Sumatra ( and ). As before, the earthquake parameters of the clusters are indexed in . These are shallow to moderate depth clusters with a high seismicity. The configuration for all four clusters follows the structural outline of the outer sedimentary arc of the Nias and other islands. Seismically, this presents one of the most destructive regions in the world, where the 26 December 2004 Sumatra earthquake (M w 9.3) and 2005 Banyak Island earthquake (M w 8.7) hit. Cluster C13 is the widest of all in this zone () with a strike length of 460 km. Clusters C10 and C13 have earthquakes belonging to both plates ( and 9(e)), whereas cluster C11 belongs only to the overriding SE Asian plate (). Cluster C12 is located below the West Sunda Trench ().
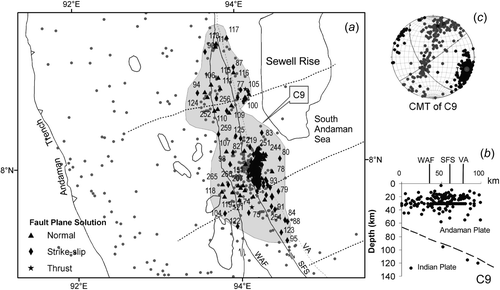
Figure 8. (a) Cluster 9 skirting the Sewell Seamount, where a nascent rift was described elsewhere (Mukhopadhyay et al. Citation2010). Other symbols are as in . Cluster 9 typically demonstrates normal solutions for the rift, whereas strike-slip mechanisms correspond to the regional faults transverse to the rift. T axes are orientated WNW–ESE, suggesting the rifting direction perpendicular to it. (b) Seismological depth section across C9 and (c) summary plot for focal mechanism stress axes. SFS: Semangko Fault System; VA: Volcanic Arc; WAF: West Andaman Fault. The black dotted line in the depth sections traces the top of the subducting plate; the trajectories are from our earlier work (Dasgupta et al. Citation2003).
The present understanding on subduction kinematics for this complex arc can be improved only when a comparison of results of clustering analysis with more homogeneous data sets becomes available with a combination of greater instrumental data coverage, in particular, for smaller magnitude earthquakes. A temporary digital network established on the Andaman Islands by the Geological Survey of India recorded about 18,000 small aftershocks in about 10 weeks following the 26 December 2004 Sumatra earthquake; the recorded magnitude is 3.0 and above (Mishra et al. Citation2007).
4 Stress distributions and strain partitioning within seismic clusters
The Indian plate moves in a N10° E to N17° E direction between latitude 2° N (95° E longitude) and 4° N (93° E) at rates of 52 mm and 61 mm per year, respectively, beneath the Sunda Plate (Sieh and Natawidjaja Citation2000). The motion changes its orientation to N23° E at 9° N latitude (92° E longitude) at a rate of about 54 mm per year (DeMets et al. Citation1990). GPS data also indicate a non-negligible east–west convergence along the Andaman arc (Paul et al. Citation2001). Such differential movement vectors making a small angle to the trench axis in this oblique deformation front are partitioned between two stress components, one parallel to the trench and the other perpendicular to it. The trench parallel motion has been consumed along a large-scale crustal structure with a dominant strike-slip motion (WAF, SFS and Shan-Sagaing fault) parallel to the trench along fore-arc and also by back-arc spreading in ASR by leaky transform tectonics. The trench perpendicular component generates large-scale thrust-related motions in segments along the fore-arc (Eastern Boundary Thrust; gap between the Andaman trench and WAF, etc.).
The stress distribution and strain partitioning along different sectors have been studied in details on map and in depth sections across the clusters. Tectonic analyses of clusters are carried out with the help of composite CMT plots generated from 518 well-constrained CMT solutions collected from the HRVD website. The zone from north Burma to Sumatra has been associated with both positive and negative slips; the positive slip is accommodated primarily by thrust motion, whereas the negative slip is by normal fault or oblique slip movements. The pure strike–slip motion is in between positive and negative slips. The composite CMT plots are constructed for the clusters ( –) distributed along the entire length of the Burmese–Andaman arc to illustrate the variation in stress axes and orientation of causative fault planes. By composite CMT plot, here we mean that all the P, T axes and pole of nodal planes of the earthquakes belonging to one cluster/multiple clusters (as the case may be) are plotted on a stereographic projection for tectonic analysis, irrespective of their type of fault plane solutions.
Figure 9. (a) Clusters C10–C13 in offshore Sumatra. This is by far the largest cluster found for the study area and is also seismically the deadliest. Other symbols are as in . Mostly thrust mechanisms prevail in the region of all four clusters, where P–T axes are orientated NE–SW. A summary plot for focal mechanism stress axes is shown in the inset. Seismological depth sections: (b) across C10 and summary plot for focal mechanism stress axes; (c) across C11; (d) across C12; and (e) seismologic section across cluster C13 of WSA, and summary plot for focal mechanism stress axes. Note the coupling between the lower and upper plates in the C10 and C13 clusters. OAR: Outer Arc Ridge; SFS: Semangko Fault system; T: Andaman Trench; VA: Volcanic Arc; WAF: West Andaman Fault.
4.1 Burmese Arc Clusters: C1–C3
CMT solutions corresponding to all three clusters found for the Burmese Arc are listed in . This is a thrust-dominated domain, with subordinate strike-slip movements. Cluster C1 is a shallow focus thrust–strike-slip domain in the overriding Burma plate; C2 is an intermediate focus (>100 km) thrust-dominated domain with occasional strike–slip earthquakes along the plate interface/subducting Indian Plate. Similarly, C3 indicates a predominantly thrust domain in the subducting Indian Plate. It can also be seen that the strike-slip earthquakes within this predominantly thrust domain occur along the terminal ends of the elliptical cluster boundary. These strike slip earthquakes occur due to the movement of adjacent cross-cutting hinge faults, inferred by Dasgupta et al. (Citation2003). Thus, the three clusters in between EBT and the volcanic arc indicate earthquake concentration predominantly along the plate interface or within plate. The CMT solution shows an overall NE–SW compression at a shallow angle (10°) and a NW–SE extension at a moderately high angle (56°) along this sector (). The CMT data clearly show a dominance of thrust movement in the C2–C3 clusters with subordinate strike-slip motion both occurring even beyond a depth of 100 km; this was indicated previously by Stork et al. (Citation2008) in the Burma subduction zone.
Table 3. CMT solutions (source: http://www.seismology.harvard.edu) for 518 earthquakes for the Burmese–Andaman and West Sunda Arc system. The solution parameters are discussed in text in relation to the seismic clusters. *Solution on the basis of Aki–Richards convention on slip. The value of first column (No) is plotted on the maps (figures 5(a)–8(a)).
Table 4. Composite CMT solutions for the Burmese–Andaman and West Sunda Arc system (reference –8).
The right-lateral strike-slip motion in both the plates is consistent with the geometry in Burmese arc and surrounding terrains in China where right-lateral strike-slip movement predominates along N–S to NW–SE planes. The motion of the Indian plate is primarily accommodated by the positive slips associated with the thrust movement along EBT zones resulting in formation of C2 and C3 clusters. The counter motion on the overriding plate generates the cluster C1. The residual slip adjustment takes place along the Shan-Sagaing fault that principally accommodates a sizeable amount of the motion by aseismic slip/creep along its length up to the Gulf of Martaban and may have contributed to the extension along ASR.
4.2 Andaman Arc Clusters: C4–C8
Seismic clusters C4, C5 and C6 underlie the Andaman fore arc; they are thrust-dominated clusters with normal fault events (). These shallow focus thrust and normal fault events have predominantly been generated by bending of the subducting Indian Plate and occurred at the leading edge of the subduction zone and the trench where the Indian plate descends. The concentration of strike-slip events in the northern extremity of C4 cluster indicates the strike-slip movement along the adjacent mantle penetrating hinge fault. Clusters C7 and C8 found below the ASR exhibit predominantly normal and subordinate strike-slip events that illustrate the basic tectonic pattern under the spreading arc. The strain partitioning in terms of normal and strike-slip movement demonstrate dyke intrusion, spreading, rift formation and collapse of rift wall, rift-related volcanism and generation of earthquake swarms along ASR (Mukhopadhyay and Dasgupta Citation2008). The composite CMT plot of C4, C5 and C6 clusters disposed parallel to the Andaman trench shows thrust movement along N–S-oriented thrust planes dipping ∼30° easterly (). Both compression and tensional directions are oriented E–W where compression prevails at a shallower angle (24°), while extension is taken up at higher angle (64°). This situation gets reversed at C7–C8 clusters along ASR where overall strain partitioning is normal along ENE–WSW-oriented planes. Overall compression is at a high angle (79°) along NW–SE, whereas extension dominates at a shallower angle (12°) along a NNW–SSE direction (). The tectonics along clusters C7 and C8 is represented by penetration of crustal scale faults inside the hot mantle along the upper plate, influence of branches of Kerguelen plume, magmatic dyke intrusion, rifting and spreading that have been taken place for last 4 Ma. The cluster has a shallow depth connotation up to 30 km, which by itself is suggestive of the presence of an upwelling hot mantle underneath it.
4.3 South Andaman Sea Cluster C9
This large cluster has almost equal numbers of normal and strike-slip events. The distribution of both strike-slip and normal fault events in this cluster zone actually corresponds to a complex faulting episode: normal faulting for the rift zone and strike-slip movements for its transgressive regional faults. This cluster is found in the area where a swarm of events originated within a span of only 6 days between 26 and 31 January 2005, following the occurrence of the great Andaman earthquake (M w 9.3) of 26 December 2004. The analysis and supporting evidence suggest that the earthquakes in this cluster are generated by intruding magmatic dykes along the weak zones in the crust, followed by rifting, spreading and collapse of rift walls (Mukhopadhyay and Dasgupta Citation2008). Magma injection in rifted areas commonly invokes the injection of shallow, vertical, en-echelon dykes extending along a narrow rift zone, and this injection accounts for the initial strike-slip motion followed by the collapse of the closely spaced inner rift wall with earthquakes of a normal fault source mechanism (Hill Citation1977). Similarly, CMT solutions for 2005 swarm activity indicate that intrusion of magmatic dyke in the crustal weak zone is documented by earthquakes showing a strike-slip solution. Subsequent events with a normal fault mechanism corroborate the rift formation, collapse and its spread. The overall composite CMT plot () indicates a major strike-slip motion with an appreciable normal component along a steep-dipping (86°) NE–SW plane. Both compressional and tensional axes make a shallow angle (24–16°) along the N–S and ESE–WNW directions respectively (). The composite plot along the WAF shows primarily a normal with right-lateral strike-slip component along a steep dipping NE–SW trending surface in the overriding upper plate. Based on evidence from seismology, bathymetry, gravity, time-dependent pore pressure perturbations, rift-related volcanism and calculations on phases of rifting, we assume that a nascent rift is in the process of formation at this location (Mukhopadhyay and Dasgupta Citation2008, Mukhopadhyay et al. Citation2010). The orientation of the nascent rift is perpendicular to the regional trend of strike-slip faults of WAF and SFS.
4.4 Offshore Sumatra Clusters: C10–C13
This is by far the largest and most active seismic zone in the whole region. This zone contains the aftershocks of two great earthquakes of recent times (Sumatra–Andaman earthquake M w 9.3 of 26 December 2004 and Banyak Island earthquake M w 8.7 of 28 March 2005). The zone () is almost exclusively dominated by earthquakes of thrust mechanisms, related to the underthrusting of the Indian plate below the Sunda Arc and also from the overriding SE Asian Plate. The overall orientation of the thrust planes derived from the composite CMT plot is NW–SE dipping 25° north-easterly (, ). P–T axes are orientated NE–SW in close correspondence to the structural disposition of the arc geometry. The concentrations of normal fault-related earthquakes in the longitudinal ends of otherwise thrust-dominated cluster C13 are probably indicative of severe gravity adjustments following the thrusting events. The association of earthquakes belonging to both subducting and overriding plates to create the clusters will be discussed in detail in the following section.
In this section, cluster C10 consists of two clusters A and B (, ). These two clusters belong to the Indian and SE Asian plates. The strain partitioning and stress distribution is similar in both these clusters depicting consistent thrust motion along the NW–SE plane (parallel to arc disposition) dipping less than 30° north-easterly. Such consistent thrust plane geometries along subducting and overriding plates is also noticed in the depth section following the largest cluster C13 in this belt (). The depth section across cluster C13 shows that it contains two clusters C (subducting Indian plate cluster) and D (overriding SE Asian plate cluster). Both these clusters have thrust-dominated movement along the NW–SE striking plane dipping less than 22° towards the north-east parallel to WSA.
Similar geometry and stress partitioning in both the plates in clusters C10 and C13 indicate high seismic coupling, with the extreme compressive nature of this zone resulting from slow subduction of the old Indian plate (Stein and Okal Citation2007). Here, a noticeable feature is the absence of trench parallel strike-slip motion that is otherwise so prominent along the entire belt. The fault unclamping along shallow dipping thrust planes (<30°) resulted in the Sumatra–Andaman earthquake of 2004 (M w 9.3) and Banyak Island earthquake of 2005 (M w 8.7) on either side of the cluster C13 without altering the fault zone frictional condition (Bilek Citation2007), having a sharp boundary of separation of aftershocks (Engdahl et al. Citation2007) along a NNE–SSW ridge that acts as a separator (Franke et al. Citation2008). The two earthquakes have a different strain release pattern (Dewey et al. Citation2007). The high seismic coupling breaks down northward in between C10 and C9 () due to the very buoyant warm crust towards the north (from the tomographic results of Shapiro et al. Citation2008) where the strike-slip component is dominant again. The zone also indicates probable crustal heterogeneity as indicated by differential slip along the rupture plane recorded along the arc during the rupture propagation of the 2004 Andaman Earthquake (Subarya et al. Citation2006, Banerjee et al. Citation2007, Rhie et al. Citation2007). From cluster C9 northward, under the Andaman frontal arc region, the oblique component of plate motion predominates due to a probable influence of the aseismic 90° E Ridge on the Indian Plate (Gahalaut et al. Citation2010), whereas south to it, compressive components of the thrust realm predominate, as indicated in the present study. This inference prompts us to believe that future mega-thrust events (with potential to generate a tsunami in the Indian Ocean) will only be restricted in between the clusters C10 and C13. The potentiality of this zone to generate a tsunamogenic earthquake is also discussed elsewhere (Fujii and Satake Citation2007, Hébert et al. Citation2007) along with physical records of tsunami from the last 1000 years (Monecke et al. Citation2008). The clusters and intervening zone between C1 and C10 may spawn moderate magnitude earthquakes resulting from either strike-slip or normal movement. The occurrence of one major earthquake on 11.8.2009 (m b 7.6; latitude 14.013: longitude 92.923) as a slab bending event with a normal fault plane solution (NEIC) north of north Andaman Island attests this conclusion.
5 Seismic potentiality of the large clusters
Seismic potentiality in terms of maximum earthquake size and predictable crustal movement associated with the five large clusters discussed in the foregoing, namely C2, C8, C9, C10 and C13, are attempted here. The purpose of this analysis is to make a statistical inference on the probable size of an earthquake expected from the large clusters. This is done using an approach discussed by Wells and Coppersmith (Citation1994). The analysis is based on the length of the major axis of a cluster already derived () and by treating it as the ‘potential rupture length’ to predict the earthquake size depending on the type of movement–strike-slip or thrust.
Maximum seismic potentiality is inferred for cluster C13 that may spawn an earthquake of estimated size M w 8.8, with a rupture length of 460 km, having an anticipated thrust movement. In fact, this zone of seismic cluster has generated two mega-earthquakes in the recent past: Sumatra–Andaman earthquake M w 9.3 of 26 December 2004 and the Banyak Island earthquake M w 8.7 of 28 March 2005. Similarly, clusters C2 and C10 with a thrust affinity can generate earthquakes of maximum magnitude M w 7.9 and 8.2, whereas C8 and C9 may generate earthquakes of M w 7.6 and 8.2, respectively.
6 Conclusions
The seismicity map and its correlation to crustal and mantle faults for the BAAS and WSA are given in this study. For this, only 1752 events of m b = 5.0 and above are selected, using frequency–magnitude relationships, from an earthquake catalogue of 13,057 events, spread over more than a century. The selected events constitute barely 14% of the entire dataset. A cluster analysis using the methodology discussed in this study brings out 13 clusters distributed in different segments of the arc system. Nearly half the earthquake population below the arc is actually confined to these clusters that have a linear fractal geometry consistent with the traces of seismogenic surfaces. Correlation of clusters to seismological depth sections and the result derived from 518 CMT solutions of earthquakes reveals details on the distribution of stress axes, their variation between the individual clusters and the corresponding faulting pattern. With the exception of the back-arc seismicity (clusters C7 and C8), the clusters correspond closely with the thrust planes under the fore-arc. Epicentres in clusters are much shallower, only 50 km (except C2 and C3), for BAAS and within 100 km for WSA. Moreover, the cluster in the western part (C12) of WSA is of a shallower depth of 30–40 km. This is interesting and important because clustering of seismicity is confined in both plates: the subducting Indian plate and the overriding Burmese/SE Asian plate. These results provide a composite three-dimensional perspective on the stress distribution between the clustered seismic zones of the arc and their relationship to focal depths. We have argued elsewhere that a nascent rift around 8° N latitude skirting the Sewell Seamount in south Andaman Sea shows up as a conspicuous seismic zone (Mukhopadhyay and Dasgupta Citation2008, Mukhopadhyay et al. Citation2010) (). It is interesting to note that this is situated near the present Cluster 9 in front of the Andaman subduction zone. The seismic potentiality of the clusters reveals that clusters C2, C8, C9, C10 and C13 may generate earthquakes varying from M w 7.6 to 8.8.
Acknowledgements
The authors are grateful to the two reviewers for their comments/suggestions which have helped to improve the earlier version of the manuscript.
Related Research Data
References
- Ansari , A. , Noorzad , A. and Zafarani , H. 2009 . Clustering analysis of the seismic catalog of Iran . Computers & Geosciences , 35 : 475 – 486 .
- Banerjee , P. , Pollitz , F. , Nagarajan , B. and Bürgmann , R. 2007 . Coseismic slip distributions of the 26 December 2004 Sumatra–Andaman and 28 March 2005 Nias earthquakes from GPS static offsets . Bulletin of the Seismological Society of America , 97 : S86 – S102 .
- Bertrand , G. and Rangin , C. 2003 . Tectonics of the western margin of the Shan plateau (central Myanmar): implication for the India-Indochina oblique convergence since the Oligocene . Journal South Asian Earth Science , 21 : 1139 – 1157 .
- Bilek , S. L. 2007 . Using earthquake source durations along the Sumatra–Andaman subduction system to examine fault zone variations . Bulletin of the Seismological Society of America , 97 : S62 – S70 .
- Cheng , Q. 1999 . The gliding box method for multifractal modeling . Computer Geoscience , 25 : 1073 – 1079 .
- Curray , J. R. , Emmel , F. J. , Moore , D. G. and Raitt , R. W. 1982 . “ Structure, tectonics and geological history of the northeast Andaman Ocean ” . In The Ocean Basins and Margins , Edited by: Nairn , A. E.M. , Stehli , F. G. and Ueyda , S. Vol. 6 , 399 – 450 . New York : Plenum .
- Curray , J. R. , Moore , D. G. , Lawver , L. A. , Emmel , F. J. , Raitt , R. W. , Henry , M. and Kieckhefer , R. 1979 . Tectonics of the Andaman Sea and Burma . American Association of Petroleum Geologists Bulletin , 29 : 189 – 198 .
- Dasgupta , S. , Mukhopadhyay , M. , Bhattacharya , A. and Jana , T. K. 2003 . The geometry of the Burmese–Andaman subducting lithosphere . Journal of Seismology , 7 : 155 – 174 .
- DeMets , C. R.G. , Gordon , G. F. , Argus , D. F. and Stein , S. 1990 . Current plate motions . Geophysics Journal International , 101 : 425 – 478 .
- Dewey , J. W. , Choy , G. , Presgrave , B. , Sipkin , S. , Tarr , A. C. , Benz , H. , Earle , P. and Wald , D. 2007 . Seismicity associated with the Sumatra–Andaman Islands earthquake of December 26, 2004 . Bulletin of the Seismological Society of America , 97 : S25 – S42 .
- Engdahl , E. R. , Villaseñor , A. , Deshon , H. R. and Thurber , C. H. 2007 . Teleseismic relocation and assessment of seismicity (1918–2005) in the region of the 2004 M w 9.0 Sumatra–Andaman and 2005 M w 8.6 Nias Island great earthquakes . Bulletin of the Seismological Society of America , 97 : S43 – S61 .
- Faenza , L. , Hainzi , S. , Scherbaum , F. and Beauval , C. 2007 . Statistical analysis of time-dependent earthquake occurrence and its impact on hazard in the low seismicity region Lower Rhine Embayment . Geophysics Journal International , 171 : 797 – 806 .
- Feeder , J. 1988 . Fractals , New York : Plenum Press .
- Franke , D. , Schnabel , M. , Ladage , S. , Tappin , D. R. , Neben , S. , Djajadihdja , Y. S. , Müller , C. , Kopp , H. and Gaedicke , C. 2008 . The great Sumatra–Andaman earthquakes – Imaging the boundary between the ruptures of the great 2004 and 2005 earthquakes . Earth and Planetary Science Letters , 269 : 118 – 130 .
- Fujii , Y. and Satake , K. 2007 . Tsunami source of the 2004 Sumatra–Andaman earthquake inferred from tide gauge and satellite data . Bulletin of the Seismological Society of America , 97 : S192 – S207 .
- Gahalaut , V. K. , Subrahmanyam , C. , Kundu , B. , Catherine , J. K. and Ambikapathy , A. 2010 . Slow rupture in Andaman during 2004 Sumatra–Andaman earthquake: a probable consequence of subduction of 90° E ridge . Geophysical Journal International , 180 : 1181 – 1186 .
- Hébert , H. , Sladen , A. and Schindelé , F. 2007 . Numerical modeling of the great 2004 Indian Ocean tsunami: focus on the Mascarene Islands . Bulletin of the Seismological Society of America , 97 : S208 – S222 .
- Hill , D. P. 1977 . A model of earthquake swarms . Journal Geophysical Research , 82 : 1347 – 1352 .
- Kagan , Y. Y. and Jackson , D. D. 1991 . Long-term earthquake clustering . Geophysical Journal International , 104 : 117 – 134 .
- Le Dain , A. Y. , Tapponnier , P. and Molnar , P. 1984 . Active faulting and tectonics of Burma and surrounding regions . Journal Geophysical Research , 89 : 453 – 472 .
- Mishra , O. P. , Kayal , J. R. , Chakroborty , G. K. , Singh , O. P. and Ghosh , D. 2007 . Aftershock investigation in the Andaman–Nicober Islands of India and its tectonic implications . Bulletin of the Seismological Society of America , 97 : S71 – S85 .
- Monecke , K. , Finger , W. , Klarer , D. , Kongko , W. , Mcadoo , B. G. , Moore , A. L. and Sudrajat , S. U. 2008 . A 1,000-year sediment record of tsunami recurrence in northern Sumatra . Nature , 455 : 1232 – 1234 .
- Mukhopadhyay , B. , Acharyya , A. , Mukhopadhyay , M. and Dasgupta , S. 2010 . Relationship between earthquake swarm, rifting history, magmatism and pore pressure diffusion – an example from South Andaman Sea, India . Journal of The Geological Society of India , 76 : 164 – 170 .
- Mukhopadhyay , B. and Dasgupta , S. 2008 . Swarms in Andaman Sea, India – a seismotectonic analysis . Acta Geophysica , 56 : 1000 – 1014 .
- Mukhopadhyay , M. 1984 . Seismotectonic of subduction and back-arc rifting under the Andaman Sea . Tectonophysics , 108 : 229 – 239 .
- Paul , J. , Burgmann , R. , Gaur , V. K. , Bilham , R. , Larson , K. M. , Ananda , M. B. , Jade , S. , Mukul , M. , Anupama , T. S. , Satyal , G. and Kumar , D. 2001 . The motion and active deformation of India . Geophysical Research Letter , 28 : 647 – 651 .
- Rhie , J. , Dreger , D. , Bürgmann , R. and Romanowicz , B. 2007 . Slip of the 2004 Sumatra–Andaman earthquake from joint inversion of long period global seismic waveforms and GPS static offsets . Bulletin of the Seismological Society of America , 97 : S115 – S127 .
- Shapiro , N. M. , Ritzwoller , M. H. and Engdahl , E. R. 2008 . Structural context of the great Sumatra–Andaman Island Earthquake . Geophysical Research Letter , 35 : L05301
- Sieh , K. and Natawidjaja , D. 2000 . Neotectonics of Sumatra fault, Indonesia . Journal of Geophysical Research , 105 : 295 – 326 .
- Stein , S. and Okal , E. A. 2007 . Ultralong period seismic study of the December 2004 Indian Ocean earthquake and implications for regional tectonics and the subduction process . Bulletin of the Seismological Society of America , 97 : S279 – S295 .
- Stork , A. L. , Selby , N. D. , Heyburn , R. and Searle , M. P. 2008 . Accurate Relative Earthquake Hypocenters Reveal Structure of the Burma Subduction Zone . Bulletin of the Seismological Society of America , 98 : 2815 – 282 .
- Subarya , C. , Chlieh , M. , Prawirodirdjo , L. , Avouac , J. P. , Bock , Y. , Sieh , K. , Meltzner , A. J. , Natawidjaja , D. H. and McCaffrey , R. 2006 . Plate-boundary deformation associated with the great Sumatra–Andaman earthquake . Nature , 440 : 46 – 51 .
- Turcotte , D. L. 1997 . Fractals and Chaos in Geology and Geophysics , Cambridge : Cambridge University Press .
- Wells , D. L. and Coppersmith , K. J. 1994 . New empirical relationships among magnitude, rupture length, rupture width, rupture area and surface displacement . Bulletin of the Seismological Society of America , 84 : 974 – 1002 .